In-work Benefits in Belgium: Effects on Labour Supply and Welfare
- UCLouvain - Saint-Louis Bruxelles, Belgium
Cite this article
as: A. de Mahieu; 2021; In-work Benefits in Belgium: Effects on Labour Supply and Welfare; International Journal of Microsimulation; 14(1); 43-72.
doi: 10.34196/ijm.00229
Figures
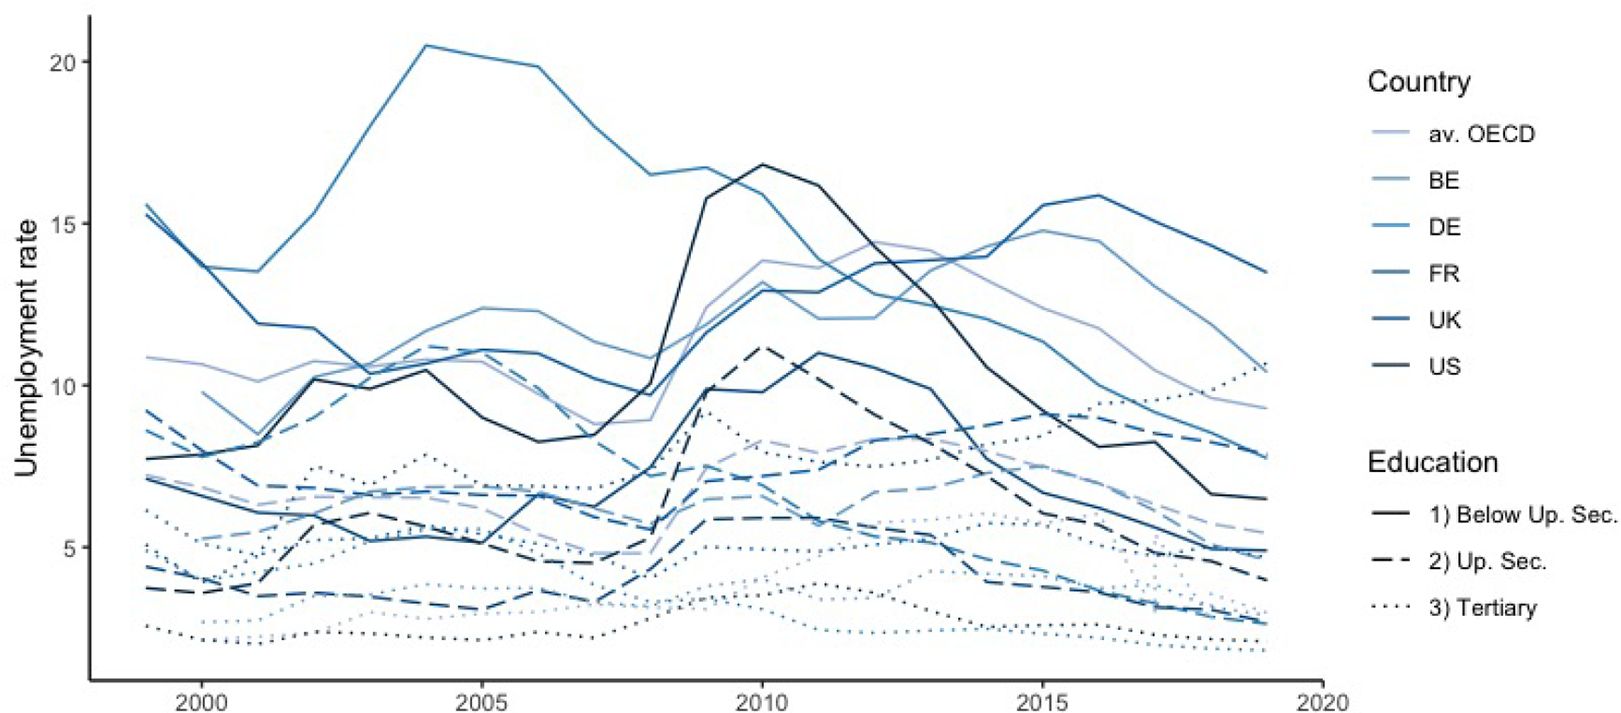
Figure 1

Unemployment rate by level of education (Source: OECD)
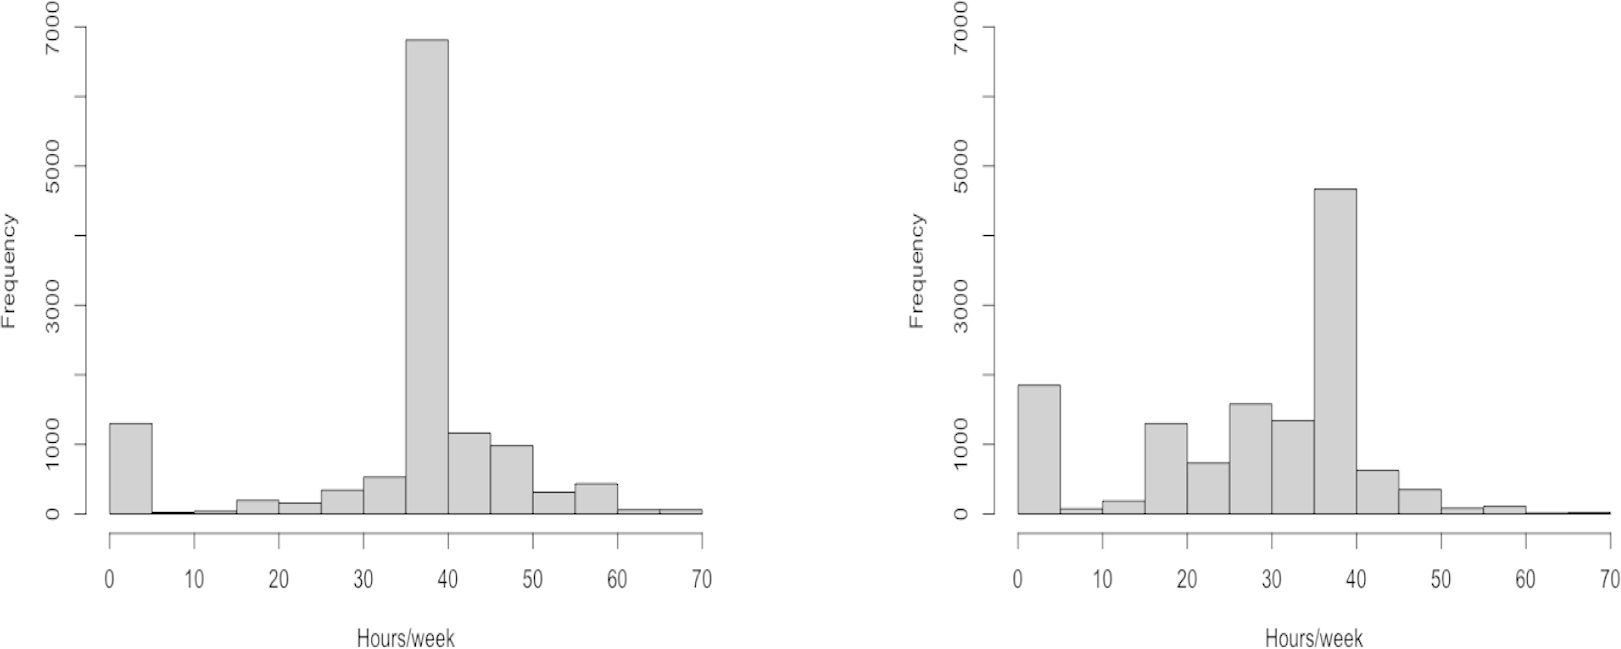
Figure 2
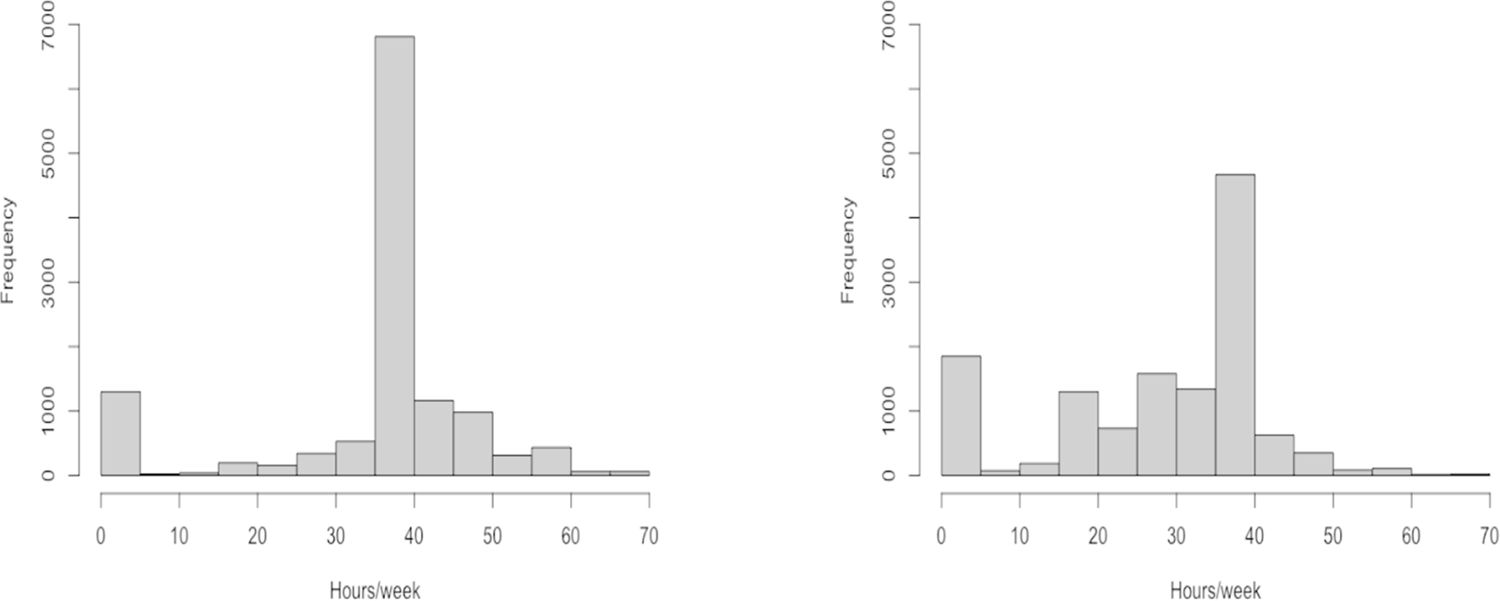
Labour supply distribution of men (left) and women (right) in the sample
Figure 3

Estimated indifference curves
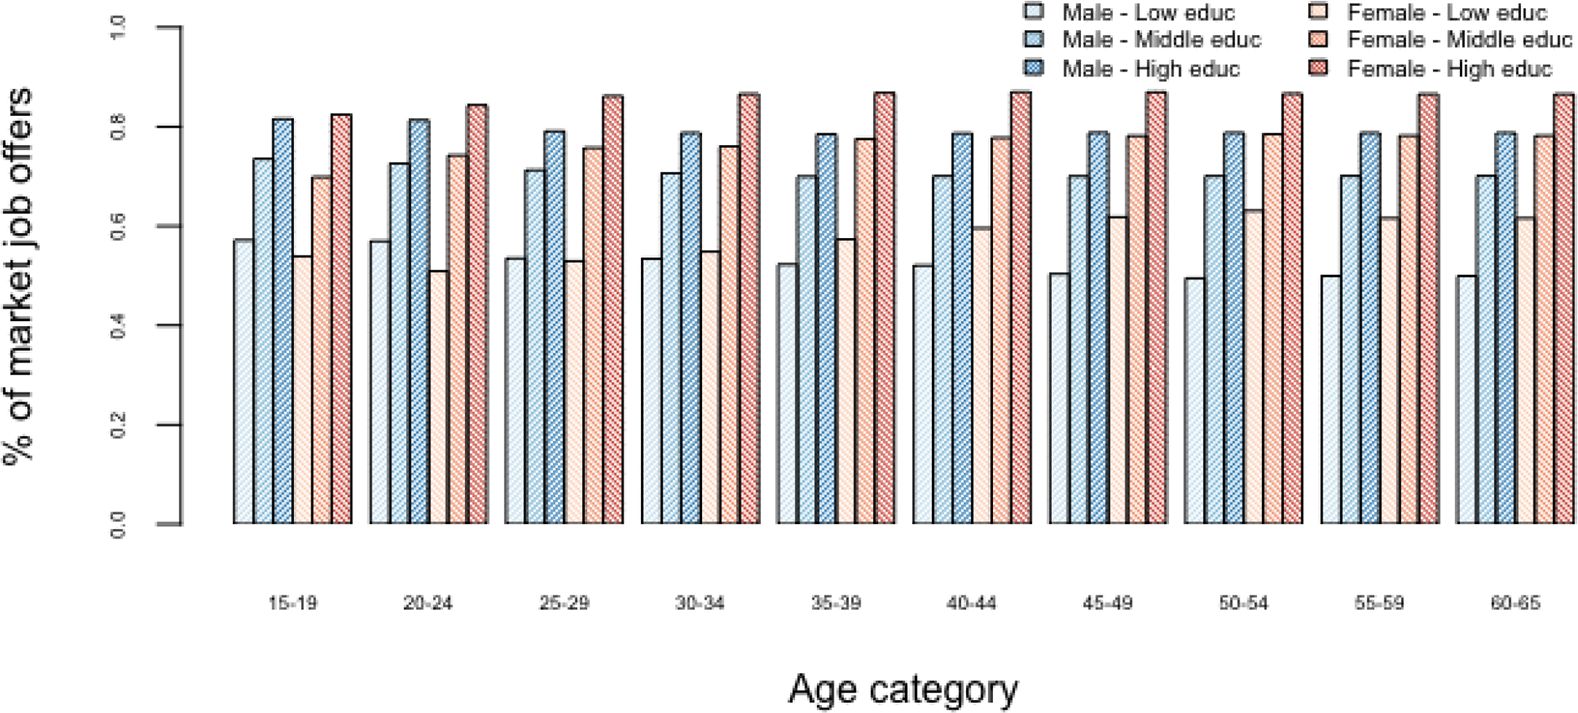
Figure 4

Estimated job offer intensity (2016)
Figure 5
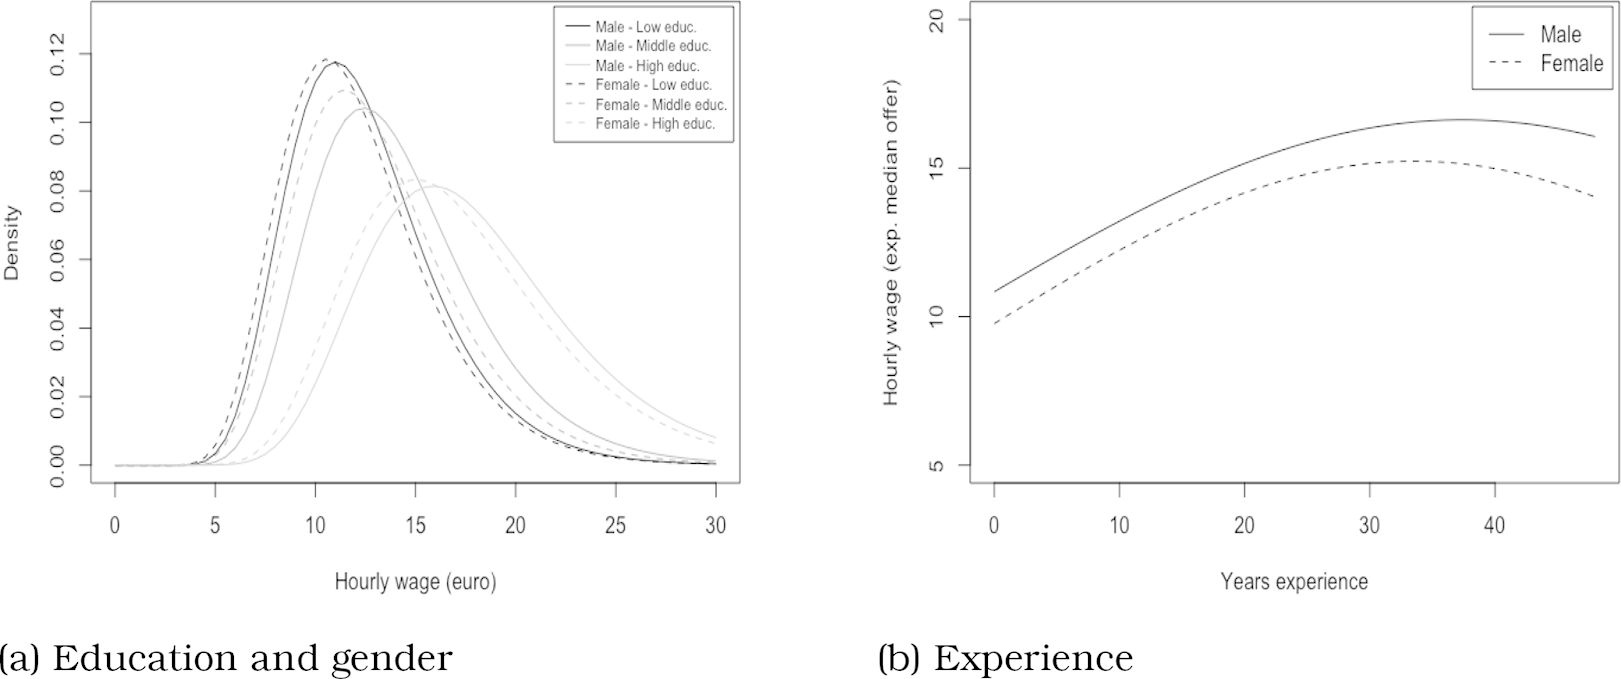

Effect of covariates on wage offers
Figure 6
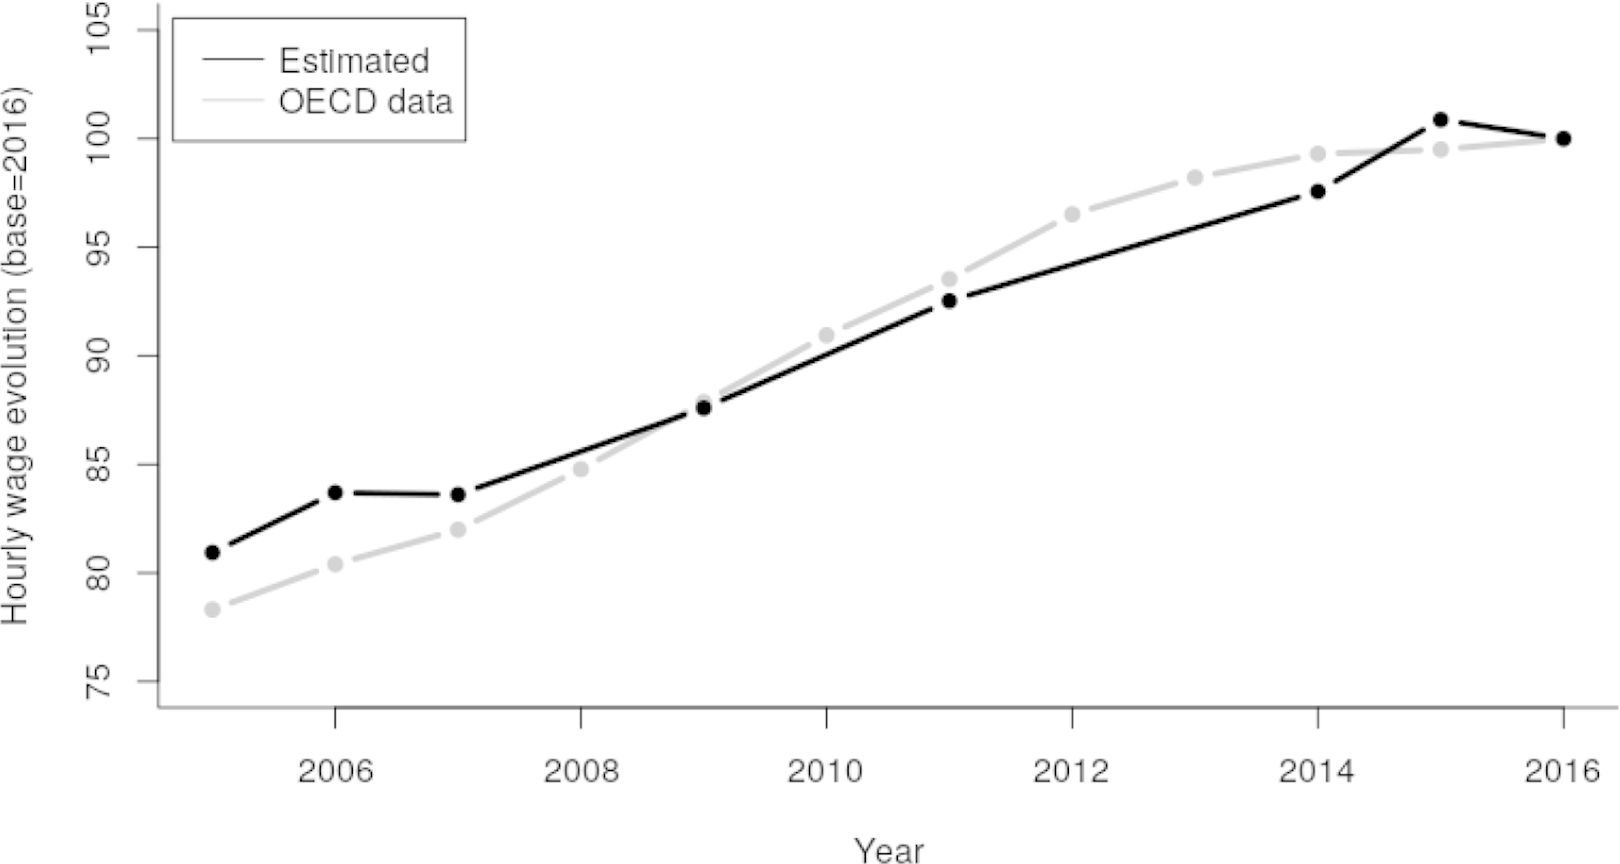

Estimated evolution of hourly wages
Figure 7
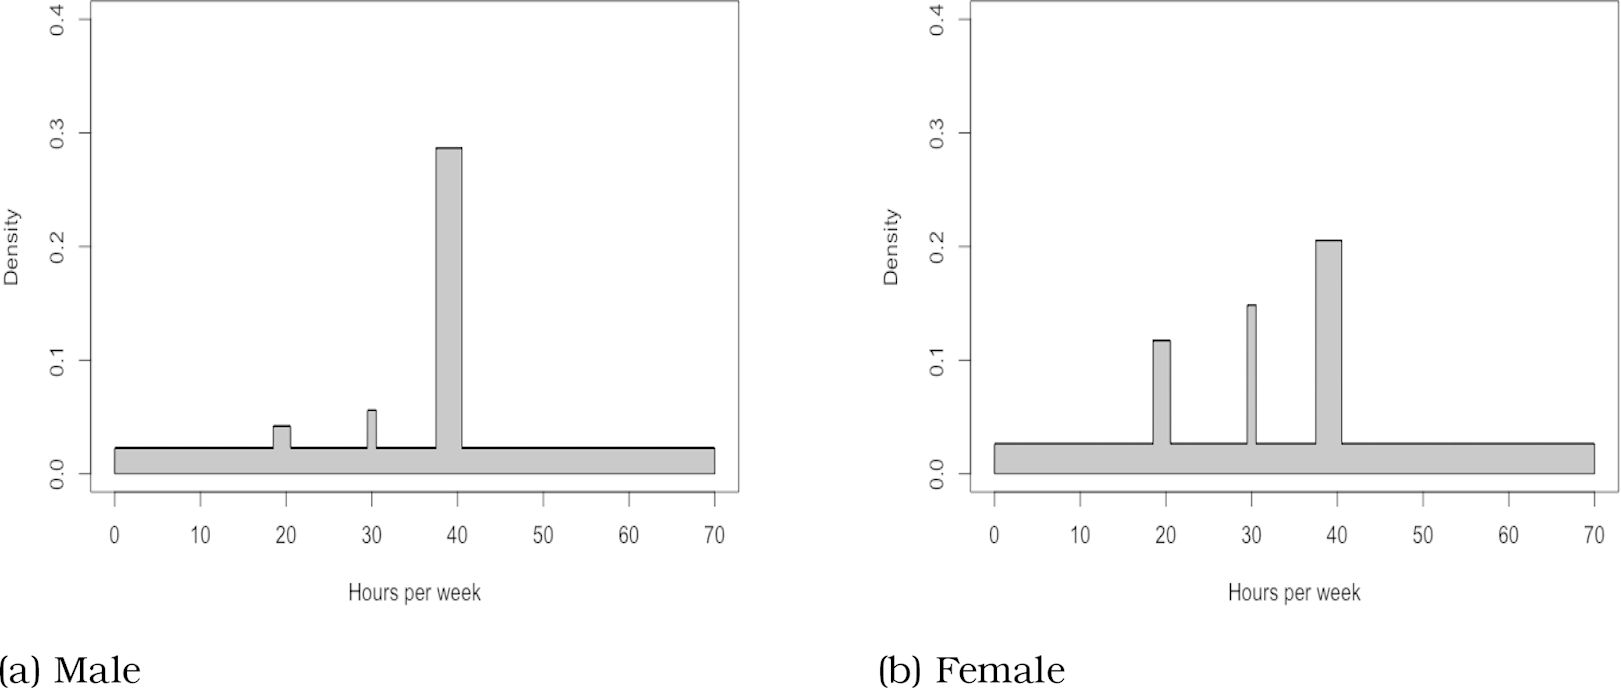

Estimated hours offers distribution
Figure 8
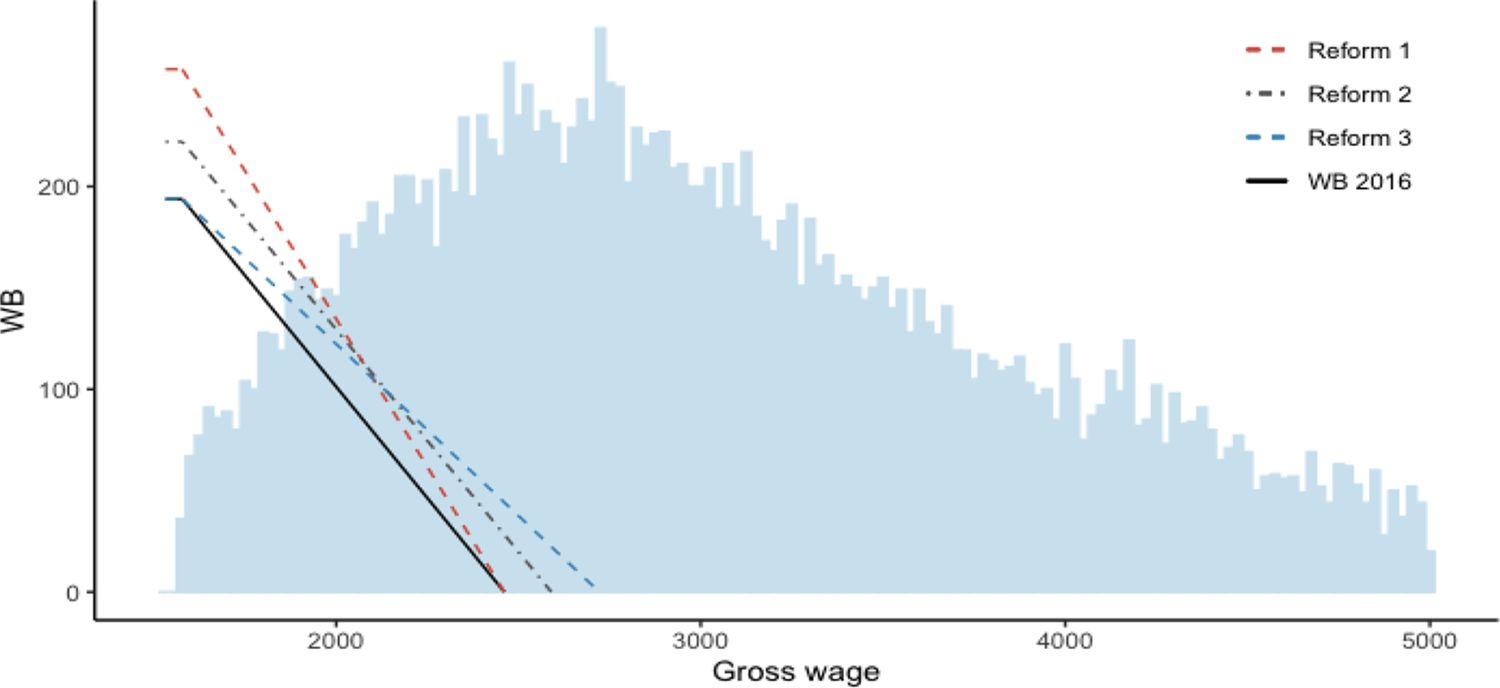
Level of WB in function of gross wage (full-time worker) and gross wage distribution
Figure 9
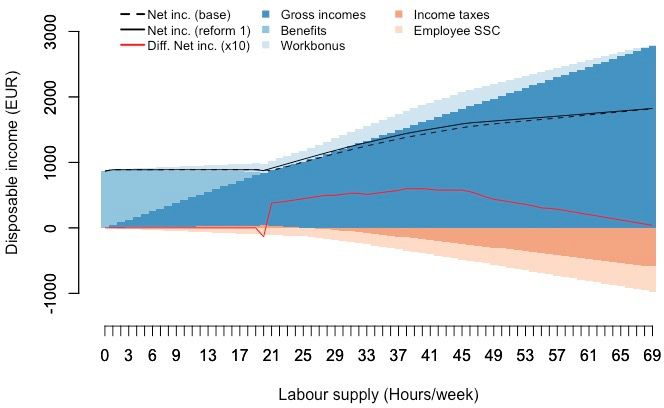

Budget set of single working at min. wage - base and reform 1
Figure 10
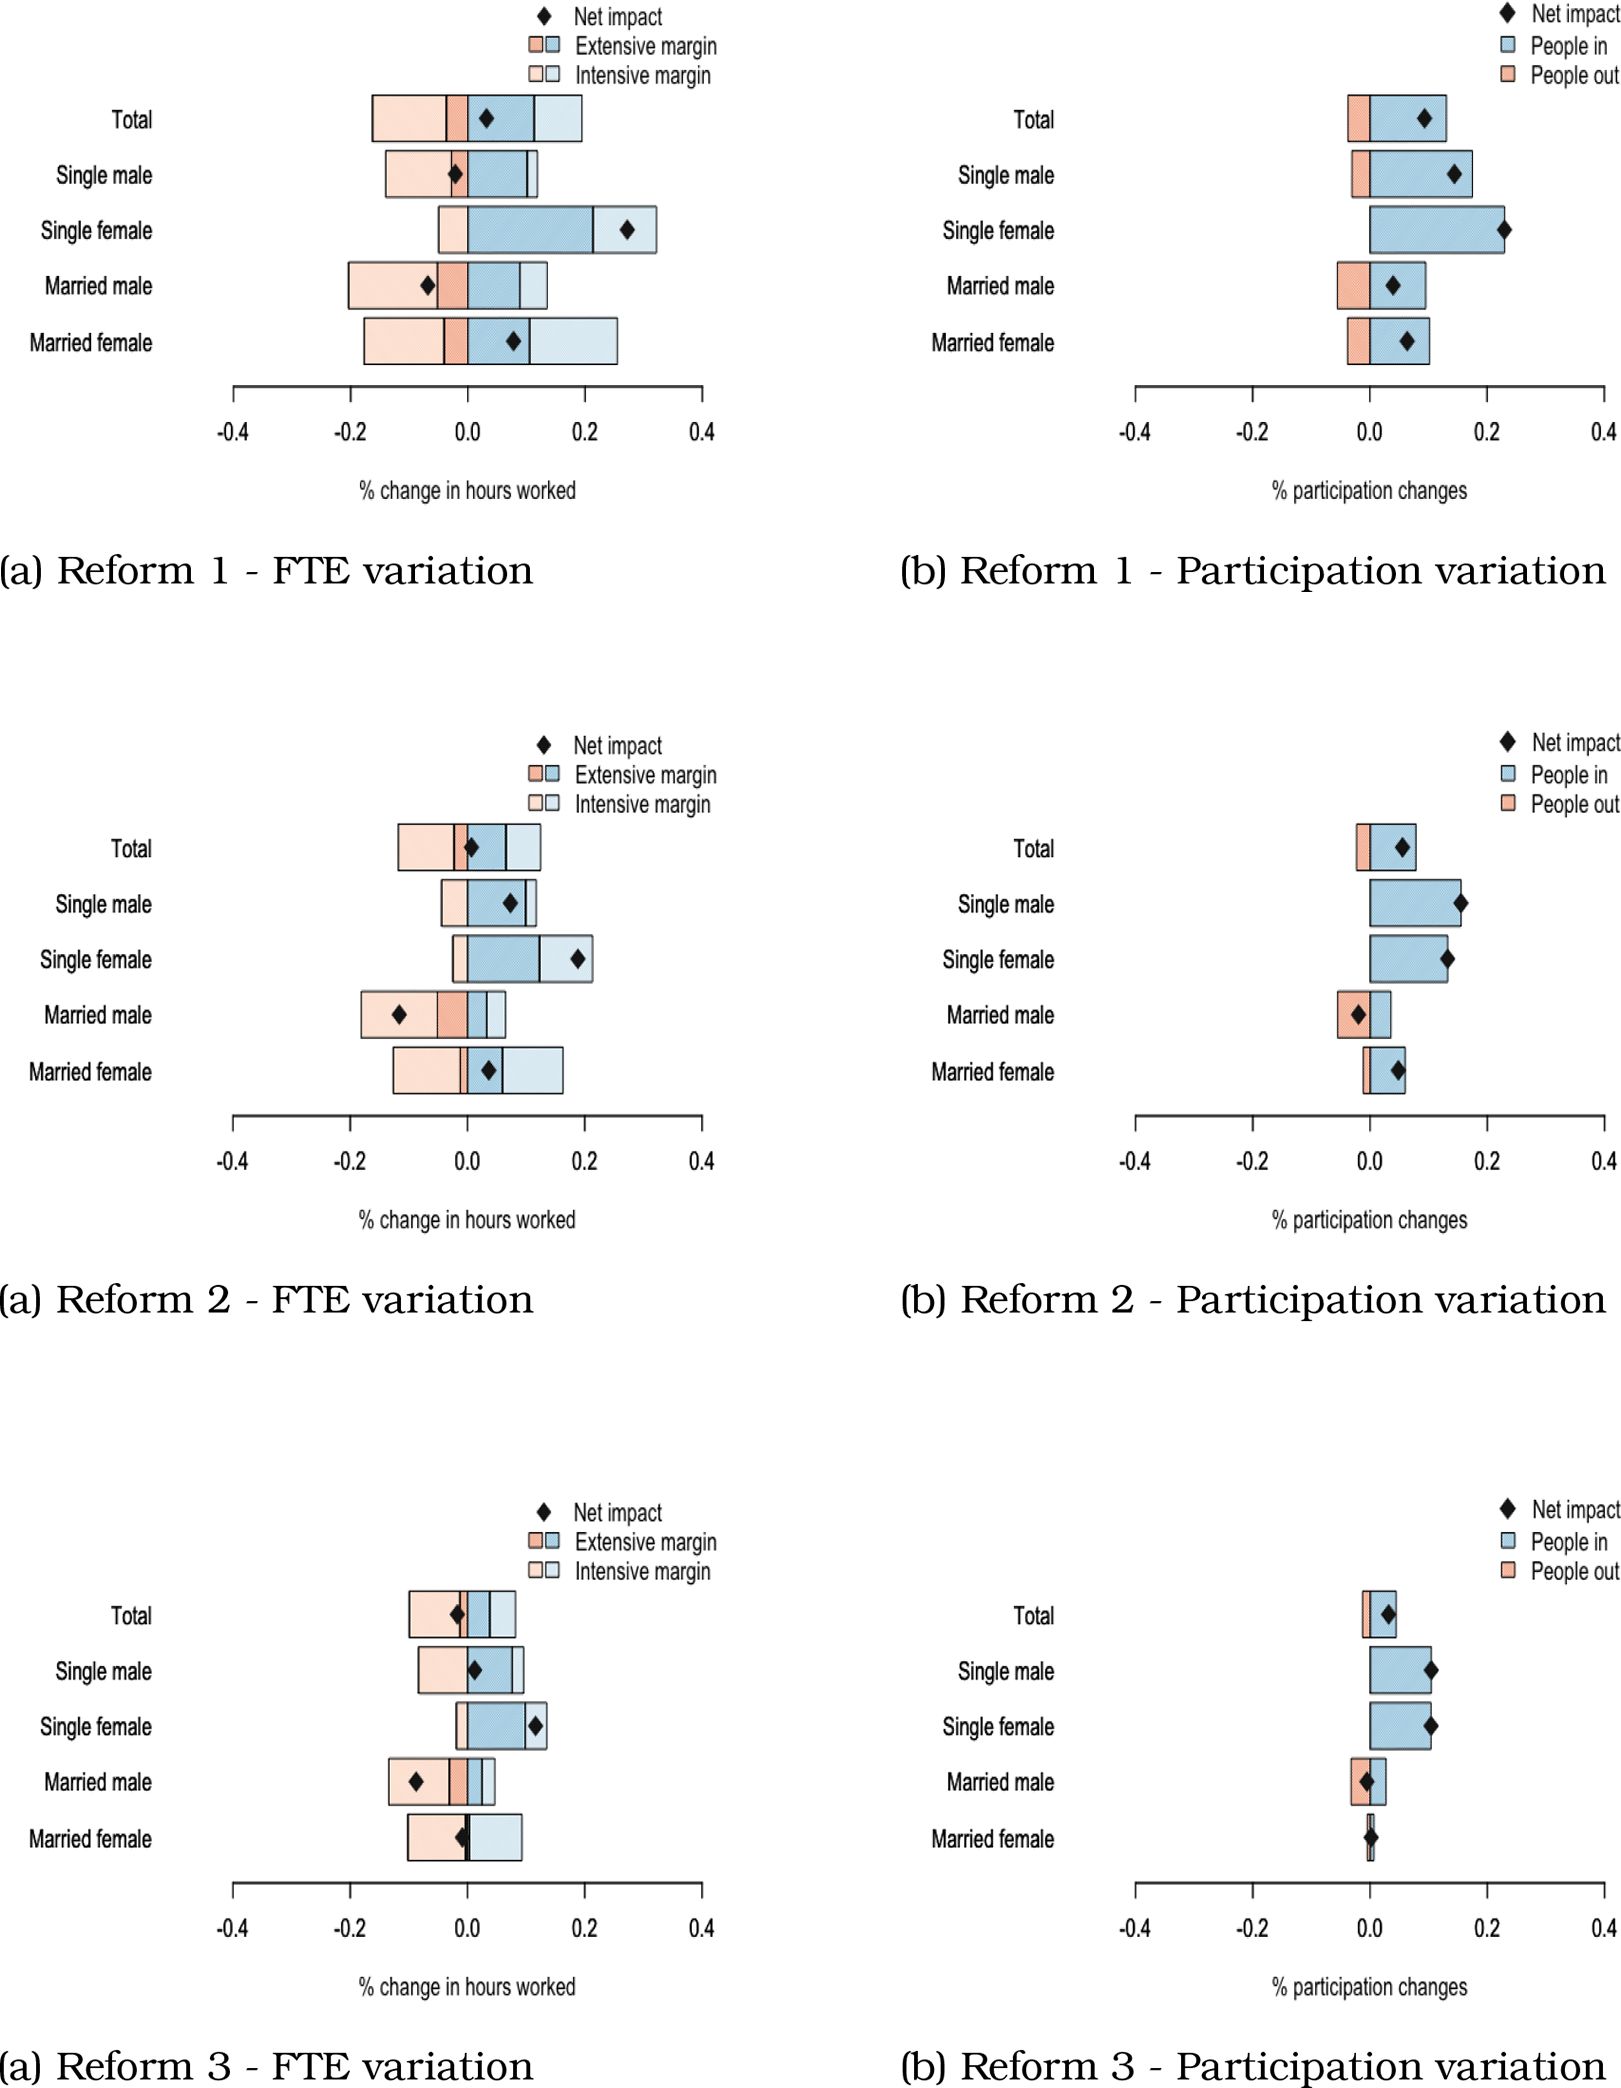
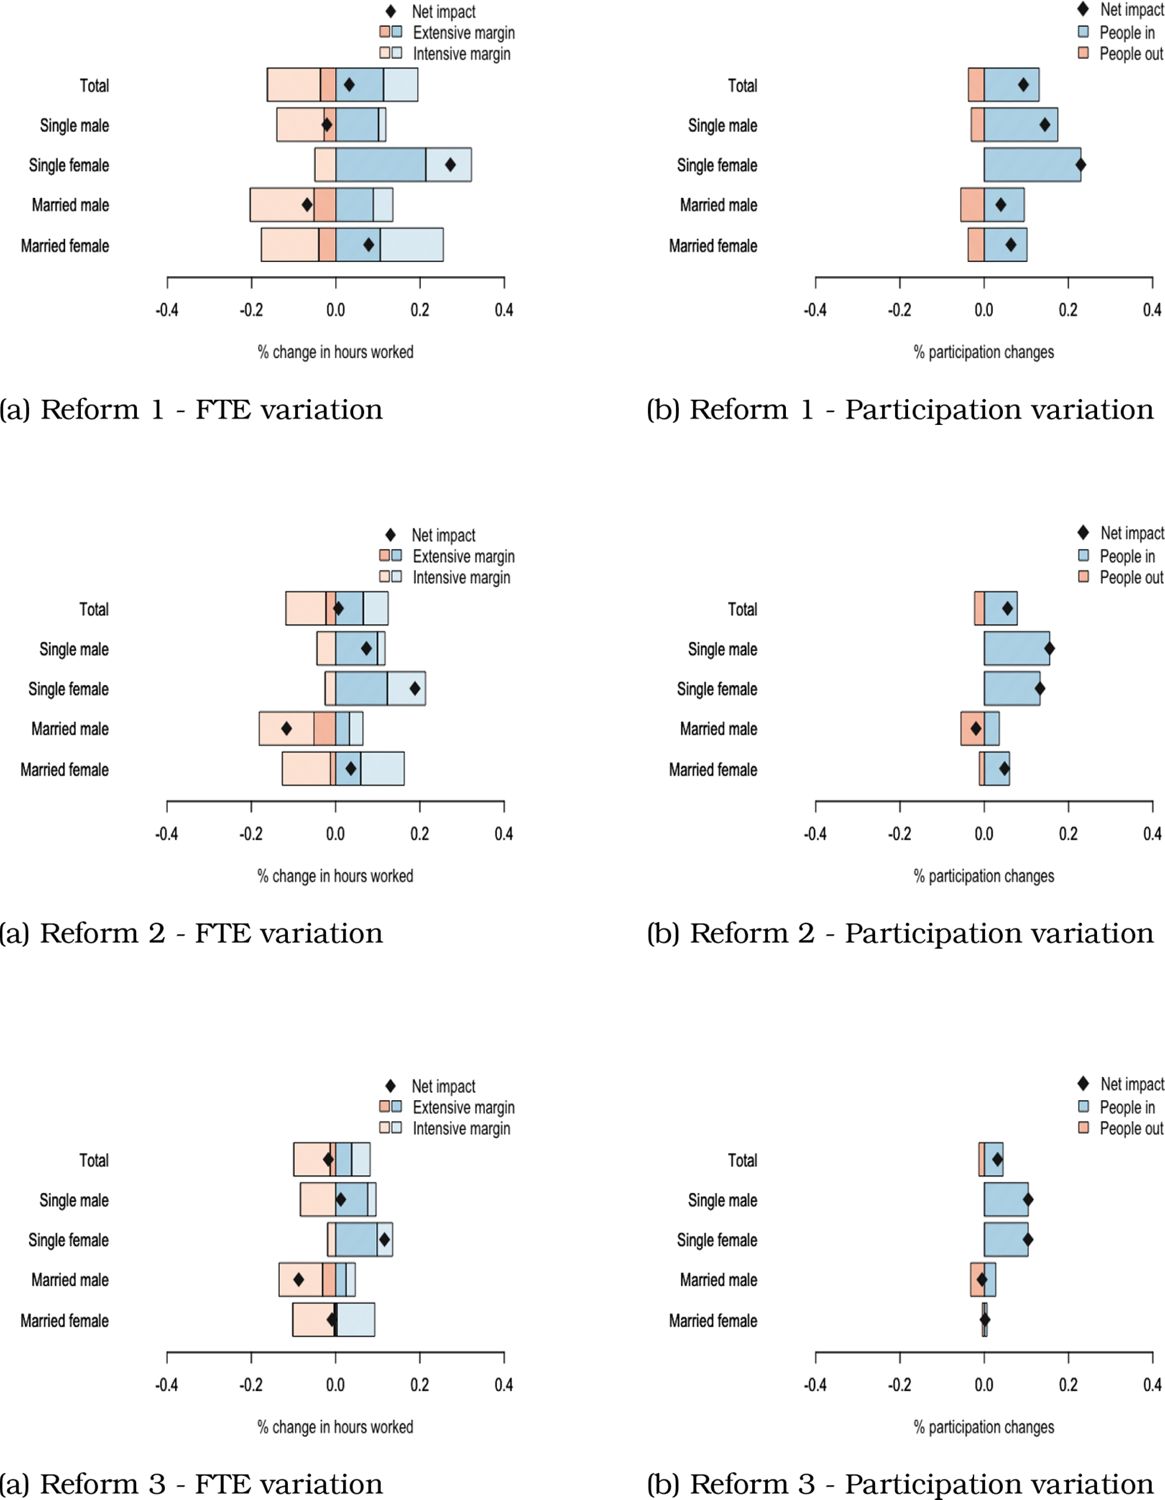
Decomposition of labour supply changes
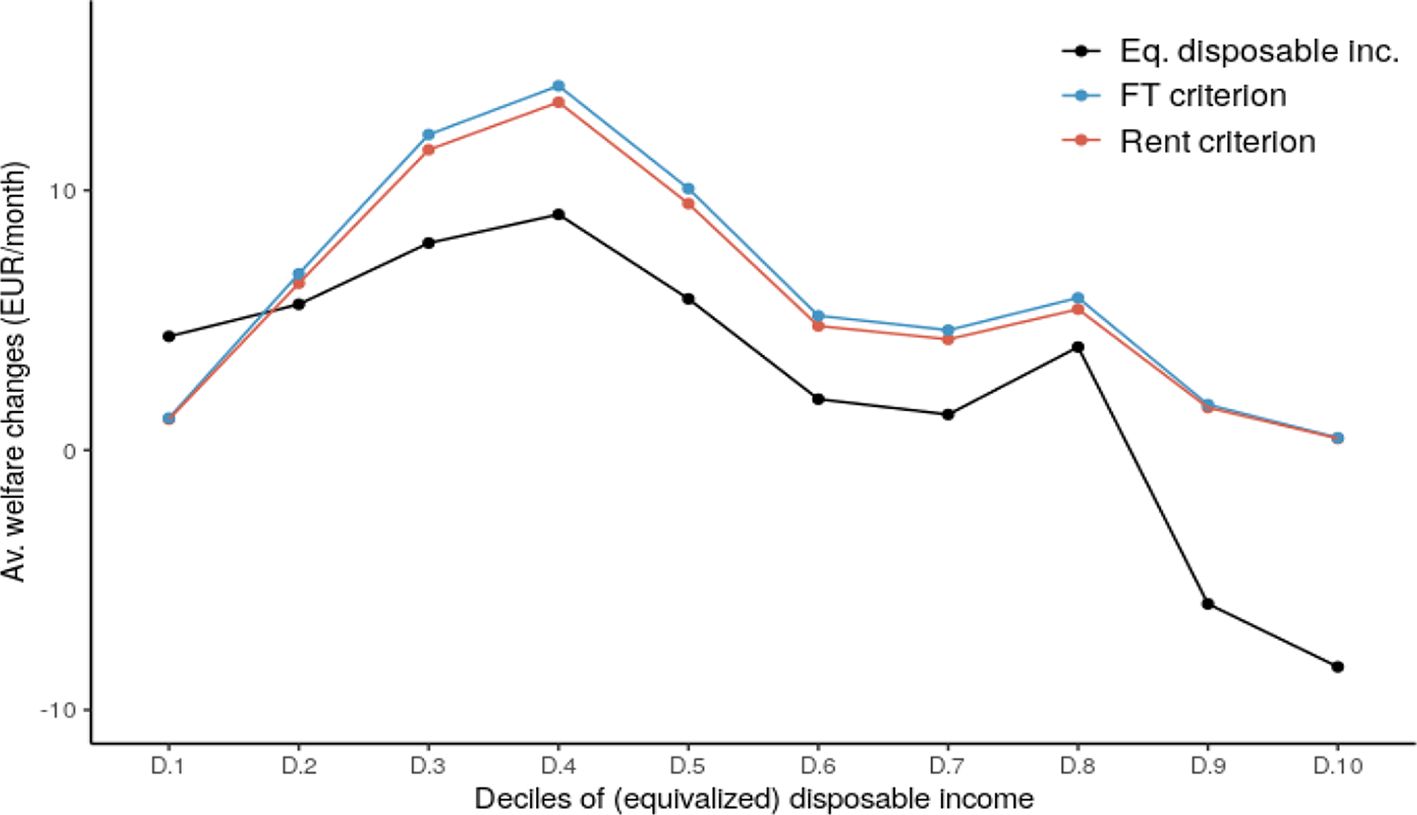
Figure 11
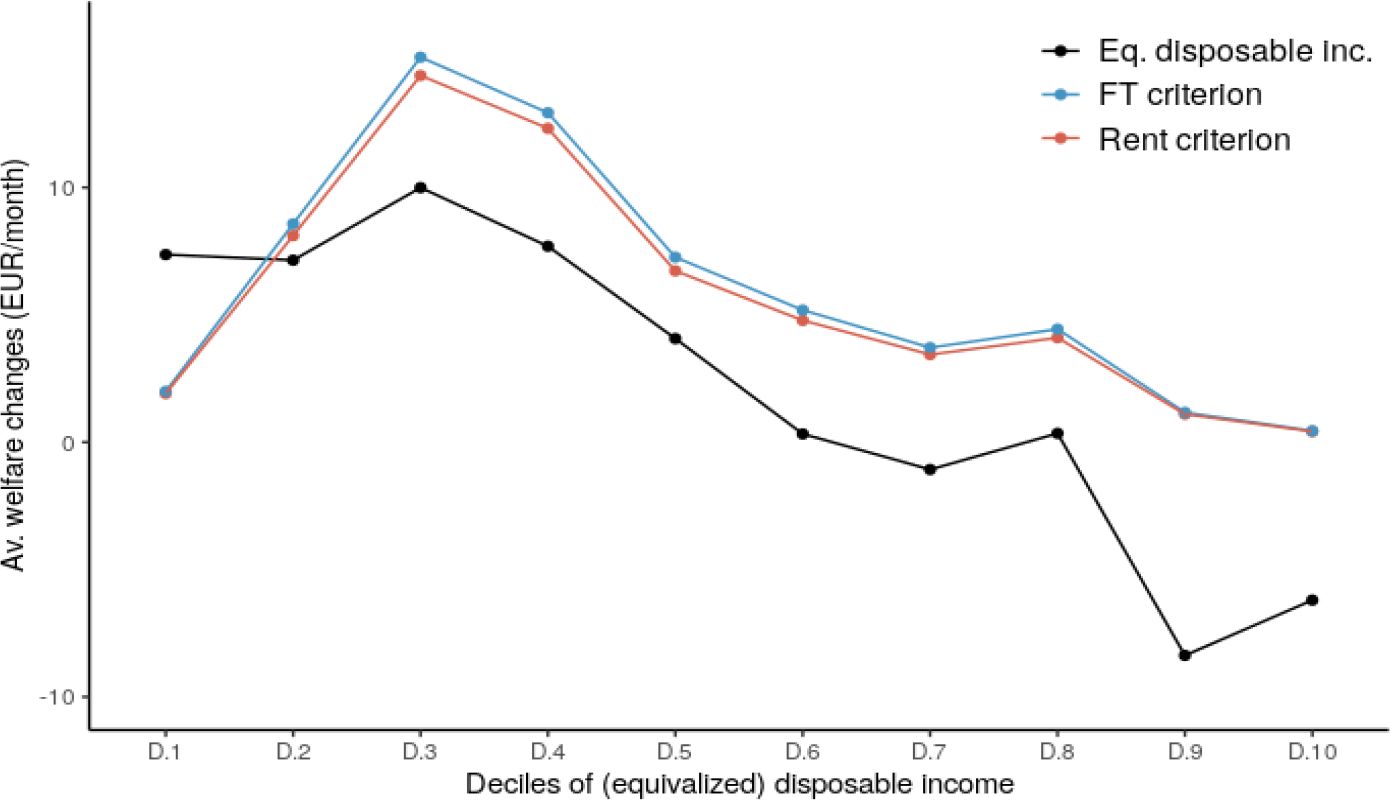

Welfare changes following reform 1
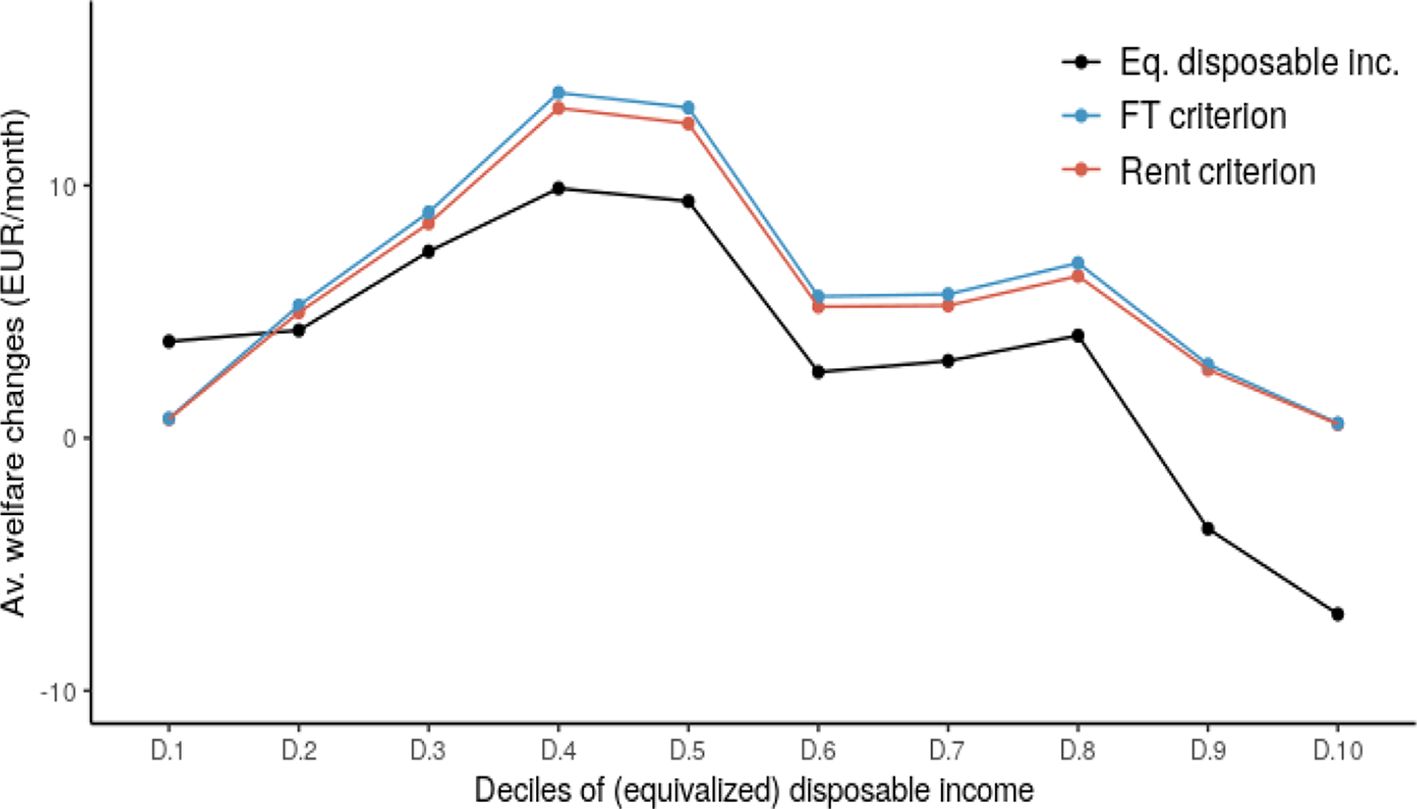
Figure A1

Welfare changes following reform 2
Figure A2

Welfare changes following reform 3
Figure A3
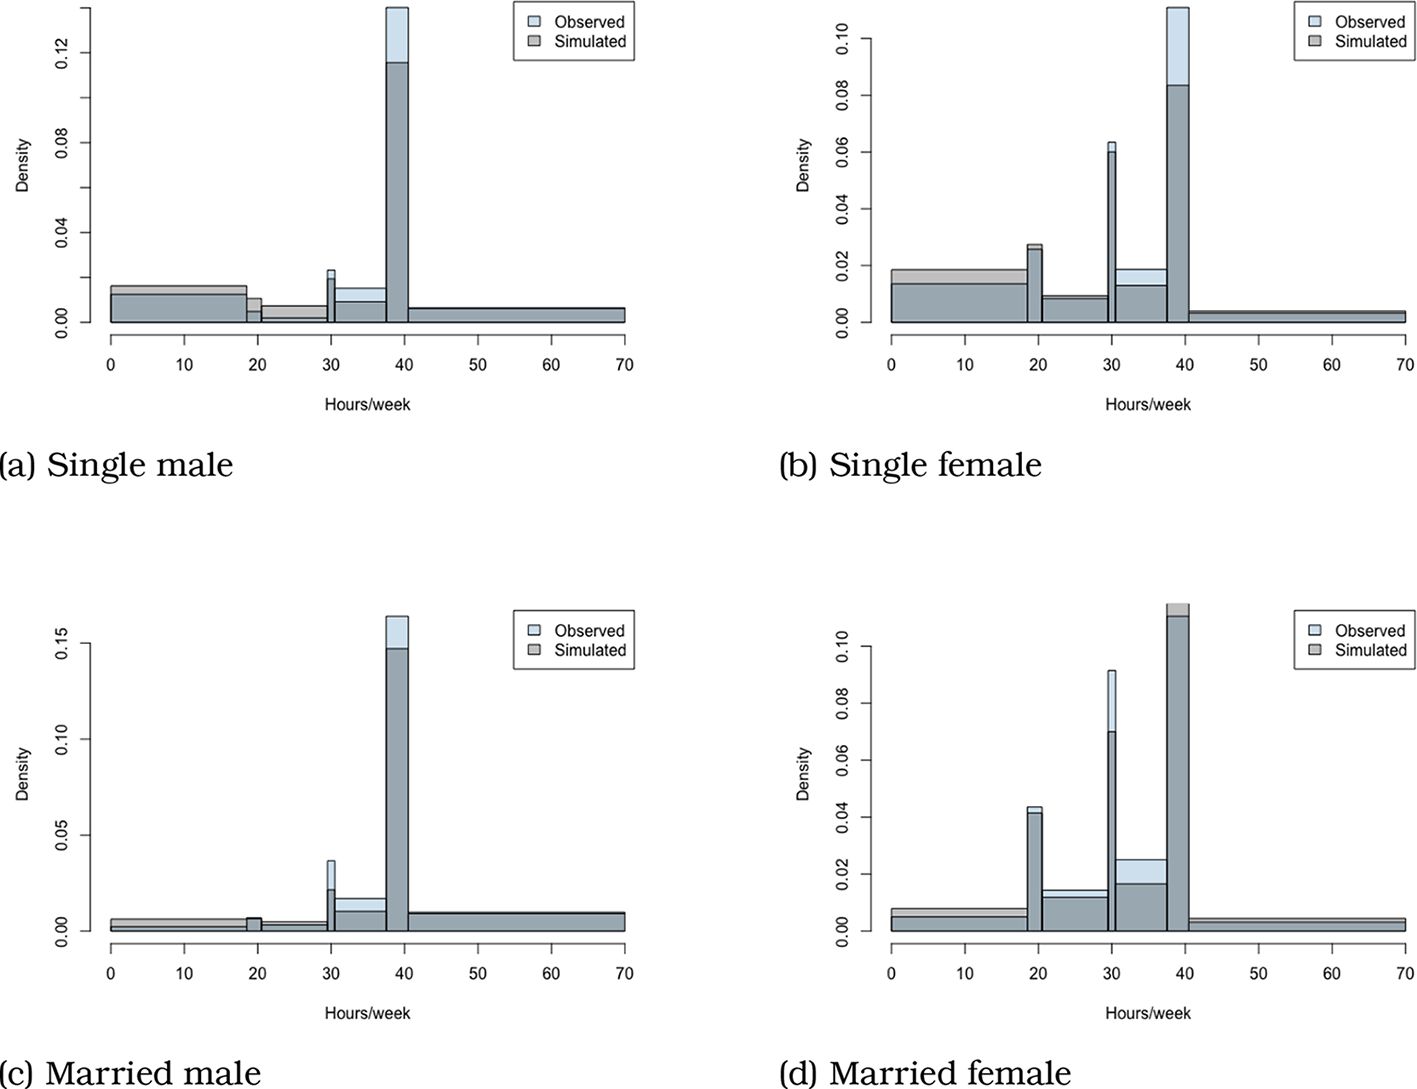

Simulated and observed hours distributions
Figure A4

Simulated and observed wage distributions
Figure A5

Estimated disposable income distribution
Figure A6
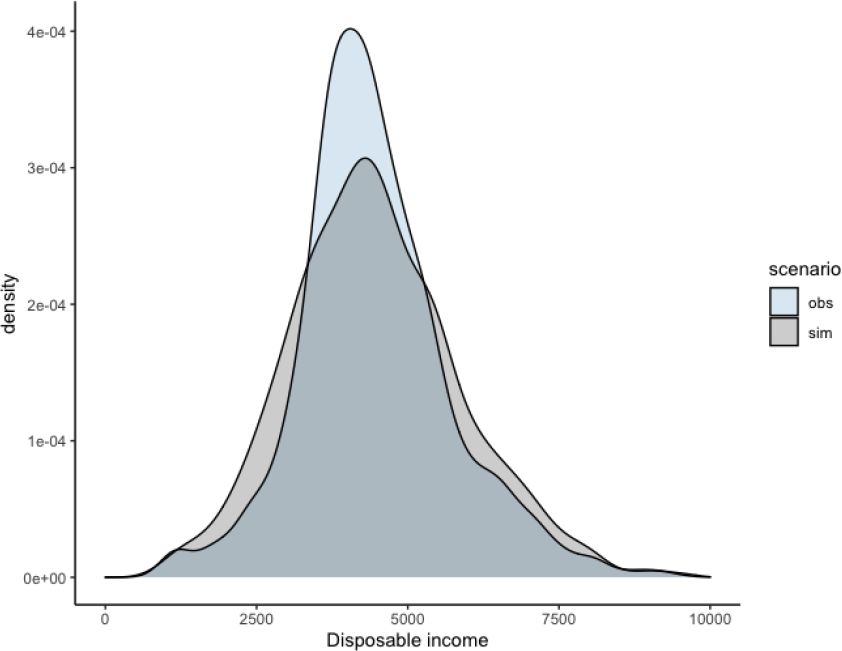

Estimated disposable income distribution
Tables
Table 1
Policy parameters (2016): Work-Bonus and Fiscal Work-Bonus
| Parameter | Unit | Value |
|---|---|---|
| A | EUR/month | 193.79 |
| θ 1 | EUR/month | 1,577.89 |
| θ2 | EUR/month | 2,461.27 |
| ρ 1 | % | 21.94 |
| ρ 2 | % | 28.03 |
Table 2
Descriptive statistics - households included in the estimation sample
| Single | Couple | |||
|---|---|---|---|---|
| Male | Female | Male | Female | |
| Number of observations | 4057 | 4585 | 8344 | |
| Av. working time - Workers (h/week) | 39.6 | 34.9 | 40.7 | 32.9 |
| Average hourly gross wage (EUR/h) | 20.3 | 19.9 | 22.2 | 19.7 |
| Participation (%) | 77.3 | 74.7 | 96.1 | 92.6 |
| Highest level of education (%) - Workers | ||||
| - Primary or no education | 6.1 | 5.2 | 4.4 | 3.8 |
| - Lower secondary education | 13.3 | 10.7 | 11.0 | 8.0 |
| - Upper secondary education | 37.2 | 31.4 | 36.0 | 30.2 |
| - High education | 43.5 | 52.8 | 48.6 | 57.9 |
| Highest level of education (%) - Non-workers | ||||
| - Primary or no education | 24.1 | 25.3 | 22.5 | 14.8 |
| - Lower secondary education | 28.4 | 23.1 | 22.2 | 24.7 |
| - Upper secondary education | 27.8 | 33.2 | 36.4 | 35.6 |
| - High education | 19.7 | 18.5 | 18.8 | 25.0 |
| Household composition | ||||
| Average household size | 1.4 | 1.8 | 3.3 | |
| - of which children | 0.1 | 0.6 | 1.3 | |
Table 3
Descriptive statistics - overtime workers in sub-sample
| Work regime | Comparison | ||
|---|---|---|---|
| All | Overtime | ||
| (>0h/w) | (>40h/w) | ||
| Average age | 40.4 | 40.4 | +0 |
| Average working time (h/week) | 37.1 | 49.5 | +12.4 |
| Average years of education | 13.3 | 14.4 | +1.1 |
| Average gross hourly wage (EUR 2016) | 20.7 | 21.5 | +0.8 |
| Average gross earnings (EUR 2016) | 3310.5 | 4569.7 | +1259.2 |
| Percentage of males | 51.9 | 72.6 | +20.7 |
| Type of ISCO occupation (%) | |||
| - 0: Armed forces | 0.7 | 0.5 | -0.2 |
| - 1: Senior officials and managers | 6.5 | 18.2 | +11.7 |
| - 2: Professionals | 23.5 | 32.2 | +8.7 |
| - 3: Technicians | 16.0 | 15.0 | -1.0 |
| - 4: Clerical support workers | 19.3 | 11.9 | -7.4 |
| - 5: Services and sales workers | 9.9 | 6.7 | -3.2 |
| - 6: Skilled agricultural | 0.4 | 0.3 | -0.1 |
| - 7: Craft and trade workers | 8.5 | 6.4 | -2.1 |
| - 8: Plant and machine operators | 6.0 | 5.9 | -0.1 |
| - 9: Elementary occupations | 9.2 | 2.8 | -6.4 |
Table 4
Model specification - covariates
| Preferences | Opportunities | |||
|---|---|---|---|---|
| intensity job offers | hours | wages | ||
| <disp-formula> </disp-formula> | <disp-formula> </disp-formula> | <disp-formula> </disp-formula> | <disp-formula> </disp-formula> | |
| Regional dummies | yes | yes | no | no |
| Education dummies | yes | yes | no | yes |
| Age | yes | no | no | no |
| Group-specific unemp. | no | yes | no | no |
| Number of children | yes | no | no | no |
| Gender | yes | yes | yes | yes |
| Experience | no | no | no | yes |
| Year | no | yes* | no | yes |
-
*
Included implicitly as group-specific unemployment rates are year-specific.
Table 5
Marginal utilities
| % Observations | Single Male | Single Female | Couples |
|---|---|---|---|
| <disp-formula> </disp-formula> | 100 | 100 | 100 |
| <disp-formula> </disp-formula> | 100 | 100 | Male: 99.89Female: 99.86 |
Table 6
Elasticities and participation changes (10 wage increase)
| Increase of male wages | Increase of female wages | |||||
|---|---|---|---|---|---|---|
| Single | Couple | Single | Couple | |||
| Male | Male | Female | Female | Male | Female | |
| Total elasticity | 0.270 | 0.117 | -0.072 | 0.210 | -0.067 | 0.163 |
| Intensive margin | 0.049 | 0.068 | -0.090 | 0.042 | -0.087 | 0.106 |
| Participation (entering, % of total) | 1.791 | 0.506 | 0.193 | 1.388 | 0.214 | 0.548 |
| Participation (leaving, % of total) | 0.025 | 0.000 | 0.531 | 0.000 | 0.535 | 0.000 |
Table 7
Effects of the reforms on labour supply
| Overview LS effects | Param. | Base | Ref1 | Ref2 | Ref3 |
|---|---|---|---|---|---|
| <disp-formula> </disp-formula> | 193.79 | 257.81 | 222.05 | 193.79 | |
| <disp-formula> </disp-formula> | 1577.89 | 1577.89 | 1577.89 | 1577.89 | |
| <disp-formula> </disp-formula> | 2461.27 | 2461.27 | 2590.07 | 2721.83 | |
| <disp-formula> </disp-formula> | 21.94 | 29.18 | 21.94 | 16.94 | |
| <disp-formula> </disp-formula> | 28.03 | 28.03 | 28.03 | 28.03 | |
| ΔLabour supply (FTE) | +669 (+0.032%) | +141 (+0.007%) | -362 (-0.017%) | ||
| - Ext. margin (FTE) | +1609 | +895 | +530 | ||
| - Int. margin (FTE) | -939 | -754 | -892 | ||
| ΔParticipation | +2024 (+0.093%) | +1200 (+0.055%) | +688 (+0.032%) | ||
| - people starting to work | 2831 | 1697 | 964 | ||
| - people stopping to work | 807 | 497 | 276 | ||
| ΔTotal gross labour income (M EUR) | -190.2 (-0.217%) | -166.3 (-0.190%) | -105.3 (-0.120%) | ||
| - average gross wage change (EUR/h) | -0.053 | -0.041 | -0.022 |
Table 8
Effects of the reforms on poverty and inequality
| Poverty and Inequality | Base | Ref1 | Ref2 | Ref3 |
|---|---|---|---|---|
| Gini | 21.25 | 21.18 | 21.19 | 21.20 |
| Poverty rate | 10.37 | 10.20 | 10.22 | 10.26 |
Table 9
Effects of the reforms on budget balance (Million EUR)
| Budget Balance | Ref1 | Ref2 | Ref3 |
|---|---|---|---|
| +Δ Social Security contrib. (static) | -83.4 | -82.4 | -82.9 |
| +Δ Personal Income Tax (static) | -234.9 | -233.2 | -232.1 |
| –Δ Benefits (static) | -16.7 | -15.9 | -15.2 |
| =Δ Budget balance (static)* | -301.5 | -299.7 | -299.7 |
| Additional impact following LS changes | |||
| +Δ Social Security contrib. | -176.1 | -168.8 | -160.4 |
| +Δ Personal Income Tax | +40.9 | +53.0 | +82.3 |
| –Δ Benefits | -23.8 | -17.8 | -12.7 |
| =Δ Budget balance (total)* | -413.0 | -397.7 | -365.2 |
-
*
A negative balance corresponds to a deficit for the government.
Table 10
Net costs to increase labour supply (Thousand EUR)
| Net costs | Ref1 | Ref2 | Ref3 |
|---|---|---|---|
| Cost / additional FTE | 368.5 | 1660.1 | - |
| Cost / additional participant | 121.1 | 195.1 | 560.7 |
Data and code availability
Data is available for scientific research: https://www.euromod.ac.uk/using-euromod/access/data-permissions. The code is proprietary, with the executable available on demand.
Download links
A two-part list of links to download the article, or parts of the article, in various formats.