Estimating the Distributional Impacts of the COVID-19 Pandemic and the Remedial Tax and Benefit Policies in Indonesia
- College of Graduate Studies, University of South Africa, South Africa
- Southern African Social Policy Research Insights, United Kingdom
- Fiscal Policy Agency, Indonesia
- UNICEF Indonesia, Indonesia
- Department of Economics, Indonesia
- Article
- Figures and data
-
Jump to
- Abstract
- 1. Introduction
- 2. COVID-19 Situation in Indonesia and Policy Response
- 3. INDOMOD
- 4. Method
- 5. Results - the March 2020 Baseline
- 6. Results – impact of COVID-19 on earnings
- 7. Results – Combined Impact of COVID-19 Pandemic and the Tax-Benefit Policies
- 8. Conclusion and Discussion
- Footnotes
- Annex 1 Further details about the method for identifying poor families in INDOMOD’s input dataset
- Annex 2 External validation data for pre-crisis period, 2019
- Annex 3 Summary of changes made to Indonesia’s benefit policies in response to the COVID-19 pandemic in 2020
- Annex 4 Sector codes
- Annex 5 Regression results for estimating elasticity of community mobility to economic growth
- Annex 6 March 2020 baseline using disposable income
- Annex 7 Combined impact of COVID-19 and the remedial tax and benefit policies using disposable income
- References
- Article and author information
Abstract
The Government of Indonesia acted quickly to protect people from the financial impact of the COVID-19 pandemic and associated lockdown measures in 2020. Using a static tax and microsimulation model for Indonesia with adjusted datasets to reflect the economic shock throughout 2020, we explore how the pandemic affected people’s earnings in Indonesia, the extent to which the automatic stabilisers that were already built into the tax and benefit system cushioned the economic shock, and how the augmented or new benefit policies served to further cushion the shock. We estimate that in 2020 the additional policies meant that poverty rose from 6.8 percent to a maximum of 8.3 percent rather than to 10.7 percent if they had not been introduced. We discuss reasons why the official poverty estimates for 2020 are higher than those generated in this study.
1. Introduction
During 2020, the COVID-19 pandemic wreaked havoc across the world, causing shockwaves that have impacted on many people’s lives and financial security. In the absence of any known cures or preventative vaccines, governments quickly implemented policies to minimize its impact. In particular, public health policies were rolled out which focused on containing the spread of the virus but these measures in turn had a detrimental impact on many economies, at least in the short-run. In addition, tax and benefit policies were often either augmented or introduced from scratch, in order to mitigate the financial impact of the pandemic and associated containment measures on people’s lives. The speed with which initiatives were introduced has been unprecedented: for example, the United Nations Special Rapporteur on extreme poverty and human rights observed that 1,407 new social protection measures had been adopted by 208 countries and territories by September 2020 (United Nations, 2020).
In this paper we explore how the COVID-19 pandemic has impacted on people’s earnings in Indonesia, the extent to which the automatic stabilisers that were already built into the tax and benefit system cushioned the economic shock, and how the augmented or new tax and benefit policies that were introduced because of the pandemic served to further cushion the shock.
We provide a distributional analysis on household circumstances throughout 2020, by combining the tax-benefit microsimulation model INDOMODwith a novel approach to estimate the COVID-related shock on the labour market (Barnes et al., 2019). This allows us to analyse income changes for each calendar month of 2020 by taking into account the combined effect of changes in earnings and the effect of existing and newly introduced COVID-related tax-benefit policies as well as their changing rules over the year.
Similar work has been or is still being undertaken using the EUROMOD microsimulation software for other countries such as Ecuador (Jara et al., 2021); Ireland (Beirne et al., 2020); Italy (Figari and Fiorio, 2020); the United Kingdom (Brewer and Tasseva, 2020; Bronka et al., 2020); six countries across Africa – Ghana, Mozambique, South Africa, Tanzania, Uganda and Zambia (Lastunen et al., 2021, forthcoming); and Vietnam (forthcoming). This paper is inspired methodologically by these earlier studies but is unique in its focus on monthly changes in household incomes as a result of policy changes.
The contribution of this paper is fivefold. First, we provide a methodology for nowcasting quarterly income shocks using a technique that draws from anonymized phone data on people’s mobility patterns to estimate the COVID-related shock on economic activity (Carlitz and Makhura, 2020; Sampi and Jooste, 2020; Yusuf et al., 2020). Second, the analysis is based on very timely data derived from the National Socio-Economic Survey Indonesia (SUSENAS) 2019 (Badan Pusat Statistik (BPS), 2019), including individual level income data from the survey which is not usually available for external research purposes. This provides an opportunity for an in-depth analysis of income changes along the distribution and for different population sub-groups. Third and most importantly, the paper focuses on the role of the tax-benefit system in cushioning the consequences of the pandemic. Fourth, this is possible due to the state-of-the-art microsimulation model INDOMOD which allows us to monitor the impact of policies in a timely manner and to decompose the role of existing tax-benefit policies versus the effectiveness of emergency policies. Fifth, modelling the different tax and benefit policies that were in place for each month in the calendar year of 2020, it is possible to unpick in a very detailed way the role that the tax and benefit system has played in mitigating the impact of the pandemic on poverty and inequality. This shows the extent to which the social policy response during the year was successful and also provides pointers for further support to avoid more severe long-term effects on incomes after the pandemic.
The analysis presented in this paper shows that consumption fell across the deciles in quarters 2, 3 and 4 when compared with quarter 1 of 2020. Nevertheless, the policies that were introduced protected millions of people from a greater financial shock than would otherwise have been the case. For example, for households containing one or more children, poverty would have risen to a high of 11.99 percent in May 2020 without the COVID-19 policies, but instead rose to 9.49 percent, and for households containing one or more elderly people, poverty would have risen to a high of 14.25 percent without the COVID-19 policies, but instead rose to 11.40 percent.
In terms of the structure of the rest of this paper, Section 2 provides an overview of the COVID-19 situation in Indonesia and the policy response to the pandemic. Section 3 introduces the INDOMOD microsimulation model and sets out the tax and benefit policies that are simulated in the model, as well as providing baseline validation statistics for 2019. Section 4 describes the methodological approach used for modelling the new COVID policies in each month of 2020, explains how INDOMOD’s dataset was adjusted to take into account the shocks at different timepoints in the year, and discusses key concepts and assumptions. Our analysis is presented in three sections: first, the impact of the shock with no additional tax and benefits (Section 5); second, the impact of the shock on earnings (Section 6), and third, the combined impact of the shock and the new taxes and benefits (Section 7). This is followed in Section 8 by a discussion about the findings and their implications.
2. COVID-19 Situation in Indonesia and Policy Response
COVID-19 cases were first reported in Indonesia in March 2020and as of 8th January 2021 there had been 797,723 confirmed cases of COVID-19 and 23,520 deaths (Suryahadi et al., 2020; World Health Organisation, 2021).
Social distancing to contain the spread of the virus was introduced in Indonesia in March 2020. Using Google mobility data, Yusuf et al. (2020) found that average mobility in Indonesia had fallen by 40 percent by the end of March 2020 compared to the first two weeks of that month; by treating mobility reduction as a proxy for the shock to the economy that is associated with rising levels of poverty and inequality, they conducted analysis for the period mid-February 2020 to mid-July 2020 and demonstrated that poor people had been disproportionately affected by the pandemic.
Others have also signalled their concern about the impact of the pandemic on poverty in Indonesia. For example, Suryahadi et al. (2020) estimated that between 1.3 and 19.7 million people could fall below the poverty line based on their estimated best and worst-case scenarios of the economic impact of the pandemic by the end of 2020. Aulia et al. (2020) conducted in-house simulations at the National Development Planning Agency (BAPPENAS) and estimated that at least 3.6 million additional people would become poor. Most recently a study by UNICEF, PROSPERA, UNDP and SMERU (2021) found that households across all income groups experienced a similar percentage fall in income, with almost a quarter of households also reporting a rise in outgoings on essentials. Furthermore, they found that half of all households had no savings, and that over a quarter of households had reported having to pawn possessions to help cover their costs. The results presented in this paper complement the earlier studies by providing detailed analysis that takes into account changes made to the policies on a month-by-month basis.
Concerns about rising levels of poverty and especially child poverty are of course not unique to Indonesia (e.g. Sumner et al., 2020; Global Coalition to End Child Poverty, 2020), but Indonesia’s size, both in terms of geographical extent and in terms of its population, make it particularly imperative to ensure that the impact of the pandemic can be monitored and mitigated.
Indonesia has a sophisticated tax and benefit system which was well established prior to the pandemic and so the country was able immediately to build on these frameworks (e.g. IPC-IG and UNICEF, 2019; Jellema et al., 2017; TNP2K, 2018; World Bank, 2017). Although Indonesia’s social spending prior to the pandemic was regarded as low compared to other middle-income countries, it nevertheless did make an important dent on inequality (Kim et al., 2020). For example, the main social protection arrangements in 2016 have been shown to have reduced inequality by 3.7 percent overall, and by 5.7 percent in rural areas and to be poverty-reducing (Yusuf, 2018). Jellema et al. (2017) found that Indonesia’s fiscal policy reduces poverty and inequality very slightly overall (though they excluded personal income tax from the analysis).
The Government of Indonesia introduced a range of measures throughout 2020 to mitigate the impact of the pandemic, including health and social protection policies, and support for Micro, Small and Medium Enterprises (MSMEs), businesses, and local government. Many of the new policies relating to social protection were incorporated into INDOMOD; they are described in Section 4.
3. INDOMOD
INDOMOD is a static tax-benefit microsimulation model for Indonesia which has been developed by SASPRI for use by Government in collaboration with UNICEF Indonesia (Barnes et al., 2019). It is run using the EUROMOD microsimulation software EM Version 3.1.8 (Sutherland and Figari, 2013; University of Essex, 2019). The version of the model that is used in this paper is INDOMOD V2.1 which is underpinned by a dataset that was derived from the nationally representative National Socio-Economic Survey/ Survei Sosial Ekonomi Nasional (SUSENAS) for March 2019 (Badan Pusat Statistik (BPS), 2019), as well as modifications of that dataset which are described in Section 4.
The 2019 SUSENAS survey contains detailed information, including data on income and expenditure, from over 315,000 households and more than 1.2 million individuals. The final post-cleaning response rate was very high at 98.65 percent. The survey captures detailed information about households and individuals, the most relevant of which for INDOMOD comprise information on demographics, education, labour force participation, functional impediments, health insurance, social protection, household expenditure (food and non-food), income from wage/salary, business income, property income, non-consumption income and expenditure, and financial transactions. The SUSENAS 2019 data was found to be of very good quality in terms of levels of completion, consistency and plausibility.
The SUSENAS data was transformed into a dataset in the correct format for INDOMOD (the ‘input dataset’ in EUROMOD terminology, as distinct from the model’s ‘output dataset’ which additionally contains simulated variables). Each of the variables in INDOMOD’s input dataset was constructed and named to accord with the requirements of the EUROMOD software. See Barnes et al., 2021 for a detailed discussion of the construction of the input dataset and internal validation checks carried out as part of the data preparation.
The main tax and benefit policies that are modelled in INDOMOD for the 2019 policy year comprise four benefits, six policies relating to social insurance contributions and two central taxes. 1 These policies are summarised in Table 1 and elaborated in more detail in Barnes et al., 2021.
Tax and benefit policies modelled in INDOMOD for the 2019 policy year
| Policy | Description | Notes on simulation in INDOMOD |
|---|---|---|
| Benefits | ||
| Electronic Food Voucher/Basic Food Card, Bantuan Pangan Non Tunai, BPNT/Kartu Sembako | Electronic voucher for the poorest 15.6 million families in Indonesia forpurchasing basic foodstuffs | |
| Family Hope Program, Program Keluarga Harapan, PKH | Conditional cash transfer paid to the poorest 9.2 million families in Indonesia | Area level top-up for Eastern Indonesia (PKH Access) is not simulated |
| Smart Indonesia Program, Program Indonesia Pintar, PIP | Cash transfer paid to school age children from the poorest 25 percent of families in Indonesia | |
| Child Social Welfare Program, Program Kesejahteraan Sosial Anak, PKSA | Combines cash transfers with assistance from social workers and access to basic social services for children with a range of social problems | Only certain groups of children are simulated due to data constraints: those with disabilities and those who cannot be assigned a suitable caregiver |
| Social security contributions | ||
| Pension scheme, Jaminan Pensiun, JP | Mandatory scheme for all wage-recipient workers, apart from government, with both employer and employee (for JP and JHT) contributions. Employer contributions are also made for government workers to JKK and JKM. Voluntary contributions for non-wage-recipient workers. | Contributions are simulated for both government and non-government wage recipient workers. Contributions for non-wage recipient workers are not simulated as the contributions are voluntary and few actually contribute. |
| Casualty or work injury compensation scheme, Jaminan Kecelakaan Kerja, JKK | ||
| Survivors’ benefit scheme, Jaminan Kematian, JKM | ||
| Old age savings with disability benefit, Jaminan Hari Tua, JHT | ||
| Social insurance for government workers, PT Asabri and PT Taspen, part of Iuran Wajib Pegawai, IWP | Mandatory scheme for military, police, Ministry of Defence and civil servants (all other government employees and employees of state-owned enterprises) | |
| National Health Insurance, Jaminan Kesehatan Nasional, JKN, and Jaminan Kesehatan Nasional - Penerima Bantuan Iuran, JKN-PBI | Mandatory scheme with employer and employee contributions. Government makes contributions on behalf of the poorest 40 percent of families in the form of JKN-PBI. | Contributions for non-wage recipient workers and non-workers are not simulated in INDOMOD as the contributions are optional. Government contributions for veterans and pioneers of independence are not simulated. |
| Taxes | ||
| Personal income tax – labour income, Pajak Penghasilan Pribadi, PPP [Personal income tax for non-labour income is not simulated in INDOMOD as this would require more detailed income data] | There are four tax bands, and the amount of tax payable takes into account the presence of a spouse and the number of dependants (up to a maximum of three) | Income from employment is captured at the individual level in SUSENAS and then summed within a household. Due to data constraints, pension expenditure could not be deducted in the calculation of personal income tax. Income from lump sums is not taken into account. |
| Value-Added Tax on supply of goods and services, Pajak Pertambahan Nilai, PPN | The standard rate of VAT is 10%. The rate of VAT on cigarettes is 9.1% and the rate of VAT on pilgrimage/Hajj costs is 1%, and certain goods and services are VAT-exempt. | Of 258 purchasable items in SUSENAS, 109 are standard-rated (the rest are zero-rated or VAT-exempt). Cigarettes and pilgrimage/Hajj costs have VAT applied separately. SUSENAS records the amount paid for an item so VAT has to be deducted before expenditure data can be brought into the model and VAT simulated. |
With regard to the benefits, SUSENAS does not contain sufficient intra-household relationship data to enable families within a household to be identified and so, as an approximation, households were used rather than families in INDOMOD. A proxy means test is used to rank families in terms of predicted expenditure within the Unified Database (Basis Data Terpadu, BDT), but SUSENAS does not record whether a family is listed in this database.2 Therefore, as an approximation of this step, the SUSENAS derived variable kapita (average monthly expenditure per capita) was used to identify the poorest households. See Annex 1 for further details about how low income families were identified in SUSENAS. Conditionalities are not simulated in INDOMOD and so it is assumed that eligible beneficiaries are compliant.
Before assessing the situation in 2020, it is important to understand how closely INDOMOD simulates the taxes and benefits when compared with external validation data. Annex 2 provides results for 2019. INDOMOD simulates 16.5 million tax payers, compared to 12.6 million recorded tax payers (Table B1); with IDR 114.6T of PPP tax, compared to IDR 148.9T of recorded PPP tax receipt for labour income (Table B2). INDOMOD simulates 39 percent of recorded domestic VAT in 2019. Simulated expenditure on the main benefits is as follows: INDOMOD simulates 114 percent of reported expenditure on PKH; 96 percent of reported expenditure on PIP; and 73 percent of reported expenditure on BPNT.3
Differences between the simulated results and macro-validation can be for a number of reasons. Regarding tax and benefit payment and receipt, INDOMOD applies the ‘de jure’ position, whereby everyone in the underpinning dataset who is identified in the model as being eligible for benefits receives them, and there is full compliance in the payment of taxes and social insurance contributions. For this reason alone, the poverty rates generated using the simulated results in the following analysis will differ from those published by BPS for 2020 – the differences are summarised and discussed in the final section.
Any comparison to reported results from administrative sources needs to take into account the possibility of inclusion errors (recipients on the system who are ineligible) or exclusion errors (eligible individuals who are not registered on the system).
In addition, the accuracy of the simulations depends on the accuracy of the underpinning dataset, in terms of the extent to which it is nationally representative, the accuracy of the demographic and income and expenditure data, and the precision with which the tax or benefit policies could be modelled. Assumptions made when constructing the variables in the input dataset are described in Barnes et al., 2021, along with assumptions relating to the implementation of the 2019 policy rules, many of which are relevant to the analysis presented in this paper.
4. Method
The methodology used for the analysis undertaken in this paper has three main components: first, the policies introduced in response to the pandemic were incorporated into INDOMOD; second, the shock to household incomes as a result of the pandemic had to be estimated; and third, the input dataset underpinning INDOMOD had to be modified to reflect the shock. These steps are described in the following sub-sections, and the key underlying assumptions of the approach are discussed.
4.1. Modelling the tax and benefit policies for 2020
In INDOMOD and other models that use the EUROMOD software, it is customary for the tax-benefit rules for a particular policy year to be modelled in a single ‘system’ (in EUROMOD terminology). For INDOMOD the usual timepoint is March of each year, to match the timepoint of the underpinning dataset. The modelling of the tax-benefit rules reflects the policies in place at that timepoint. For the analysis presented in this paper, a different approach was taken. Given the number of policy changes that occurred in 2020 in Indonesia, a new system (that is, the set of tax and benefit rules) was created for each of the months of 2020 to aid transparency. Monetary values were adjusted month on month using the Consumer Price Index (CPI). The policy changes that were incorporated into INDOMOD are summarized below, and in Annex 3 Table C1.4
The target number of families for PKH was raised from 9.2 million families (January – March) to 10 million families (April – December)
The target number of families for BPNT was raised from 15.6 million families (January – March) to 19.4 million families (April – December), and the value of the benefit was increased from IDR 150,000 per month (January – March) to 200,000 per month (April – December)
A new benefit was introduced called Basic food assistance for Jabodetabek for 2.2 million families, payable at IDR 600,000 per month (April – June) and IDR 300,000 per month (July – December). This is payable to families who are not in receipt of BPNT or PKH.
A new benefit was introduced called Cash transfer non-Jabodetabek for 9.2 million families in non-Jabodetabek areas, payable at IDR 600,000 per month (April – June) and IDR 300,000 per month (July – December). This is payable to families who are not in receipt of BPNT or PKH.
A new benefit was introduced called Village Fund cash transfer for 8 million families in non-Jabodetabek rural areas, payable at IDR 600,000 per month (April – June) and IDR 300,000 per month (July – December). This is payable to families who are not in receipt of BPNT or PKH.
A cash support expansion was introduced for 9 million families (in receipt of BPNT but not PKH), payable as a once off payment of IDR 500,000 per household.
A wage subsidy was introduced for 12.4 million individuals registered in BPJS Ketenagakerjaan with employment income of less than IDR 5 million per month, comprising two payments of IDR 1.2 million covering a four month period (between August – December).5
Pre-employment cards were introduced for 5.6 million unemployed individuals who are not in receipt of any social assistance, payable at IDR 600,000 per month for four months (across April – December) plus an incentive payment of IDR 150,000.
Certain policies were not modelled in INDOMOD because the necessary information is not available in SUSENAS.6 The exclusion of these policies means that certain income into the household is not captured and therefore the impact of the COVID response will be underestimated.
The policies introduced in response to the pandemic (including expansion to existing policies) which could be included in INDOMOD are all classified as benefits, and therefore analysis on the impact of the new policies is largely focused on the role of benefits. However, taxes are also impacted by the shock and this is reflected in the analysis of household consumption.
4.2. Modelling the shock
To apply income ‘shocks’ to each household in INDOMOD’s input dataset, quarterly data on the sector and province specific economic growth (increase in value added of specific sector and province) was used as a proxy for income growth of the household whose head works in that sector and lives in that particular region (Badan Pusat Statistik (BPS), 2020b). Although the data on economic growth for quarter 1 to quarter 3 was already available at the point when the analysis was undertaken, it had not been released for quarter 4 and so it was necessary for quarter 4 to model separately an estimated income shock.
Following, for example, Sampi and Jooste (2020), Google mobility data was used as the leading variable to help project future economic growth of various sectors and provinces (Google, 2020). More formally, future sector-province specific economic growth was projected with the following formula:
Where is economic growth of sector i in region r at t+k period, is the baseline economic growth before COVID-19 pandemic, is the community mobility deviation from before the COVID-19 pandemic and is the elasticity of the growth difference i.e., with respect to community mobility deviation in province r, or .
Elasticity was estimated econometrically with the following equation:
Where is the growth difference i.e., , is the deviation of community mobility and is the error terms. To estimate this relationship, economic growth data of ten economic sectors (see Annex 4) and 34 provinces was used. Observations from two quarters were used. The results of the estimation can be found in Annex 5 (1) . Three different kinds of mobilities (workplace, retail and transit) were used and the type of mobility that gave the correct sign with the smallest p-values was selected.7
4.3. Modifying the input dataset
As set out in Section 3, INDOMOD is currently underpinned by a dataset that was derived from the March 2019 SUSENAS dataset. As an underpinning dataset for the first quarter of March 2020, it can be expected to function quite well by simply adjusting the income data using the CPI within the model. However, given the large impact of the pandemic and the measures to contain it, it is not appropriate to use this input dataset for subsequent months without first incorporating the ‘shock’ into the dataset. This enables the tax and benefit policies for each month to be applied to more appropriate input datasets that contain in-built estimates of the shock.
The macro-modelling of the shock is described in the previous sub-section. These macro-level estimates were then used to modify some of the key input variables in INDOMOD’s microdataset, following the methodology applied in Lastunen et al., 2021, (forthcoming). The objective is to reduce the total income derived from employment, self-employment (and farm income, for those employed in the agricultural industry), that is earned by workers in each industry by province, by a given proportion depending on the shock estimate for that industry and province. For example, it is assumed that a five percent shock in construction in a particular province would result in the labour income in construction in that province being reduced by five percent.8
This is primarily achieved by randomly removing labour income from workers (of all ages) in construction in that province, regardless of their pre-crisis income, until the cumulative total of income ‘removed’ (i.e. ‘shocked’) matches the aggregate shock estimate for that industry and province. Most of the adjustment is therefore made at the extensive margin. However, when calculating cumulative income totals across weighted survey cases in this way, it is inevitable that the cumulative total will fall either just below or just above the target threshold of the aggregate shock estimate, depending on how many cases are included in the shock (as one weighted survey case in the cumulative distribution will inevitably straddle the threshold value). Therefore, in order to achieve a total income shock from the survey that matched exactly with the aggregate income shock, a further adjustment was made at the intensive margin whereby a uniform scaling adjustment was applied to all remaining workers.
These steps were undertaken for each of quarters 2, 3 and 4 in 2020 to produce three further input datasets. Individuals whose labour income was reduced to zero had their earnings variables correspondingly set to zero, and their employment status variable changed to ‘unemployed’. This was applied to individuals based on their industry and province. For each of quarters 2, 3 and 4, the starting point was the situation in quarter 1 and the relevant shock for the quarter was applied, as described above. Therefore, over the year, for example, an individual in a particular sector might have their earnings reduced to zero (and employment status changed to ‘unemployed’) in quarters 2 and 3, but then return to their quarter 1 situation for quarter 4 if there is a recovery in their particular industry and province. However, these changes are at a cross-sectional level and do not reflect an individual’s transitions in a longitudinal manner.
As poverty is measured in Indonesia using consumption data, the composite consumption variable in the input dataset also had to be adjusted to reflect the shock, and again the approach applied in Lastunen et al., 2021, (forthcoming) was used (see also Lastunen, 2021). First, consumption was allocated to each earner within the household in proportion to their pre-shock earnings, and then for each earner, 25 percent of their consumption was ringfenced as a crude proxy for an undifferentiated mix of consumption achieved via home grown production, use of savings, or the incurring of debt. The remaining consumption was then reduced by a factor derived by multiplying the income shock by the proportion to which earned income had comprised their pre-shock total market income.
In summary, four input datasets were used in the model, one for each quarter of 2020. The dataset for March 2020 or quarter 1 is the INDOMOD dataset constructed from SUSENAS 2019 data, with monetary values uprated to March 2020 on model using the CPI. This the pre-pandemic baseline. The datasets for quarters 2, 3 and 4 are identical to this base dataset, except that the shock has been applied to labour incomes and associated variables, and to the consumption variable.
In order to generate the results, INDOMOD was run 21 times: once for each month in 2020 with the appropriate input dataset; and for quarters 2, 3 and 4 of 2020 the systems were re-run for each month with COVID-19 benefits excluded or ‘switched off’. Results on the impact of the shock of the pandemic and the state-funded tax and benefit policies are presented in the following sections on a quarterly basis, either by averaging the simulated results for the relevant variables for the three months within a quarter, or by using the results for the month at the mid-point of the respective quarter.
4.4. Assumptions
The following assumptions relate specifically to the policy changes and new policies introduced in response to COVID-19:
The cash support expansion is a one-off payment which was simulated in the model in April as a monthly amount.
For the wage subsidy policy, an on-model flag for non-government wage recipient workers was used as a proxy for being registered with BPJS. The wage recipient worker (lwr) variable was not modified in the input datasets, so that even if someone lost all or part of their employment income they could still be identified via the lwr flag. This was important for the wage subsidy policy as it is paid to workers who are furloughed or whose pay is reduced rather than those who lose their jobs, and therefore membership in the social security schemes is assumed to continue.
The wage subsidy policy was applied to individuals with pre-crisis employment income (yem00) of less than IDR 5 million per month and shocked employment income (yem) that is less than pre-crisis employment income (who were also non-government wage recipient workers). This resulted in a significant over-simulation of the benefit and therefore it was necessary to apply a ‘dampening’ procedure on model to bring the simulation in line with the targeted number of recipients.
A les variable was created specifically for INDOMOD v2.1 and is used in the pre-employment cards policy where it is necessary to identify the unemployed. Anyone not recording ‘working’ as an activity in the last week and also without a job or business to return to was classified as unemployed. However, anyone who also met the criteria for one of the categories of student, inactive, sick/disabled or other was not classified as unemployed. This policy also required a ‘dampening’ procedure on model to bring the simulation in line with the targeted number of recipients.
Regarding the modelled shock on earnings, the main assumption as described above is that the income of households is adjusted using the reported or projected economic growth by sector and province. For quarter 4, economic growth is projected using community mobility data from Google. The four datasets do not have a longitudinal element and thus do not take into account an individual’s transitions across the four quarters into and out of employment, nor do they reflect an individual’s transition between the formal and informal sector.
With regard to analysis of the impact of the pandemic and the taxes and benefits on poverty, certain further assumptions were made. The main assumption, which underpins any analysis using consumption to measure poverty impacts, is that a simulated benefit (income into the household) adds to consumption by the amount of the benefit, while a simulated tax reduces consumption by the amount of the tax. Furthermore, all households are assumed to be liquidity constrained, that is they are unable to borrow to smooth consumption in shock scenarios (see Lastunen et al., 2021, forthcoming). Consumption expenditure is therefore dependent on disposable income. However, in practice the relationship between income and expenditure may not be one-to-one for all consumption items, even in households which are liquidity constrained.
Lastly, the economic shock of the pandemic was considered only with respect to labour income (employment, self-employment and agricultural income). However, it may be that inter-household transfers became an important income stream for mitigating the impact of the crisis, so a focus on tax-benefit policies alone may not give a complete picture (Jara et al., 2021).
5. Results - the March 2020 Baseline
In this section, baseline results are presented for March 2020, just at the outset of the pandemic. This provides context for Sections 6 and 7 which compare the four quarters of 2020.
In all sections where poverty results are presented, the poverty measure used is what is commonly referred to as the national poverty line. In fact, the country has a total of 67 poverty lines: 33 urban poverty lines and 33 rural poverty lines for each of the provinces other than Jakarta, and one urban poverty line for Jakarta. These poverty lines are based on consumption, and reflect the variation in prices throughout the country. All 67 lines have been implemented in INDOMOD.
As a starting point, a baseline profile for March 2020 is given in terms of the distributional impact of the benefits that were in place at that time, using simulated results from INDOMOD V2.1. Figure 1 shows the situation in March 2020 with respect to mean monthly household consumption by decile, and the role that the pre-existing benefits were playing before the pandemic took hold. The deciles are created by ranking households according to their per capita household consumption, taking into account household weights. The green bars (mean household consumption by decile including receipt of simulated benefits) show the important role that the benefits had for those in deciles 1-3 in particular, when compared to deciles of household consumption having excluded (i.e. switched off) the simulated benefits (shown in red).
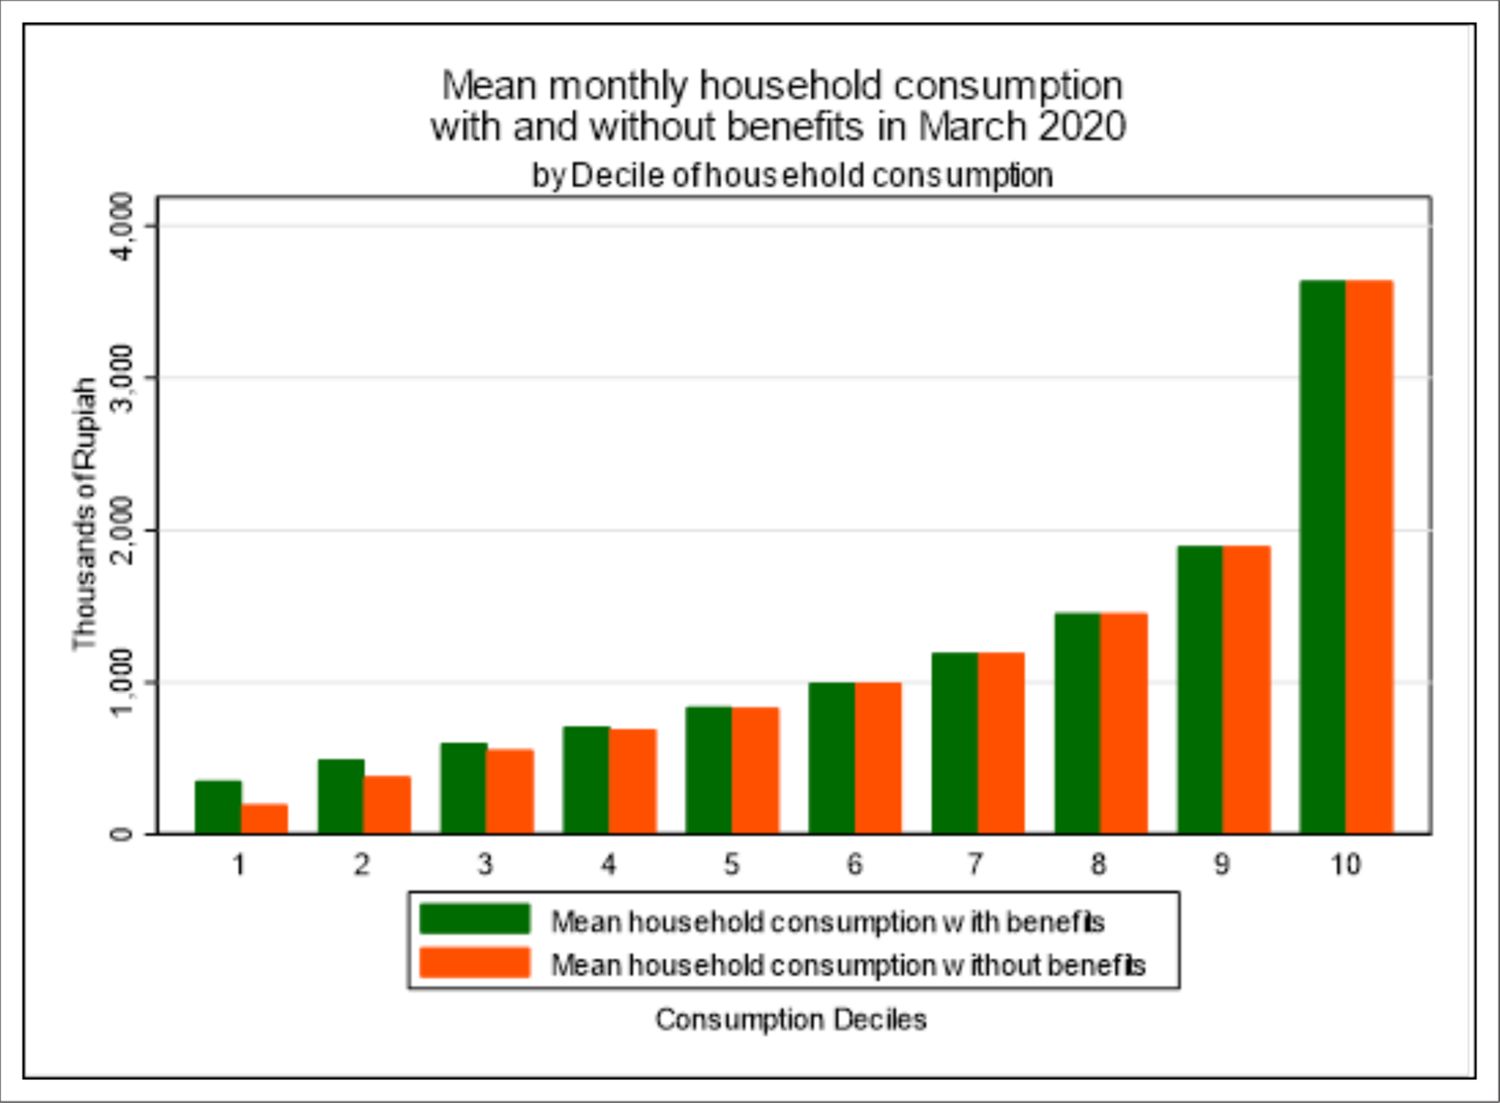
Deciles of mean monthly household consumption in Indonesia, with and without social benefits, March 2020. Source: Authors’ analysis using INDOMOD V2.1.
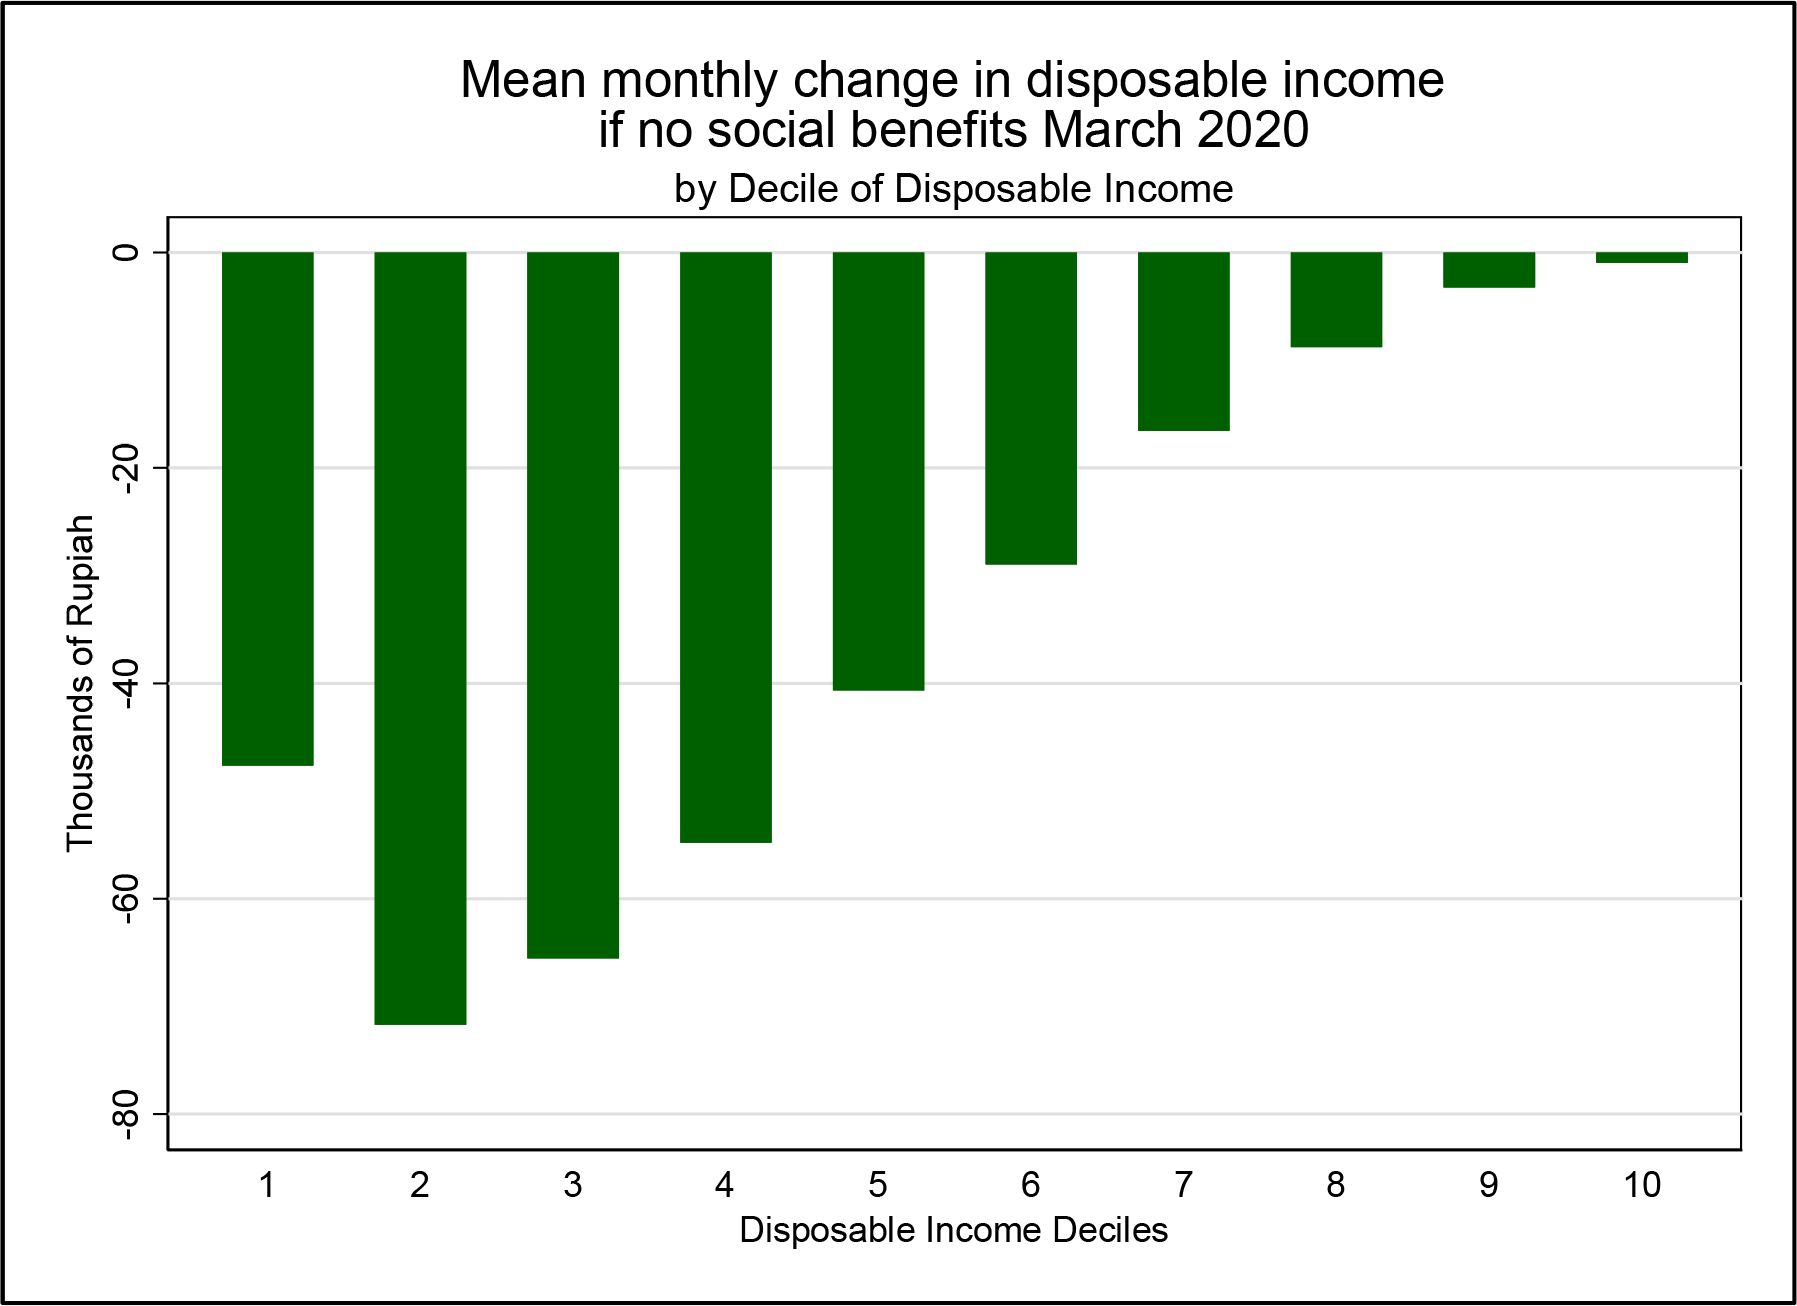
Depicted another way, Figure 2 shows how household consumption would fall if there were no benefits in place in March 2020 (i.e. having switched off all benefits in INDOMOD for the March 2020 timepoint).
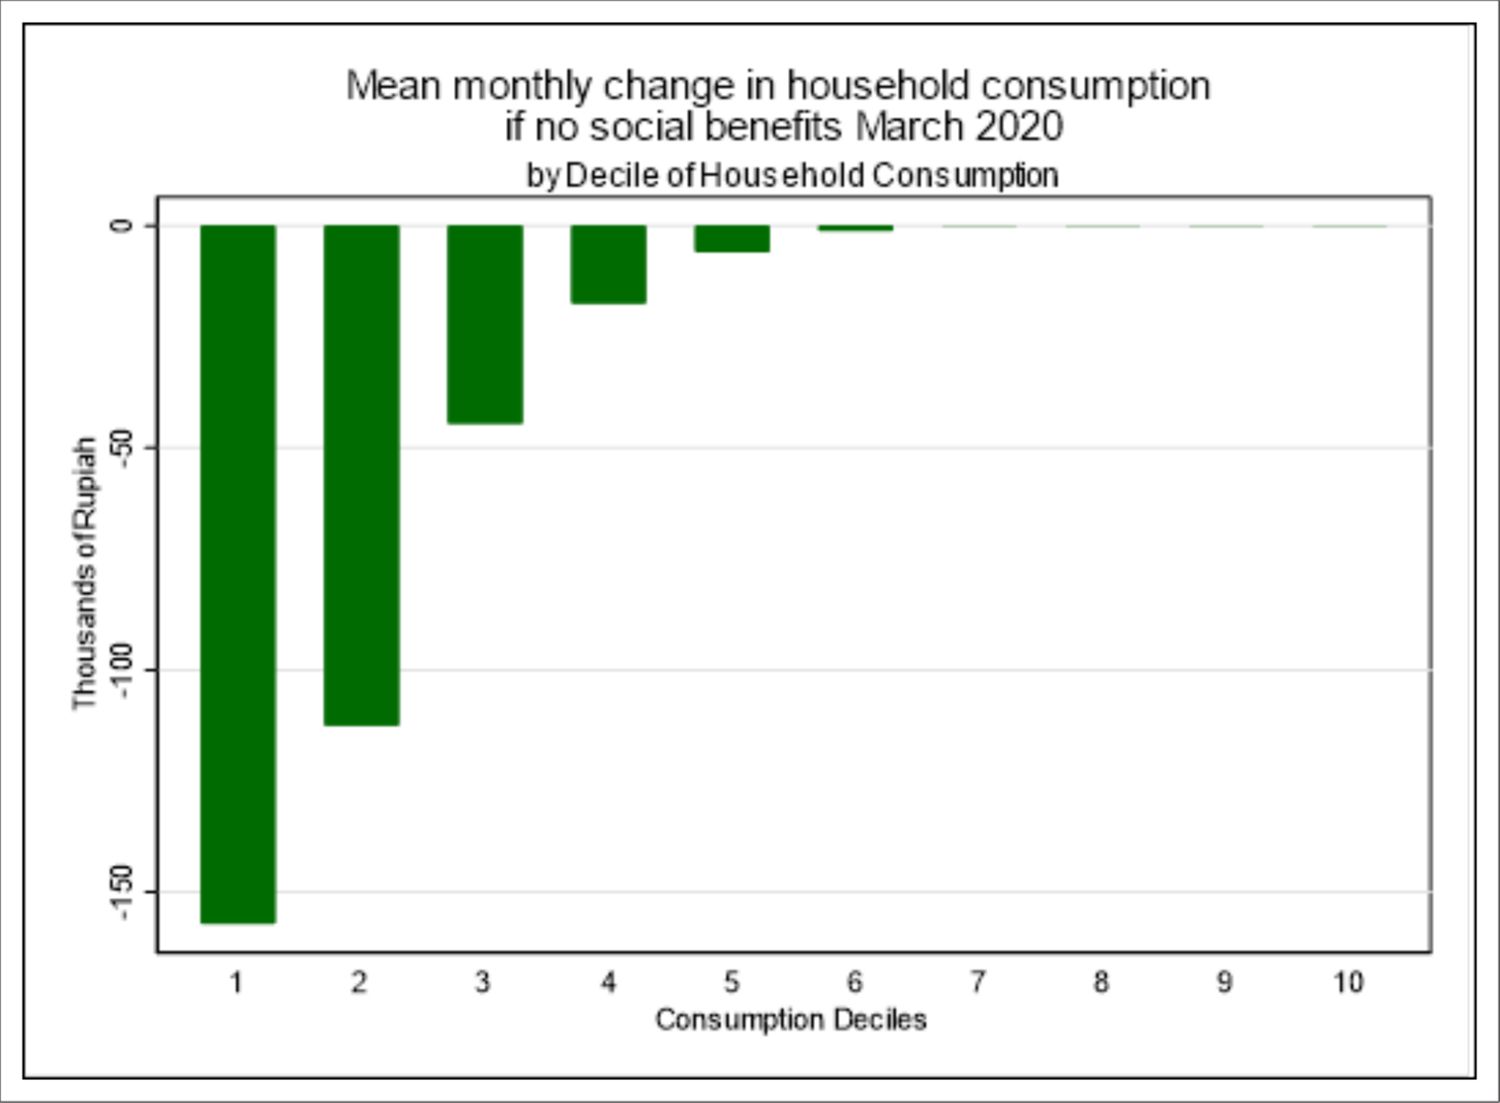
Change in mean monthly household consumption in Indonesia by decile if there were no social benefits, March 2020. Source: Authors’ analysis using INDOMOD V2.1.
The benefit system that was in place ahead of the pandemic was therefore playing an important part in supporting low income families. Indeed, in March 2020 the consumption-based poverty rate would have increased from 6.4 percent to 15.2 percent if there had been no benefits in place, a rise of almost nine percentage points (Table 2). The groups that would have been most adversely affected by the absence of the benefits that were in place prior to the pandemic were households containing one or more older people (their poverty rate would increase by more than 12 percentage points), followed by households containing one or more children (their poverty rate would increase by more than 10 percentage points). The depth of poverty would also have increased substantially in the absence of any benefits, with the FGT1 measure increasing from 0.83 to 5.15. Similarly, consumption-based inequality for March 2020 would have risen from a Gini coefficient of 0.374 to 0.403 if there had been no benefits.
Consumption based poverty and inequality in Indonesia, with and without social benefits, March 2020
| March 2020 BaselineA | March 2020 with no benefitsB | Difference(B-A) | |
|---|---|---|---|
| Share of poor population, in % | |||
| All | 6.81 | 15.43 | 8.62 |
| Poor households out of ... | |||
| ... male headed households | 6.70 | 15.26 | 8.56 |
| ... female headed households | 7.67 | 16.78 | 9.11 |
| ... households with children | 7.59 | 17.56 | 9.97 |
| ... households with older persons | 10.57 | 22.38 | 11.81 |
| Poverty gap (average normalised poverty gap, FGT(1)) | |||
| All | 0.89 | 5.33 | 4.44 |
| Poor households out of ... | |||
| ... male headed households | 0.88 | 5.19 | 4.31 |
| ... female headed households | 1.02 | 6.43 | 5.40 |
| ... households with children | 1.00 | 6.06 | 5.07 |
| ... households with older persons | 1.39 | 8.59 | 7.20 |
| Gini (household income) | 0.3723 | 0.4035 | 0.0312 |
| P80/P20 | 2.83 | 3.23 | 0.40 |
| Quantiles of distribution and median | IDR | ||
| 20th | 6,876,178.32 | 6,032,591.01 | -843,587.31 |
| 40th | 9,335,834.64 | 9,189,955.88 | -145,878.76 |
| 50th | 10,958,145.00 | 10,889,965.84 | -68,179.16 |
| 60th | 13,041,102.48 | 13,028,532.96 | -12,569.52 |
| 80th | 19,458,819.12 | 19,457,939.58 | -879.54 |
-
Source: Authors’ analysis using INDOMOD V2.1.
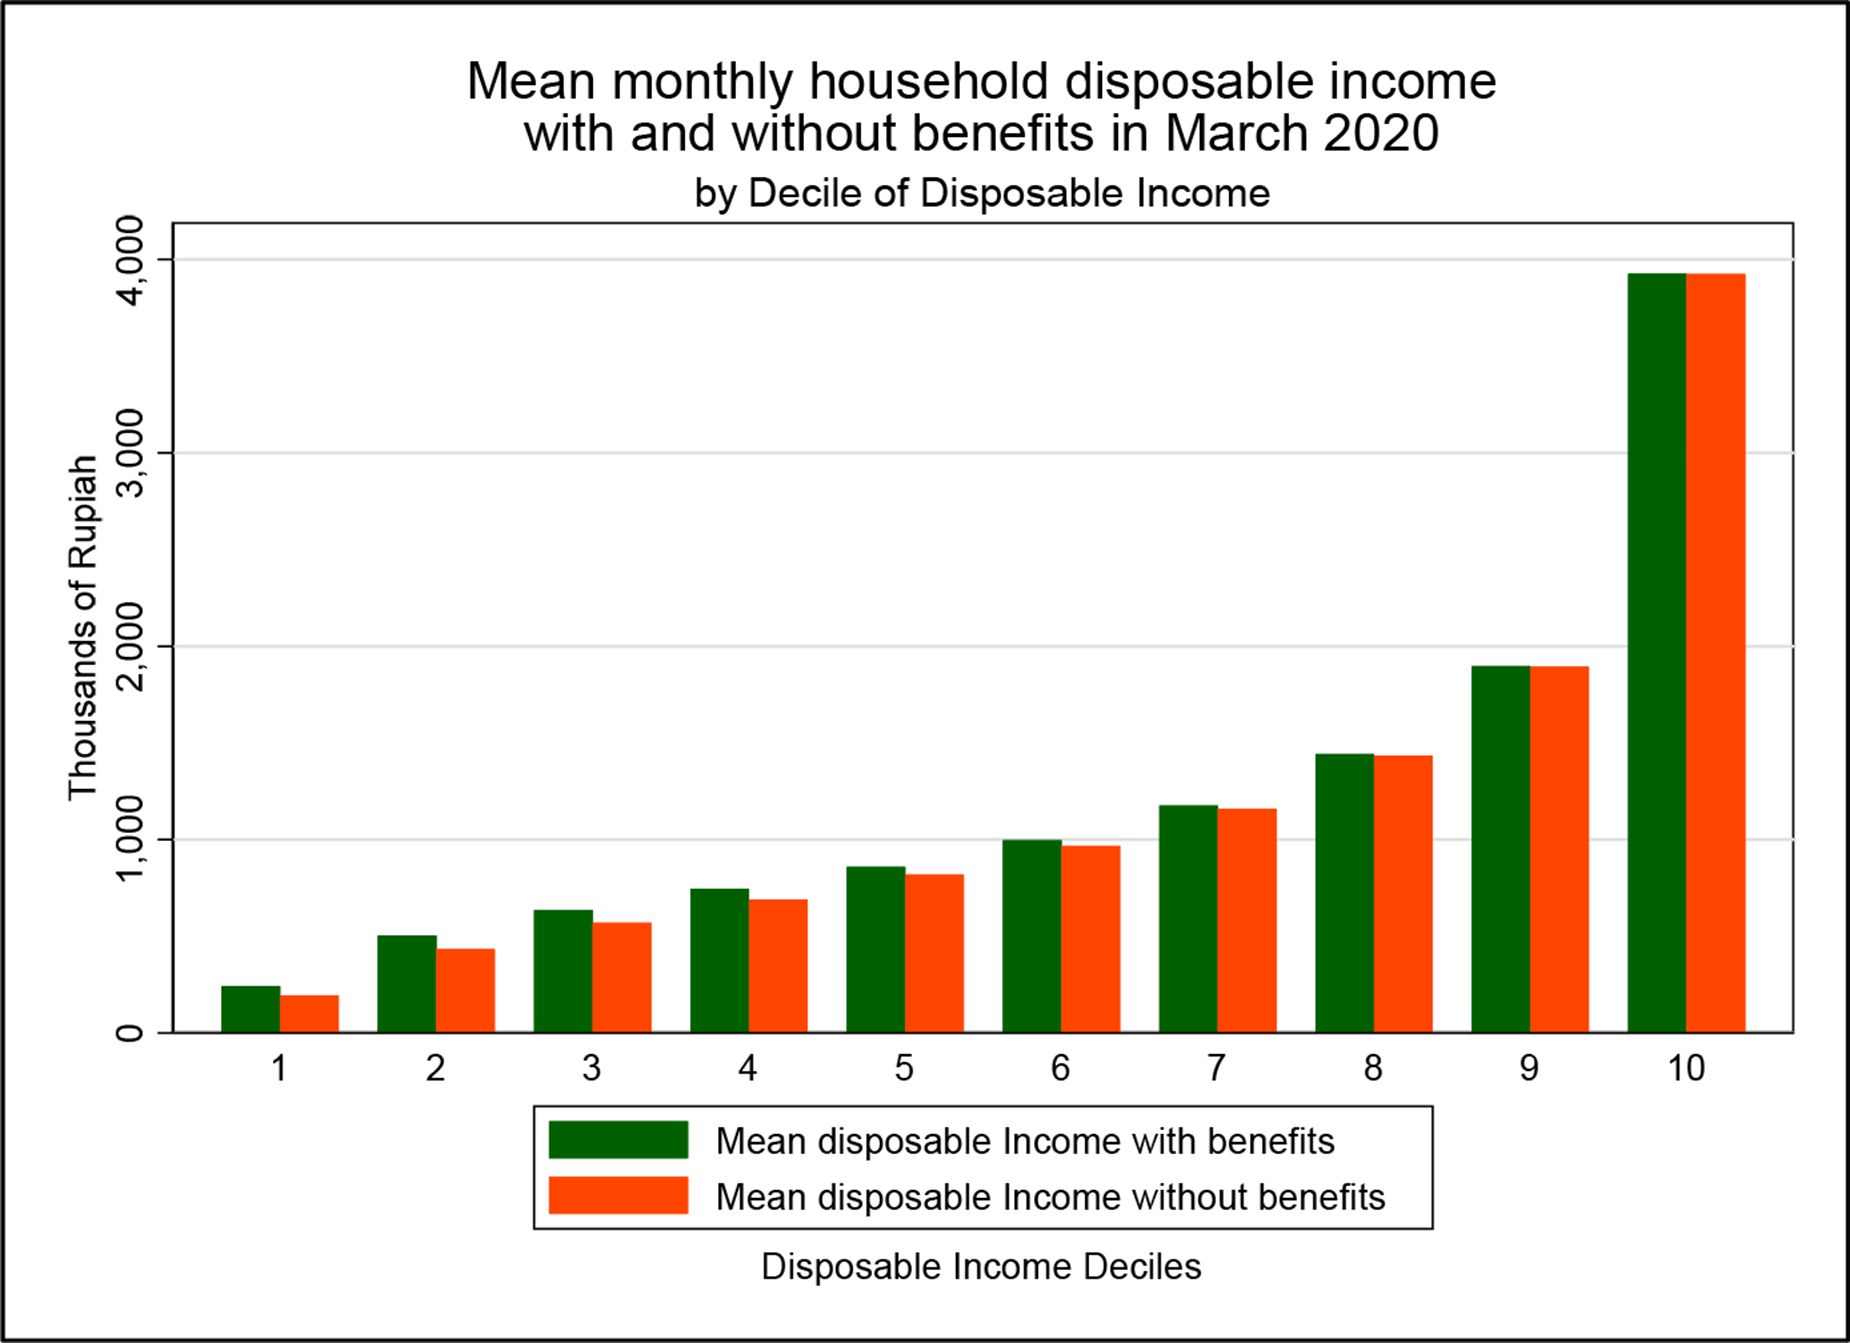
The SUSENAS dataset also enables comparable baseline analysis to be undertaken by mean household disposable income, and this is presented in Annex 6. For example, Figure F1 (1) in Annex 6 provides a similar picture to that of Figure 1 but the impact of the benefits is discernible across more of the deciles of mean monthly household disposable income than for consumption. This is also reflected in Figure F2, where the change in mean monthly household income is more pronounced across more of the deciles.
6. Results – impact of COVID-19 on earnings
In this section, results are presented on the impact of the COVID-19 pandemic and the containment measures on earnings in the labour market. The results are obtained from INDOMOD’s four input datasets relating to each quarter of 2020, having applied the shocks described in Section 4.
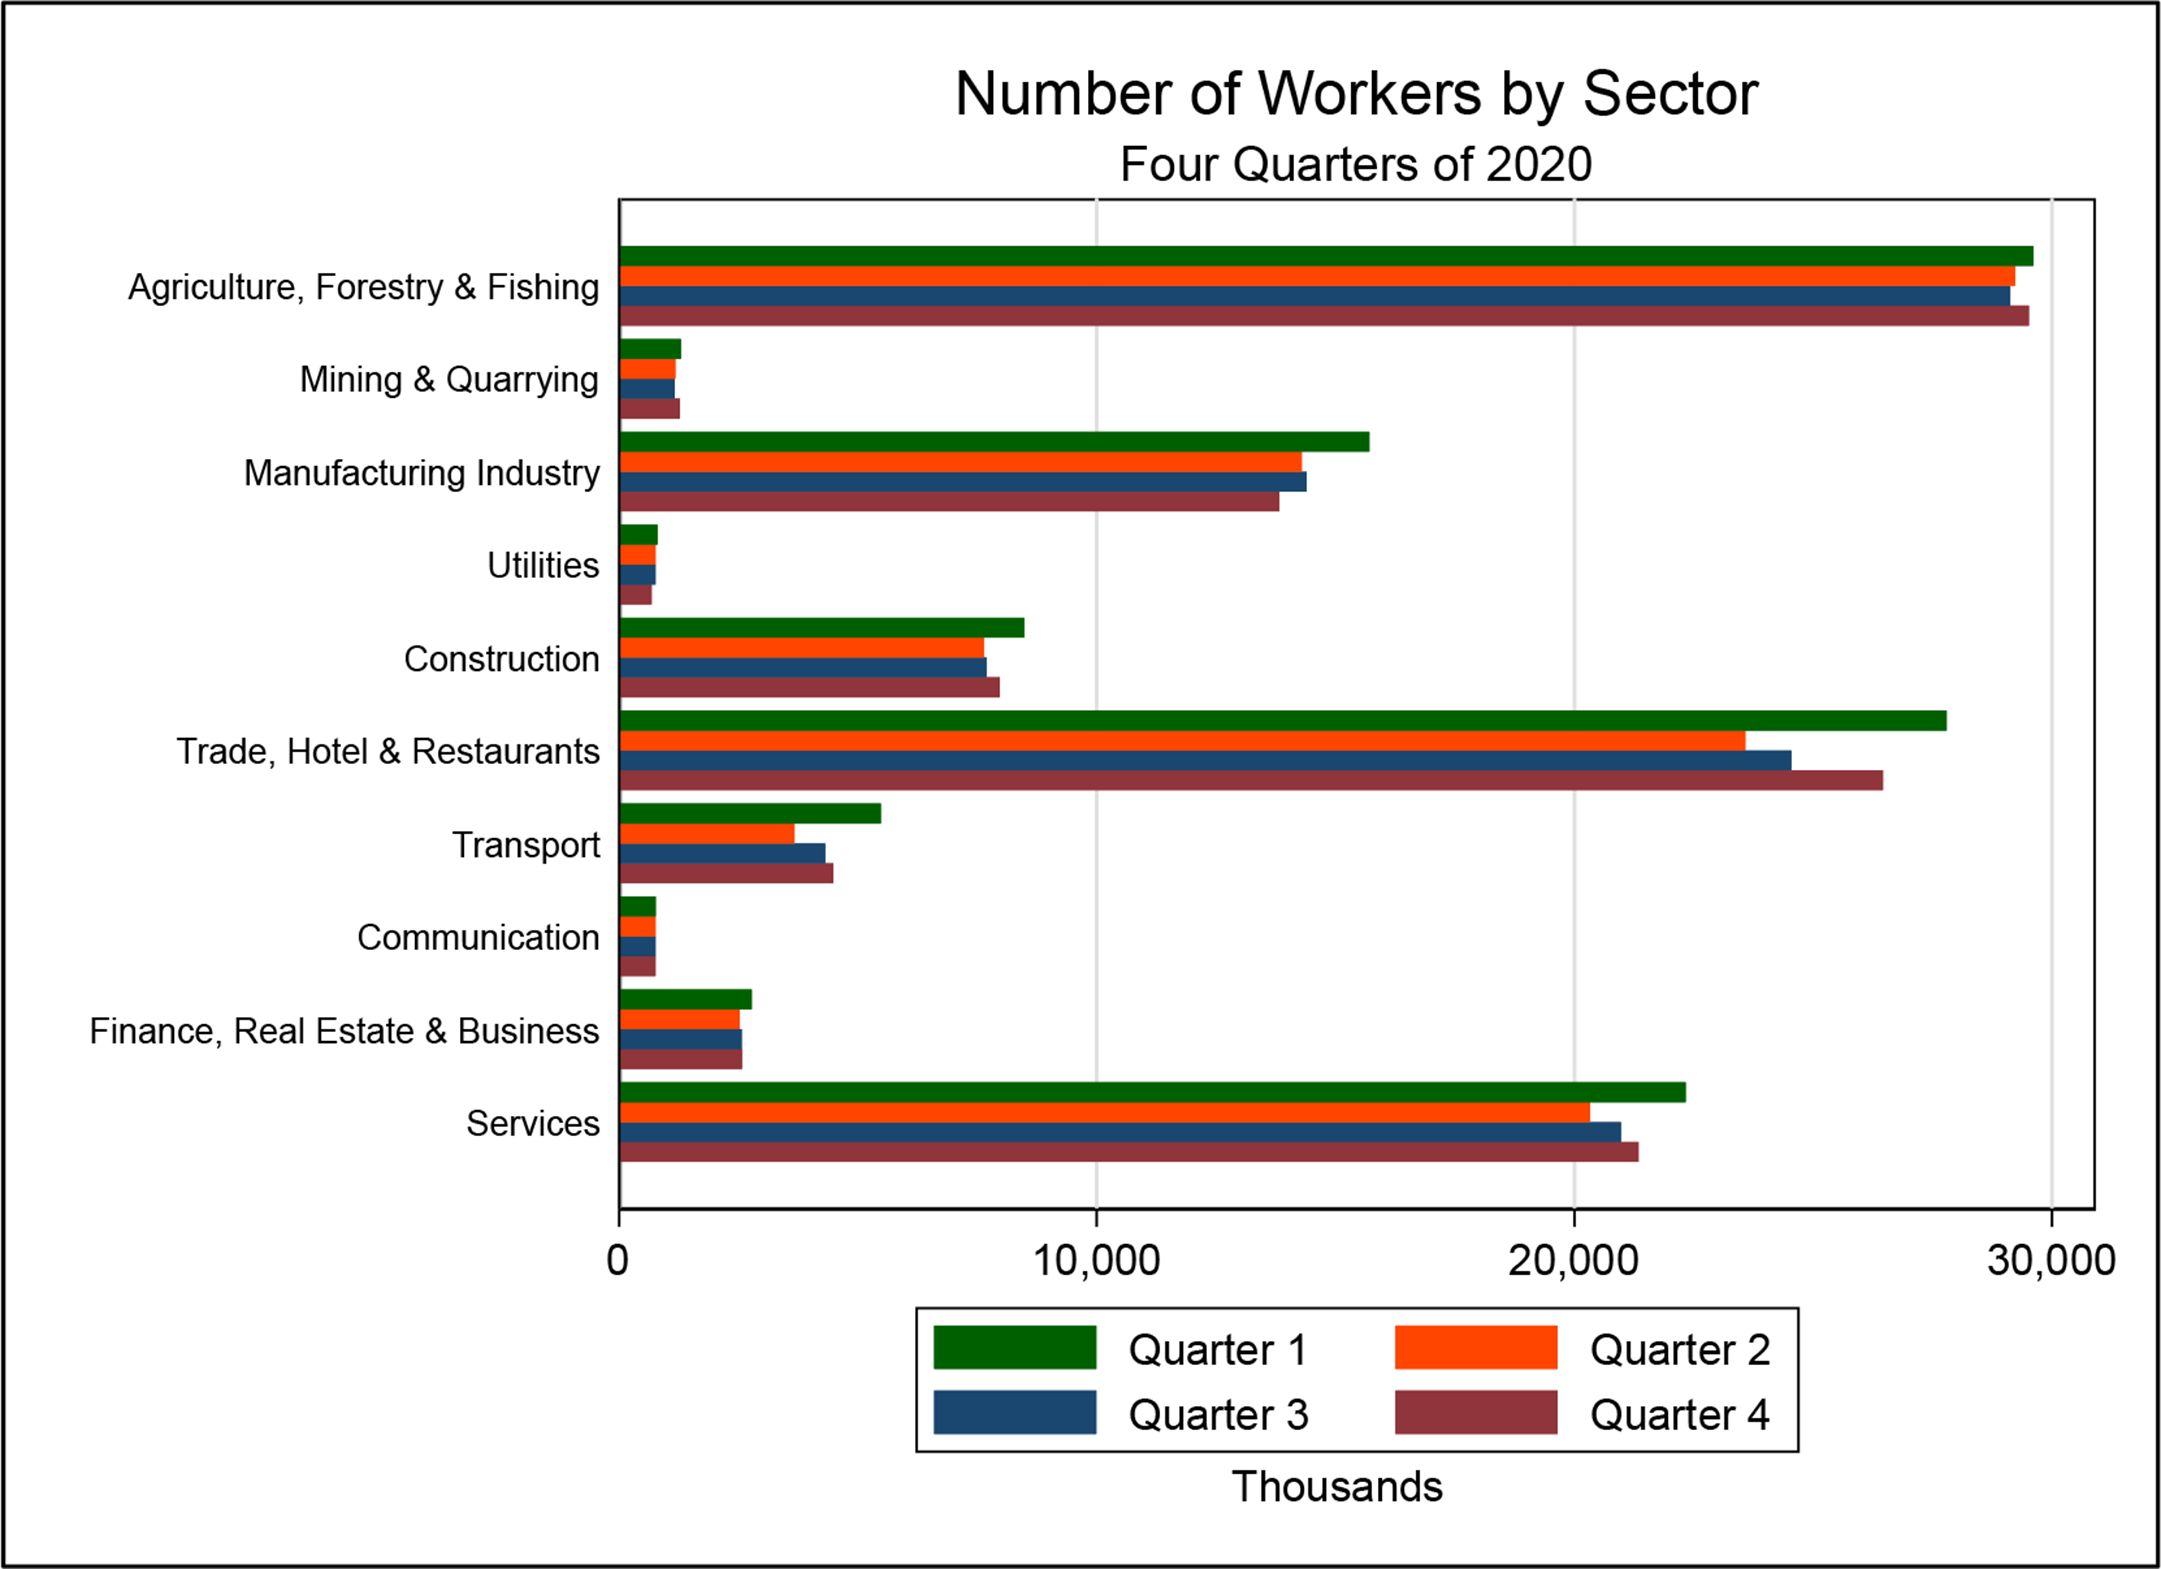
Figure 3 shows the number of workers in the four quarters of 2020 by sector.9 Each sector saw the largest fall in the number of workers between quarter 1 and quarter 2 with the greatest reduction being for those working in the Trade, Hotel and Restaurant sector. Some recovery is evident in quarters 3 and 4, particularly in Trade, Hotel, and Restaurants; Transport; and Services.

Number of workers in Indonesia by sector by quarter in 2020. Source: Authors’ analysis using the four input datasets.
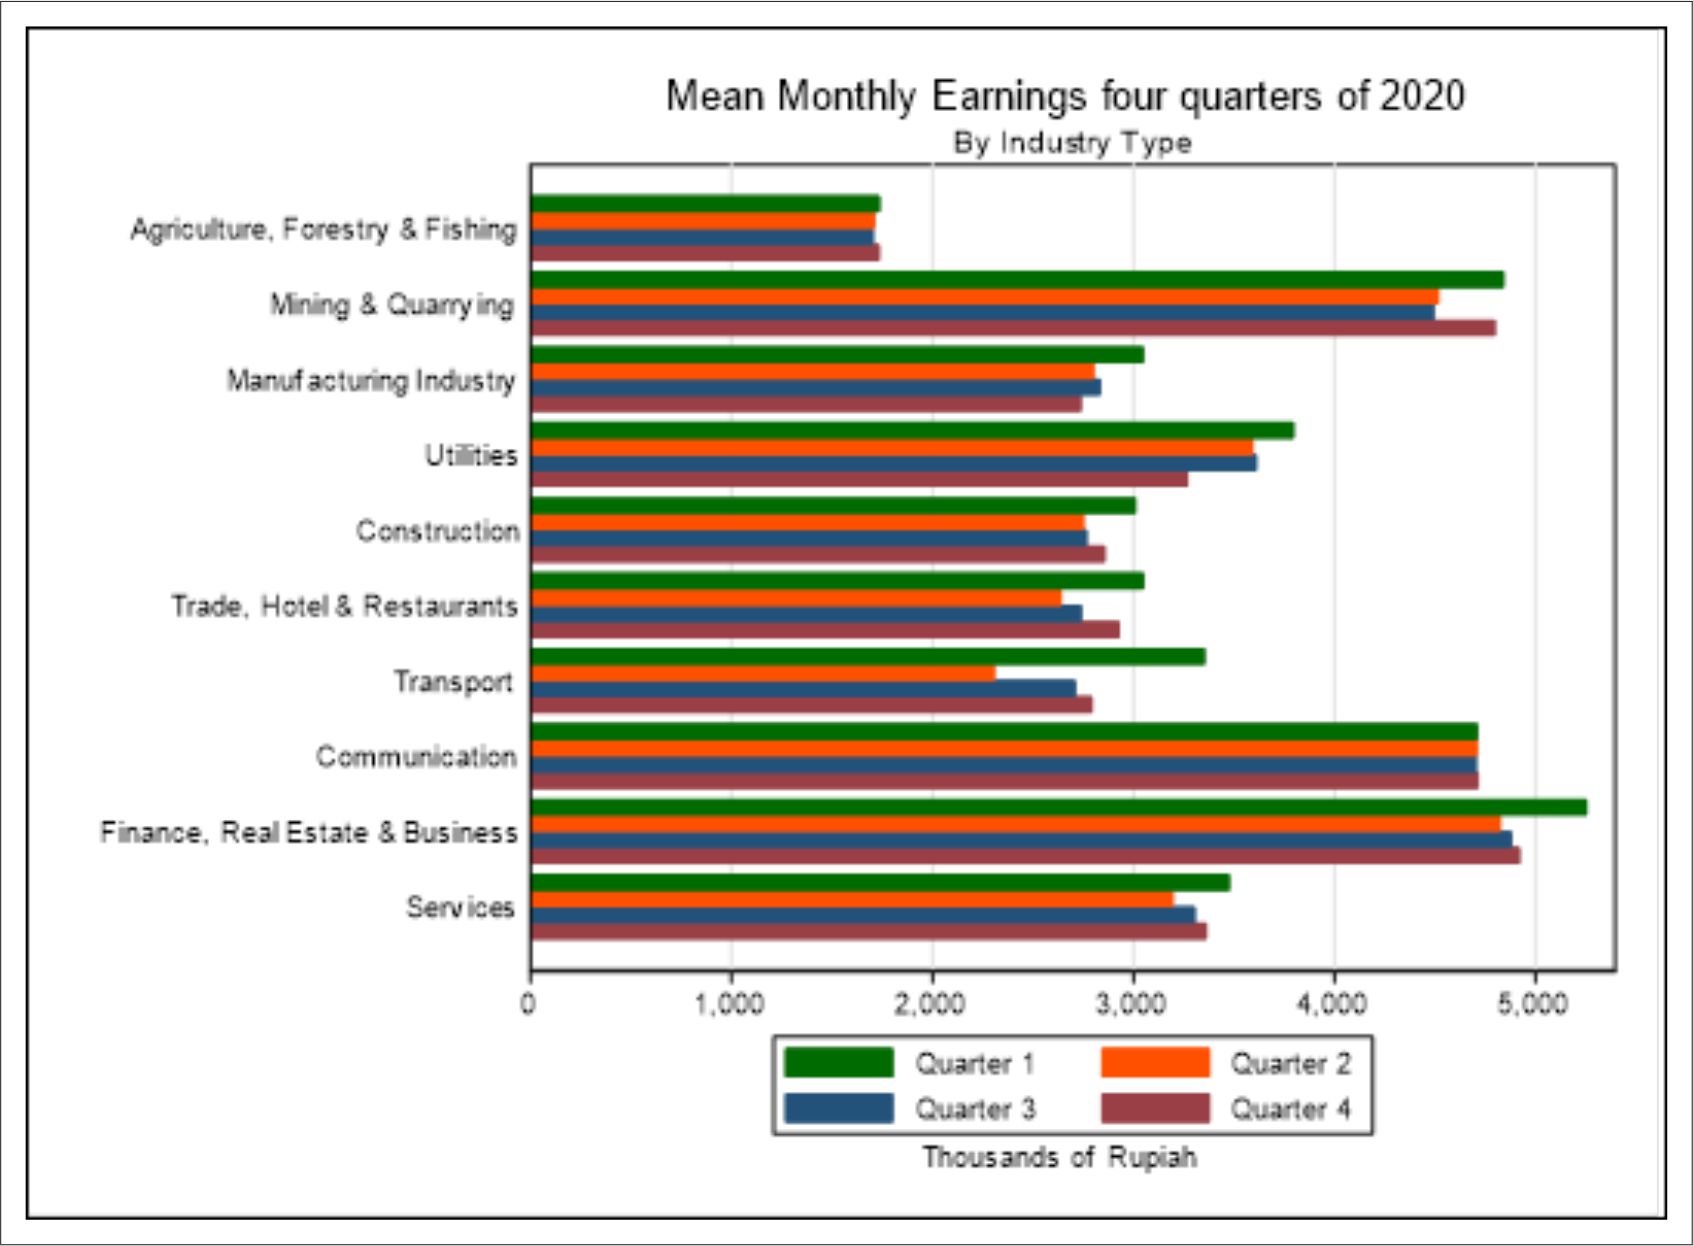
The mean monthly employment earnings also dropped in each sector between quarter 1 and quarter 2, apart from Communication (see Figure 4).

Mean monthly earnings in Indonesia by sector by quarter in 2020. Notes: The figures for Q2, Q3 and Q4 include the zero earnings of the individuals who were in employment in Q1 but were not in employment in one or more of the subsequent quarters. Source: Authors’ analysis using the four input datasets.
7. Results – Combined Impact of COVID-19 Pandemic and the Tax-Benefit Policies
In this section, results on the combined impact of the shock of the pandemic and the tax and benefit policies are presented.
7.1. Results including the COVID-19 policies
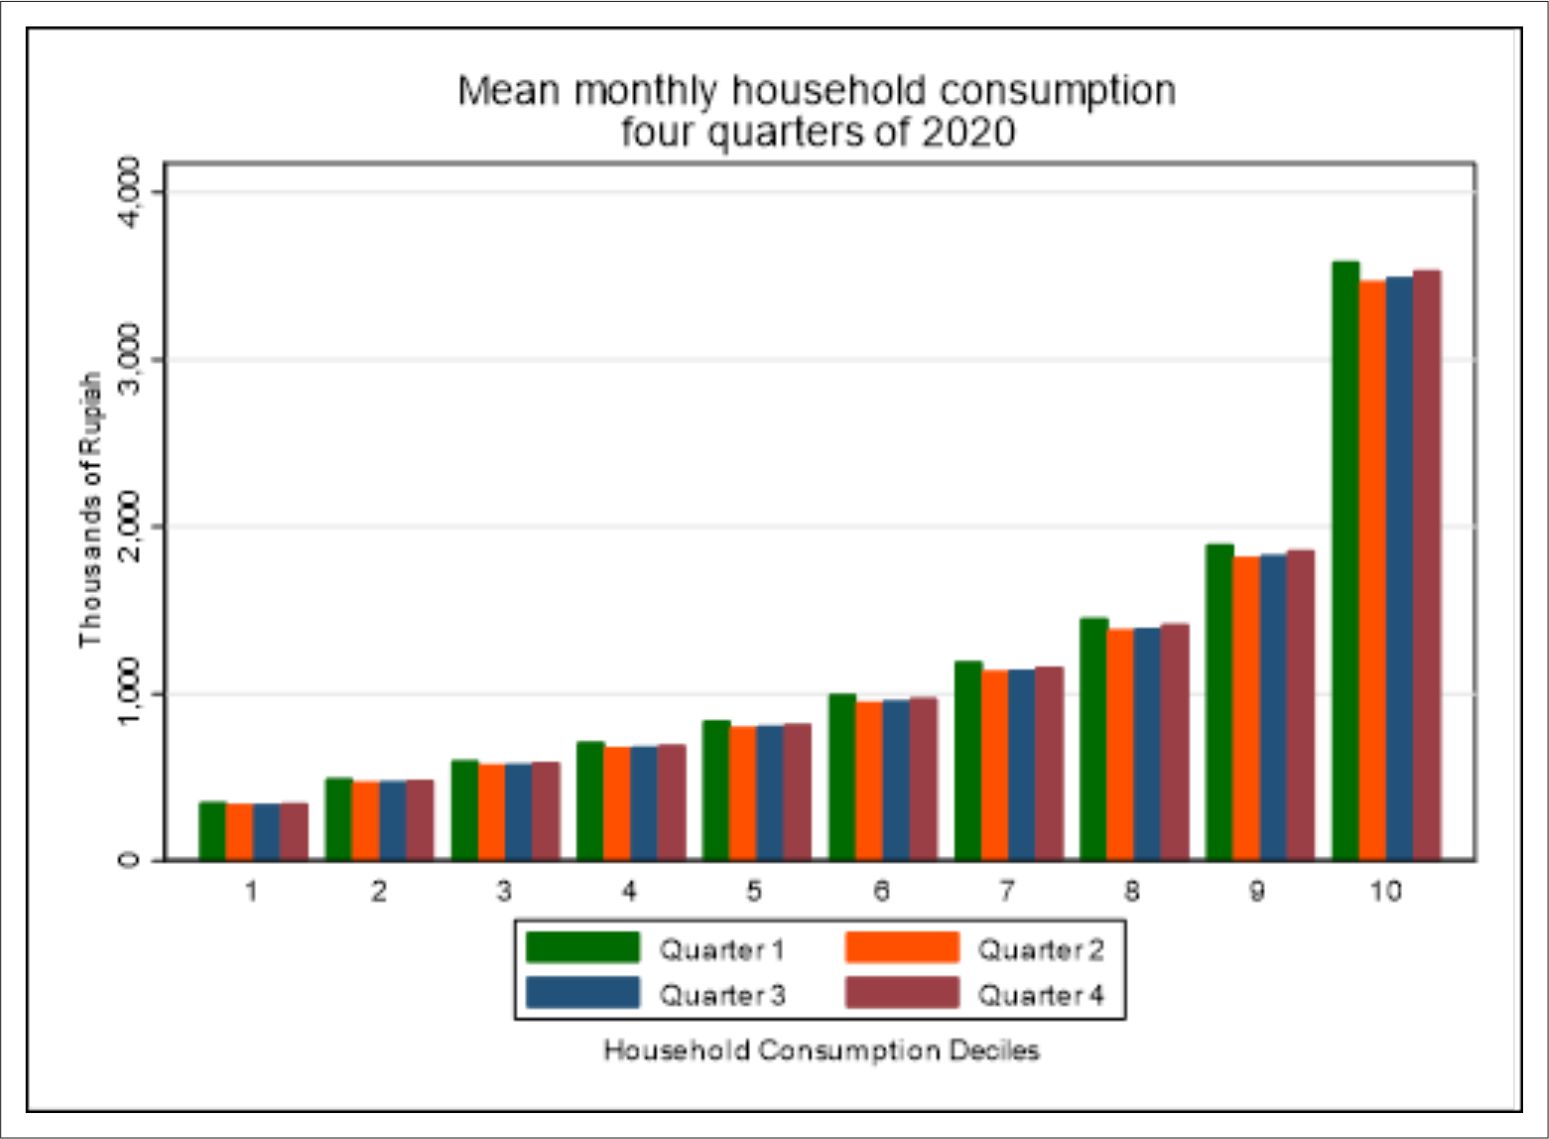
Figure 5 shows that the mean monthly household consumption in Indonesia fell between the first two quarters of 2020, across the whole distribution. Figure 6 shows that in absolute terms the fall in mean monthly household consumption increases by decile, with the greatest fall in absolute terms occurring in the tenth decile. It also shows that the mean monthly household consumption levels did not recover by the fourth quarter to the levels of quarter 1 for any of the ten deciles. This means that even with the automatic stabilisers and the remedial additional benefits, consumption levels did not fully recover by quarter 4 across the whole distribution.10

Deciles of mean monthly household consumption in Indonesia by quarter in 2020. Source: Authors’ analysis using INDOMOD V2.1.
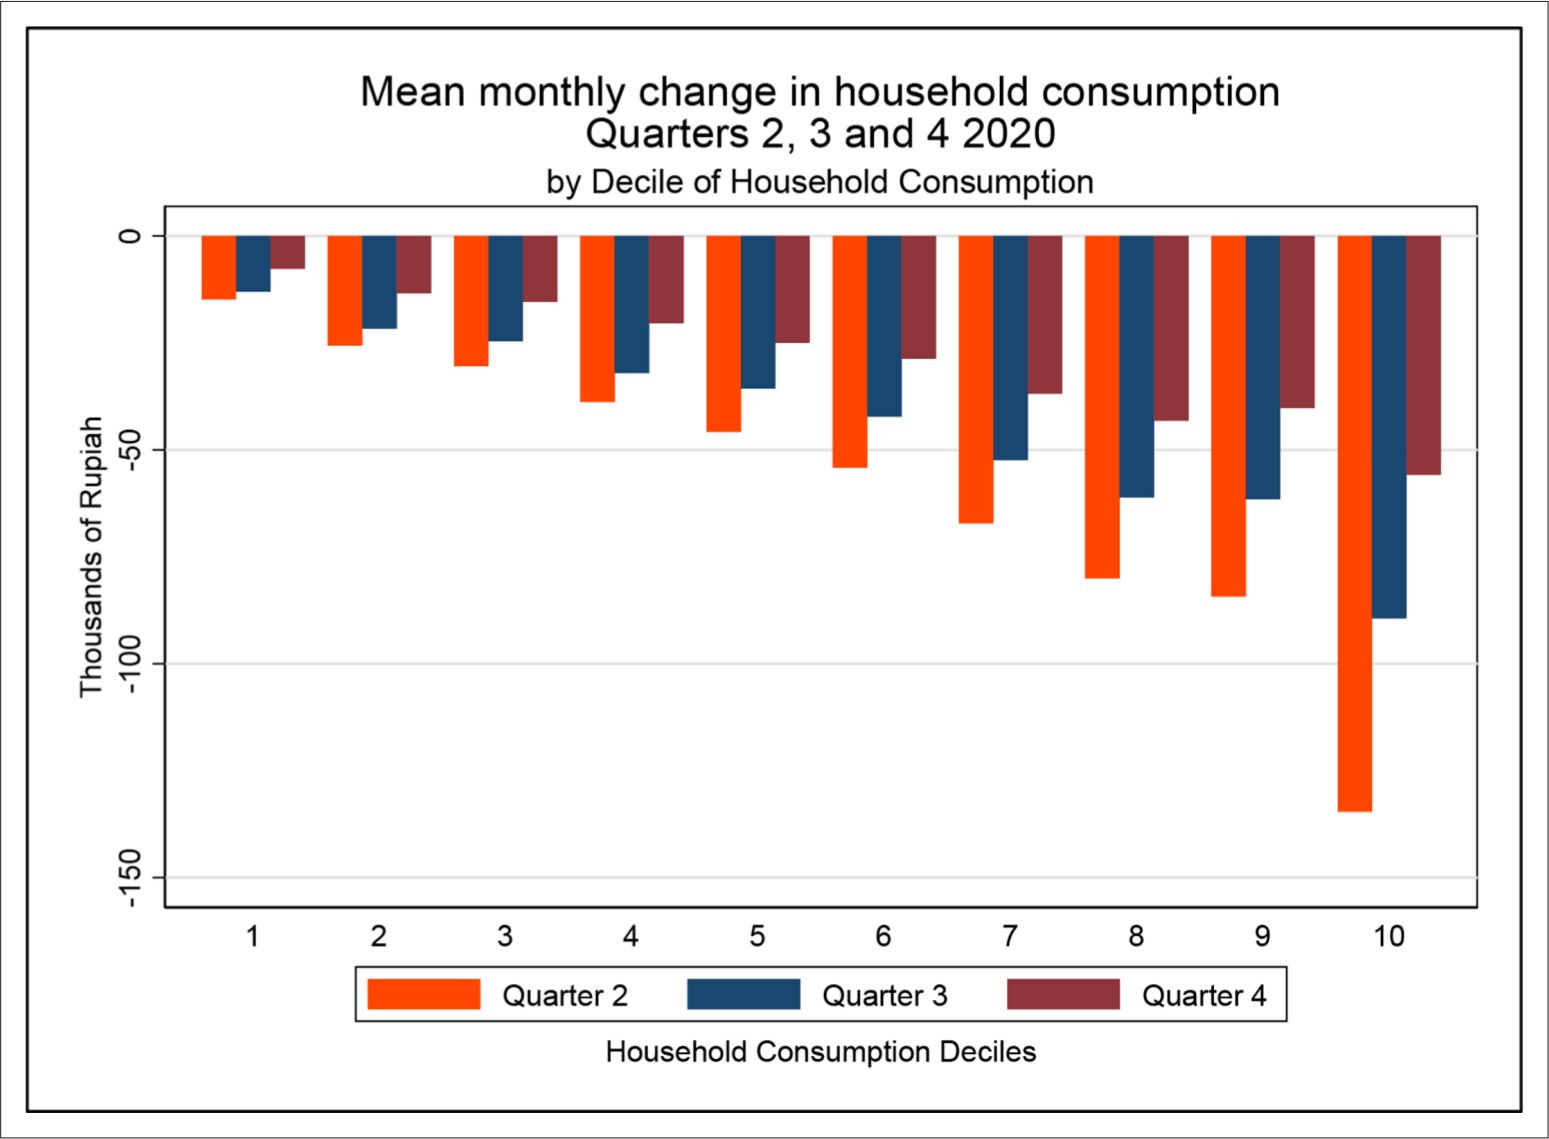

Change in mean monthly household consumption in Indonesia by quarter in 2020. Source: Authors’ analysis using INDOMOD V2.1.
Figure 7 shows the percentage fall in mean monthly household consumption by decile. All deciles, apart from decile 10, experienced a fall in mean monthly household consumption between quarter 1 and quarter 2 of more than 4 percent. Comparing quarter 3 with quarter 1, deciles 2 to 8 still had a mean monthly household consumption fall of more than 4 percent. By quarter 4, the mean monthly fall in household consumption had reduced to less than 2 percent for decile 10, but was still greater than 2 percent for deciles 1 to 9.
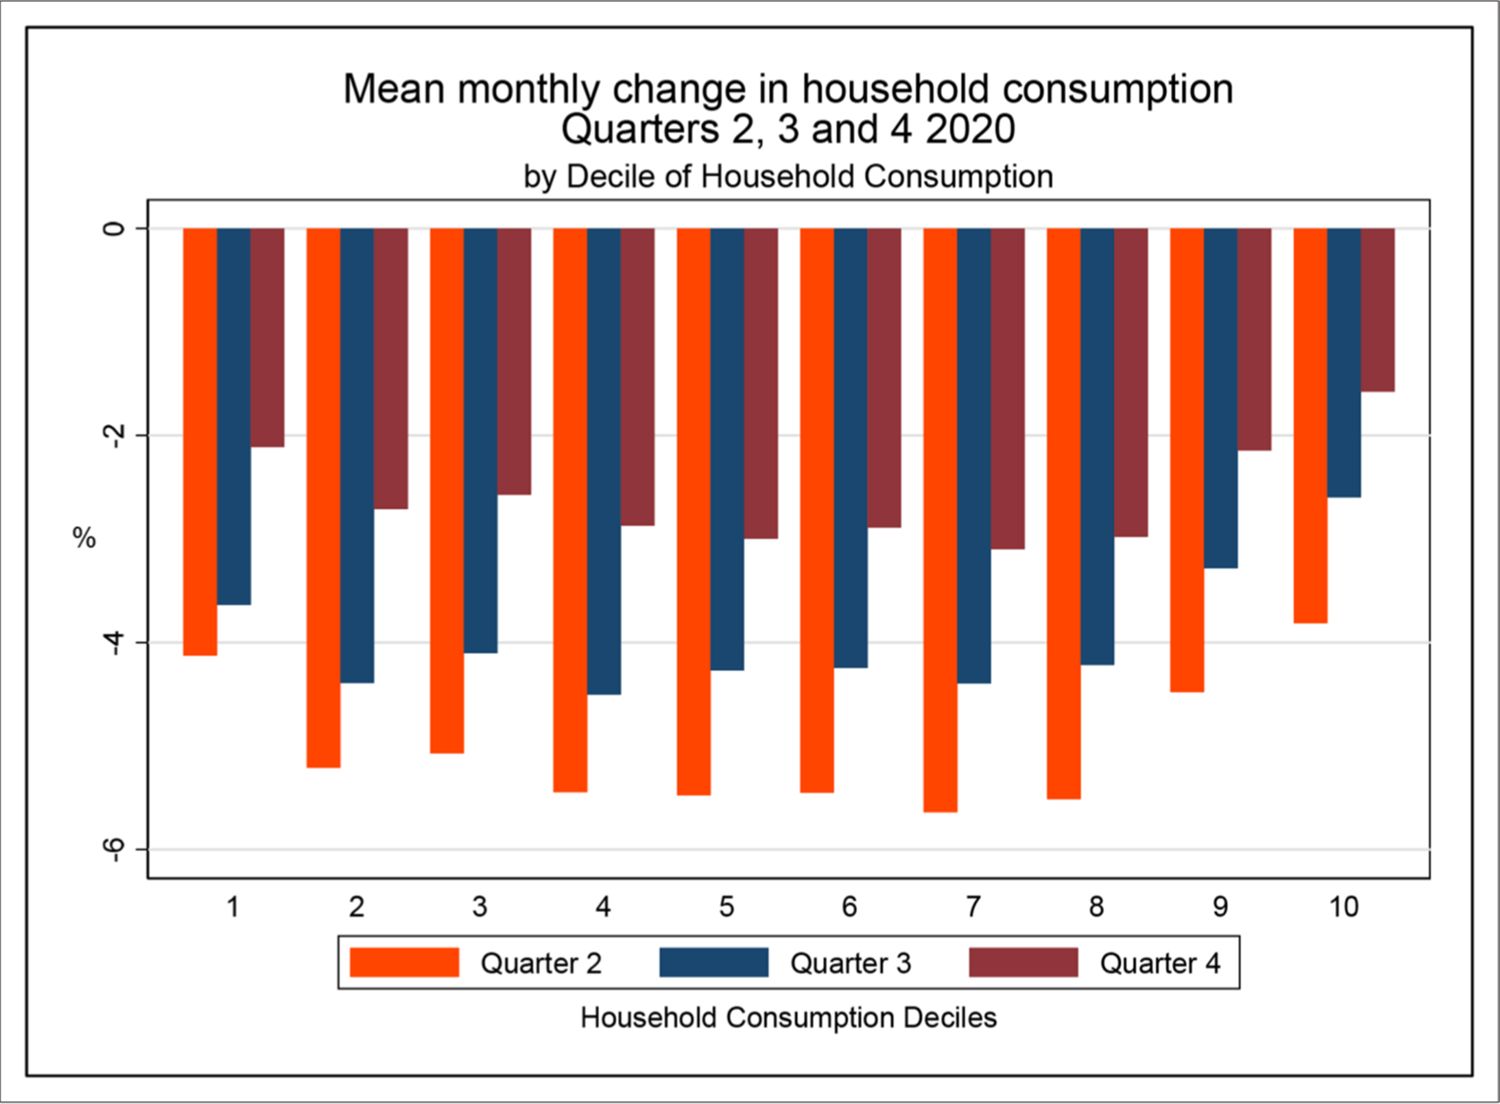
Percentage change in mean monthly household consumption in Indonesia by quarter in 2020. Source: Authors’ analysis using INDOMOD V2.1.
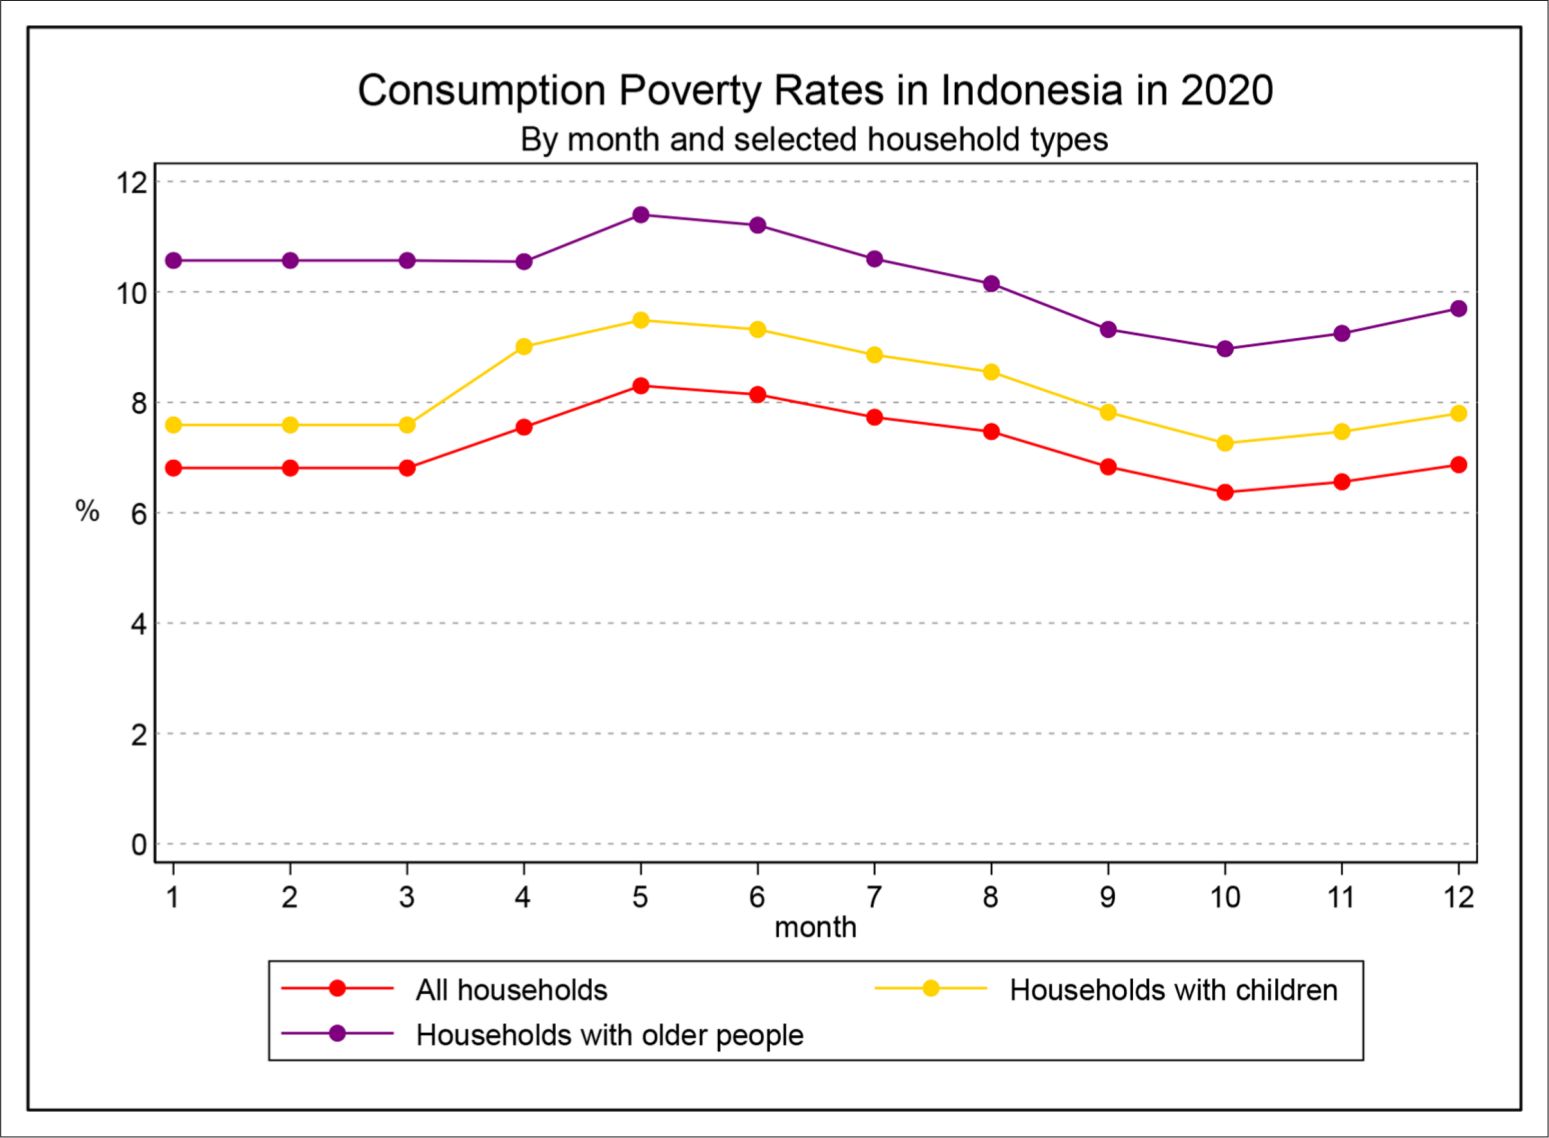
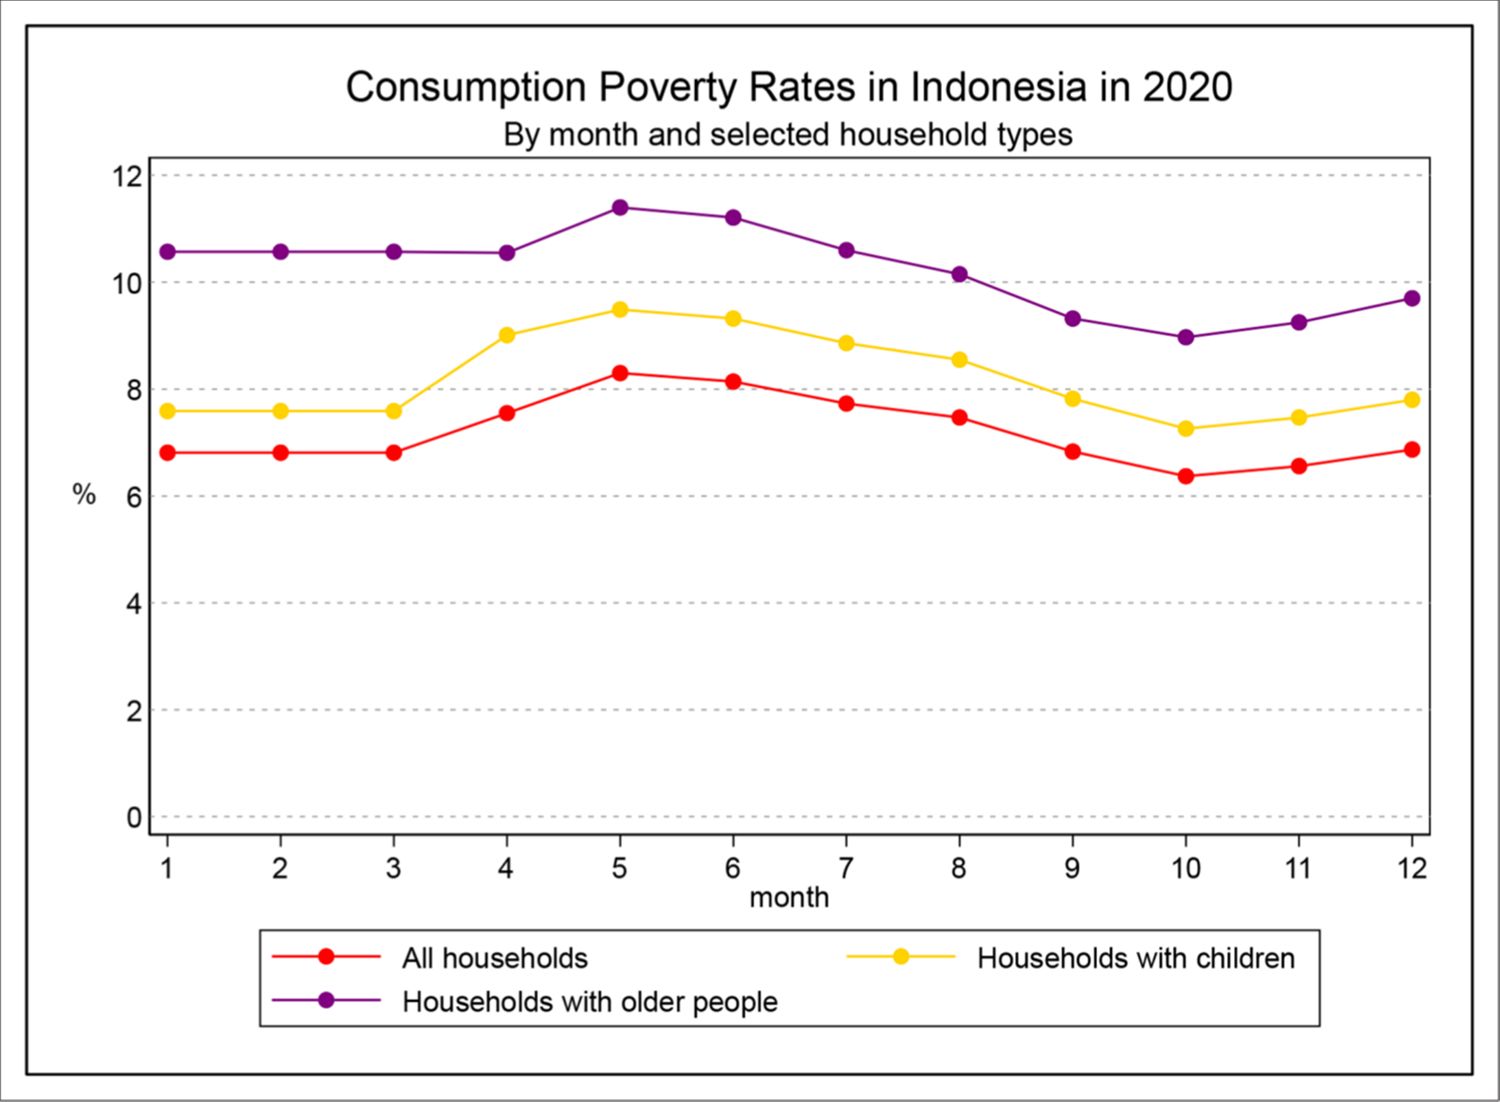
Figure 8 shows the poverty rates for each month for all households (in red), and for households containing one or more children (in yellow), and households containing one or more older people (in purple) (these sub-groups are not mutually exclusive). Overall, household poverty rose from 6.8 percent at the start of the year to a high of 8.3 percent in May, falling by the end of the year to 6.9 percent.
Poverty in Indonesia by month, 2020. Source: Authors’ analysis using INDOMOD V2.1.
This pattern is broadly repeated by the different household types. Notably, households containing one or more older people, and (to a lesser extent) containing one or more children, have higher poverty levels than the overall household poverty levels in each month. So, households containing one or more children started the year with a poverty rate of 7.6 percent, rising to a high of 9.5 percent in May; and households containing one or more older people started the year with a poverty rate of 10.6 percent, rising to a high of 11.4 percent in May. For both sub-groups, and for the overall population, poverty increased a little between October and December 2020: this is likely to be due to the phasing out of the pre-employment card and wage subsidy COVID-19 policies (see Annex 3).
A subset of these results including poverty depth and inequality measures are presented in Table 3 below which shows how poverty changed between the mid-points of each quarter: February, May, August and November 2020. In November, the poverty rates are slightly lower than the start of the year for the total population and all sub-groups shown, though as can be seen in Figure 8, overall poverty did increase further in December.
Consumption-based poverty and inequality in Indonesia in February, May, August and November 2020
| February 2020 BaselineA | May 2020B | Difference to baseline(B-A) | August2020C | Difference to baseline(C-A) | November 2020D | Difference to baseline(D-A) | |
|---|---|---|---|---|---|---|---|
| Share of poor population, in % | |||||||
| All | 6.81 | 8.30 | 1.50 | 7.47 | 0.66 | 6.56 | -0.25 |
| Poor households out of ... | |||||||
| ... male headed households | 6.70 | 8.30 | 1.60 | 7.49 | 0.79 | 6.55 | -0.15 |
| ... female headed households | 7.67 | 8.32 | 0.65 | 7.29 | -0.38 | 6.65 | -1.02 |
| ... households with children | 7.59 | 9.49 | 1.90 | 8.55 | 0.96 | 7.47 | -0.13 |
| ... households with older persons | 10.57 | 11.40 | 0.83 | 10.15 | -0.42 | 9.25 | -1.32 |
| Poverty gap (average normalised poverty gap, FGT(1)) | 0.89 | 1.45 | 0.56 | 1.21 | 0.32 | 1.01 | 0.12 |
| All | |||||||
| Poor households out of ... | |||||||
| ... male headed households | 0.88 | 1.46 | 0.58 | 1.23 | 0.35 | 1.02 | 0.14 |
| ... female headed households | 1.02 | 1.37 | 0.35 | 1.08 | 0.06 | 0.96 | -0.07 |
| ... households with children | 1.00 | 1.67 | 0.68 | 1.40 | 0.41 | 1.16 | 0.16 |
| ... households with older persons | 1.39 | 1.85 | 0.46 | 1.52 | 0.13 | 1.33 | -0.05 |
| Gini (household income) | 0.3723 | 0.3647 | -0.0076 | 0.3663 | -0.0060 | 0.3614 | -0.0109 |
| P80/P20 | 2.83 | 2.82 | -0.01 | 2.78 | -0.05 | 2.73 | -0.10 |
-
Notes: The household subgroups are not mutually exclusive.
-
Source: Authors’ analysis using INDOMOD V2.1.
7.2. Results excluding the COVID-19 policies
The question remains though – how might the situation have looked if there had not been additional remedial policies put in place? That is, to what extent would the in-built automatic stabilisers in the tax-benefit system have protected people from the economic shock?
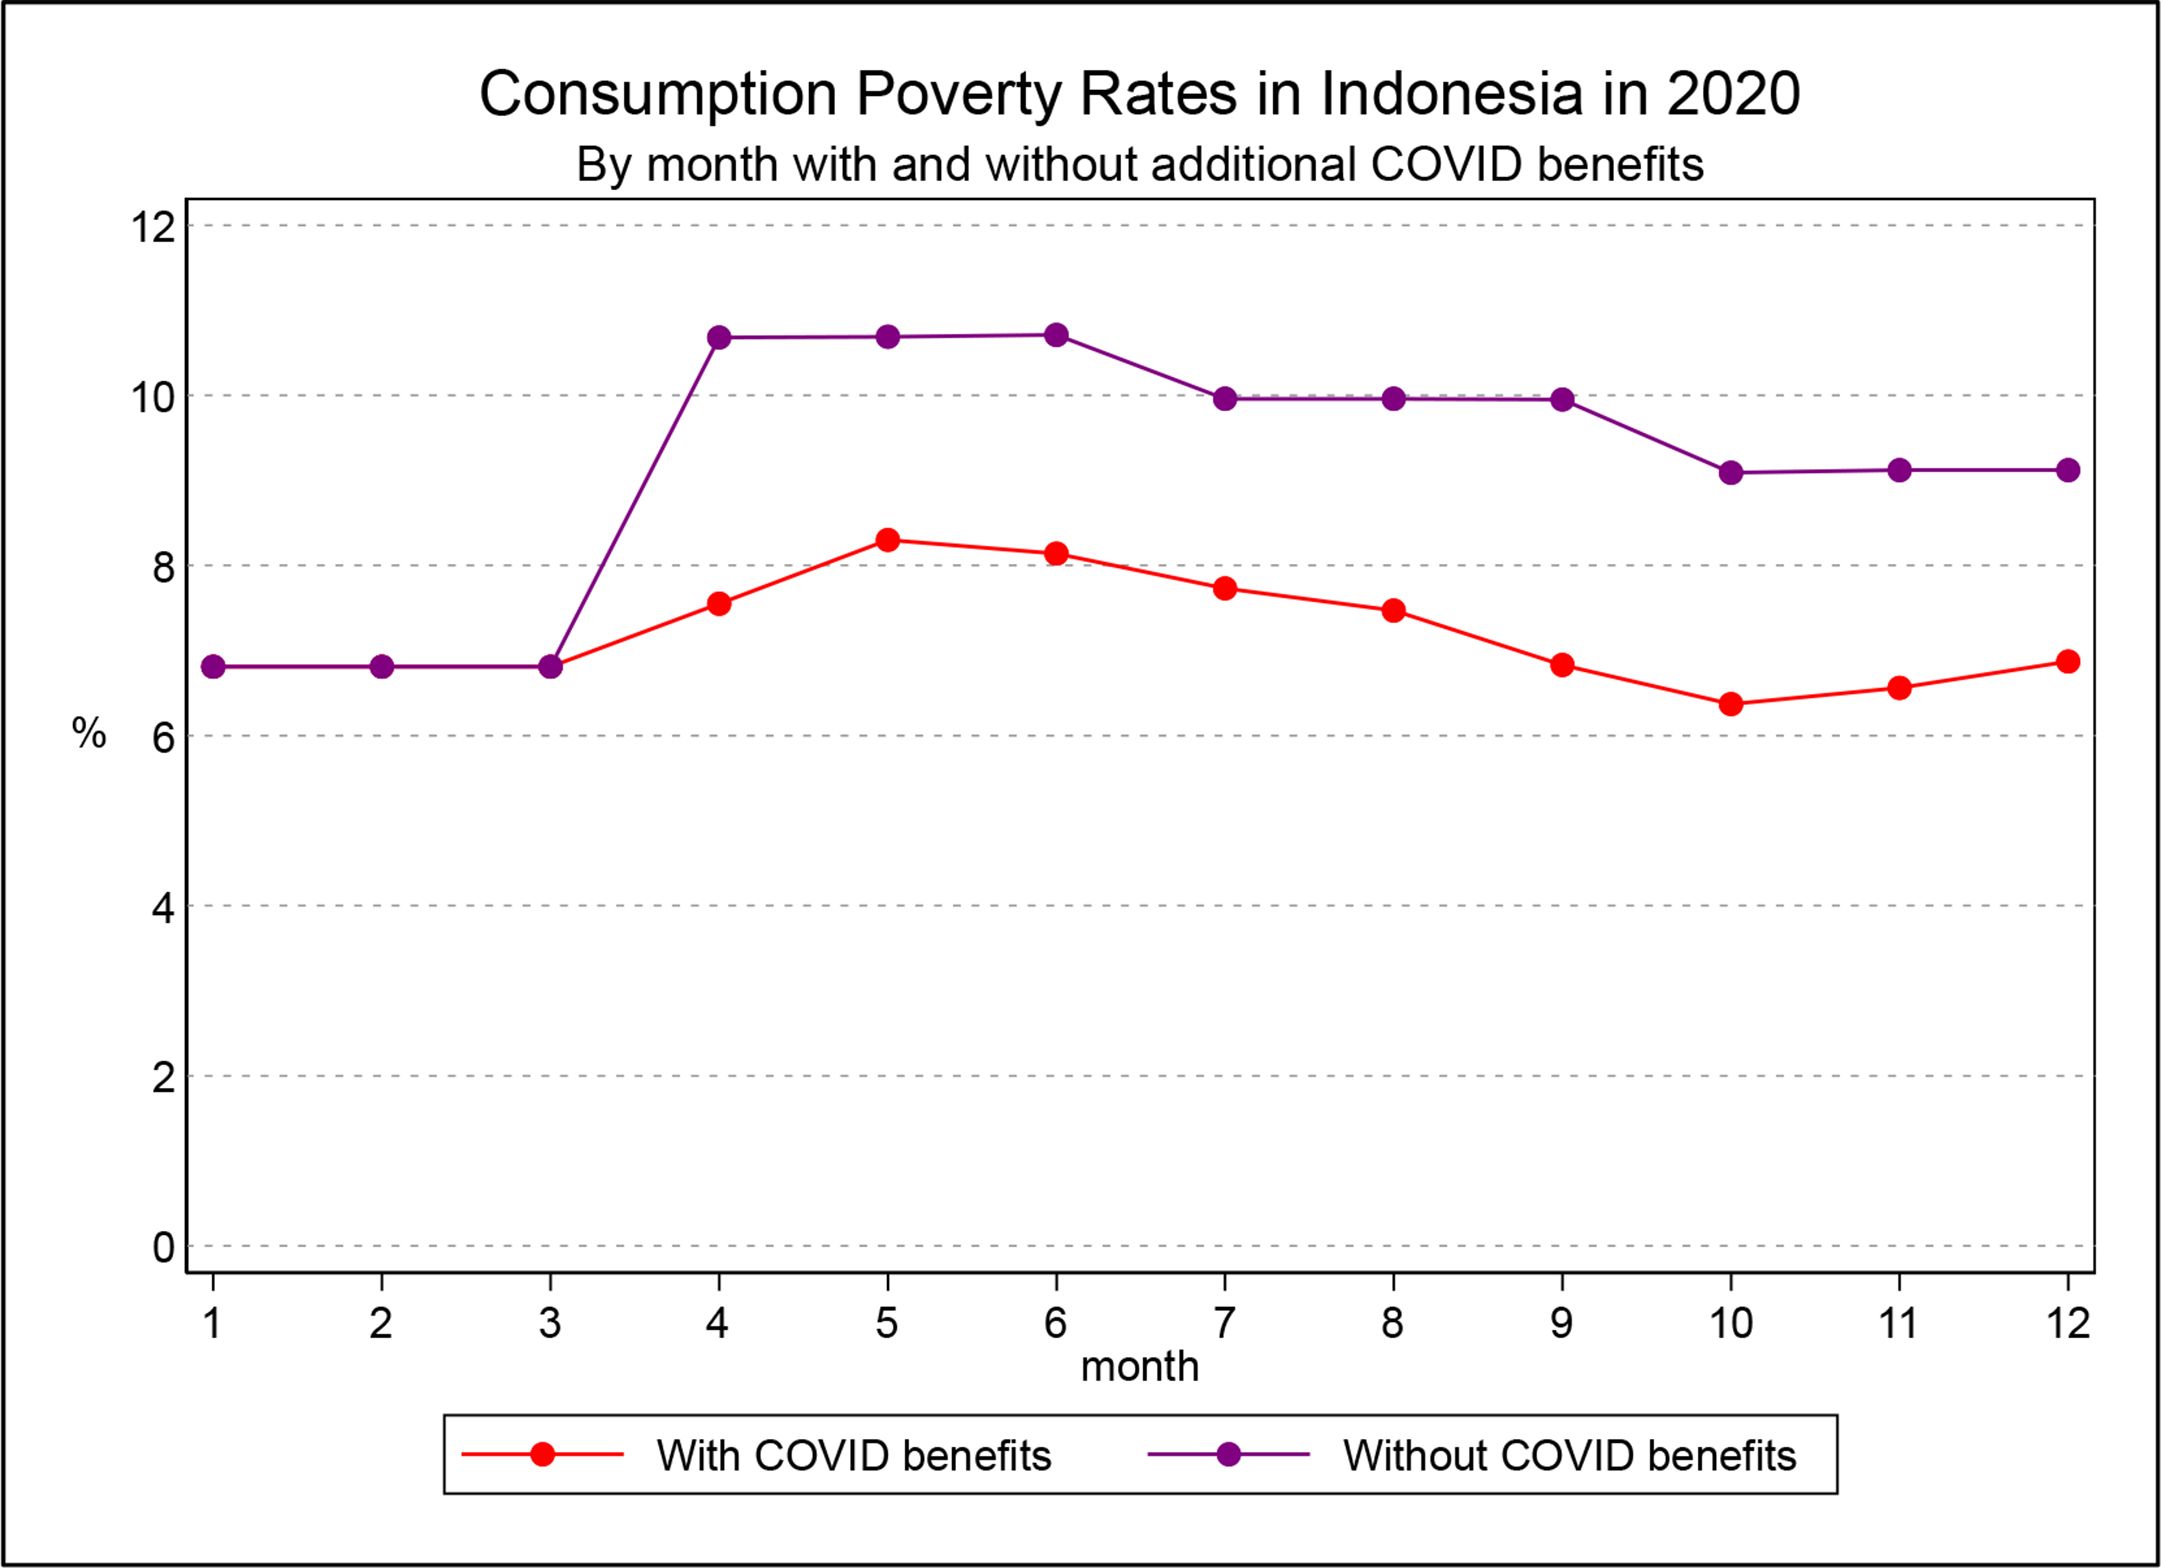
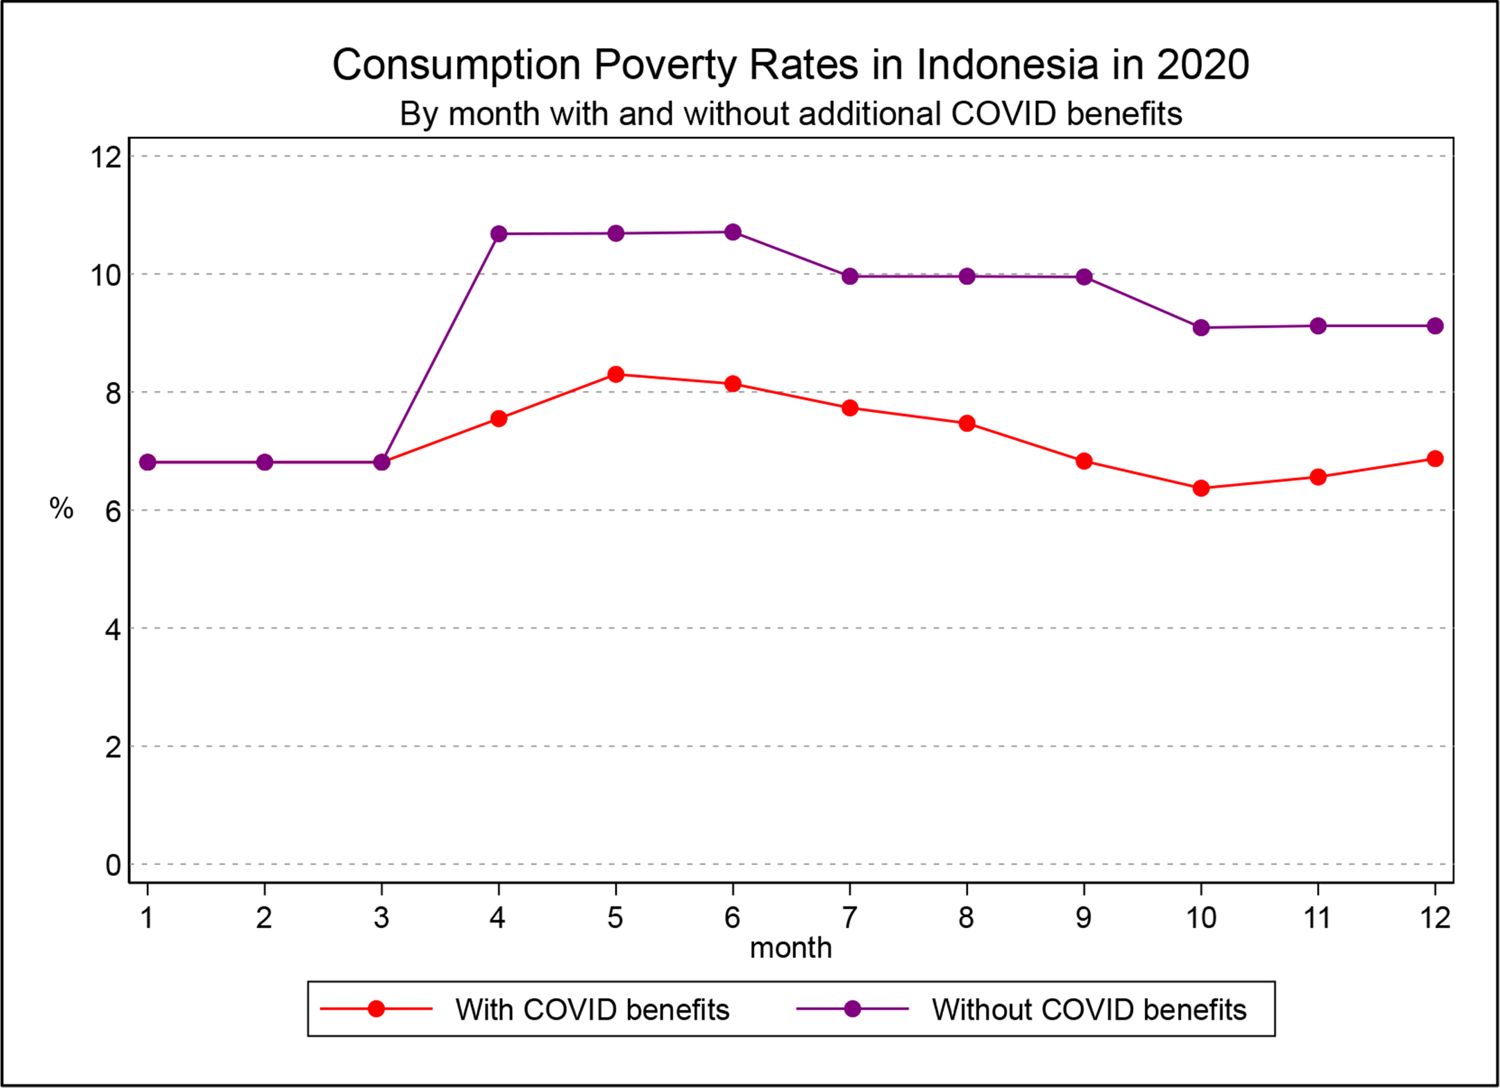
In order to quantify the impact of the additional benefits that were introduced to mitigate the impact of the pandemic, scenarios were modelled in INDOMOD with the new benefits switched off but the original benefits retained. Figure 9 shows the overall poverty rates for each month in 2020, for scenarios without the additional COVID benefits (shown in purple), and with the additional COVID benefits (shown in red, and summarised in Section 4 and Annex 3).
Poverty in Indonesia by month in 2020 – with and without additional COVID benefits. Source: Authors’ analysis using INDOMOD V2.1.
Poverty would have risen to higher levels and would have remained higher than in the first quarter thereafter, without the introduction of the additional support. The new or augmented benefits therefore played a vital role in protecting people from the economic shock of the pandemic in 2020.
To supplement Figure 8, Table 4 shows how poverty changed between February, May, August and November 2020 (the mid-points of the four quarters), for a hypothetical situation where the benefit rules that existed in February 2020 continued throughout the year. Applying the February tax-benefit rules to all four quarters, poverty would have increased overall from 6.8 percent in February to a high of 10.7 percent in May 2020, falling to 9.1 percent in November 2020 (as seen in the purple line in Figure 9). The subgroups that would have been worst affected in May without the additional benefits comprise households containing one or more older people, and households containing one or more children: for these subgroups, poverty would have risen in May 2020 to 14.3 percent and 12.0 percent respectively.
Consumption-based poverty in Indonesia in February, May, August and November 2020 – without the extra COVID benefits
| February 2020 BaselineA | May 2020B | Difference to baseline(B-A) | August2020C | Difference to baseline(C-A) | November 2020D | Difference to baseline(D-A) | |
|---|---|---|---|---|---|---|---|
| Share of poor population, in % | |||||||
| All | 6.81 | 10.69 | 3.88 | 9.96 | 3.15 | 9.12 | 2.31 |
| Poor households out of ... | |||||||
| ... male headed households | 6.70 | 10.68 | 3.98 | 9.92 | 3.22 | 9.07 | 2.37 |
| ... female headed households | 7.67 | 10.79 | 3.12 | 10.24 | 2.56 | 9.51 | 1.84 |
| ... households with children | 7.59 | 11.99 | 4.40 | 11.15 | 3.56 | 10.20 | 2.60 |
| ... households with older persons | 10.57 | 14.25 | 3.68 | 13.52 | 2.95 | 12.75 | 2.18 |
| Poverty gap (average normalised poverty gap, FGT(1)) | 0.89 | 2.07 | 1.18 | 1.86 | 0.97 | 1.56 | 0.67 |
| All | |||||||
| Poor households out of ... | |||||||
| ... male headed households | 0.88 | 2.08 | 1.21 | 1.87 | 0.99 | 1.57 | 0.69 |
| ... female headed households | 1.02 | 1.98 | 0.96 | 1.79 | 0.77 | 1.53 | 0.51 |
| ... households with children | 1.00 | 2.34 | 1.34 | 2.10 | 1.11 | 1.76 | 0.76 |
| ... households with older persons | 1.39 | 2.54 | 1.15 | 2.36 | 0.97 | 2.07 | 0.68 |
| Gini (household income) | 0.3723 | 0.3863 | 0.0139 | 0.3844 | 0.0121 | 0.3808 | 0.0085 |
| P80/P20 | 2.83 | 2.96 | 0.13 | 2.94 | 0.11 | 2.91 | 0.08 |
-
Notes: The household subgroups are not mutually exclusive.
-
Source: Authors’ analysis using INDOMOD V2.1.
The analysis so far has examined the overall impact of the COVID policies and shown the extent to which they mitigated the impact of the pandemic. In order to explore the role of different types of COVID policies, they were grouped into four separate categories: increases to existing benefits, new cash support, new food assistance, and new work-related benefits. Analysis was undertaken to explore the role of these four categories at the mid-points of quarters 2-4 (i.e. May, August and November 2020) – see Table 5. This reveals that the increases to existing benefits made the greatest contribution to poverty reduction in May (44 per cent), followed by cash support (33 per cent). However, in August and November, work-related benefits made the greatest contribution to poverty reduction (51 per cent and 56 per cent respectively). This demonstrates that the policy scene underwent considerable changes during 2020, not just between the period of the first quarter (pre-pandemic) and the rest of the year, but also between quarter 2 and quarter 3 in terms of the augmented support for people of working age.
Contribution of COVID benefits to poverty reduction
| May% | August% | November% | |
|---|---|---|---|
| Increases to existing benefits | 43.5 | 43.5 | 35.8 |
| Cash support | 33.0 | 5.0 | 7.1 |
| Food assistance | 7.5 | 0.5 | 1.3 |
| Work-related benefits | 16.0 | 51.0 | 55.8 |
| Total | 100 | 100 | 100 |
-
Notes: ‘Increases to existing benefits’: PKH and BPNT; ‘Cash support’: cash transfer for non-Jabodetabek, NB. Village Fund cash transfer was applied in April only; ‘Food assistance’: basic food assistance for Jabodetabek; ‘Work-related benefits’: wage subsidy, pre-employment cards. See Annex 3 for more details about when each policy was introduced.
-
Source: Authors’ analysis using INDOMOD V2.1.
8. Conclusion and Discussion
The COVID-19 pandemic is ongoing, and there is great uncertainty about how it will impact on different countries over the next few years. However, the results presented in this paper show that in 2020, Indonesia took swift and decisive action to protect its citizens from both the economic shock of the pandemic and the measures to contain the virus.
The analysis shows that consumption fell across the deciles in quarters 2, 3 and 4 when compared with quarter 1 of 2020 (Figure 6). In absolute terms, the declines were greater for the wealthier deciles (Figure 7). However, in relative terms, the declines were broadly similar across the distribution (Figure 8), though slightly more pronounced for deciles 2-9 than for the poorest and wealthiest deciles.
Prior to the pandemic, around 6.8 percent of people were below the poverty line. Without the introduction of the COVID-19 policies that were simulated in INDOMOD, poverty would have risen to a high in May of 10.7 percent. However, due to the introduction of the COVID-19 policies, our estimates suggest that poverty rose only to a high of 8.3 percent in May, falling by the end of the year to 6.9 percent (Figure 9).
The poverty estimates for 2020 in this paper are lower than those published by BPS for March and September 2020: the official poverty rate in March 2020 was 9.78 percent (Badan Pusat Statistik (BPS), 2020c), and 10.19 percent in September 2020 (Badan Pusat Statistik (BPS), 2020d). In contrast, the simulated results presented in this paper yielded a poverty rate of 6.81 percent for March and 6.83 percent for September 2020 (with the peak occurring in May at 8.30 percent).
There will be several reasons for the discrepancy. First, the official poverty rates were generated using the SUSENAS datasets for March and September 2020, whereas the analysis presented here was generated using a modified version of the SUSENAS 2019 dataset: the analysis was undertaken ‘live’, in tandem with the unfolding of the pandemic and the SUSENAS 2020 datasets were not available at the time. We estimated the impact of the pandemic and associated lockdown on people’s jobs and earnings, using published economic growth data for quarters 2 and 3, and for quarter 4 the impact of the shock was modelled using open source mobility data. Second, the shock was applied to the SUSENAS 2019 dataset by sub-group (sector and province) but there will of course have been variations within each sub-group that are not taken into account. Third, we do not estimate the impact of additional shocks (such as illness or changes in material needs or expenditure patterns) which would have been captured in SUSENAS 2020. And fourth (though this is a counter point) we do not estimate the impact of the unsimulated policies such as the electricity subsidy. Lastly, we simulate the ‘de jure’ tax and benefit rules, rather than the ‘de facto’ application: by assigning benefits to the poorest households within SUSENAS, the benefits will be more precisely assigned to the poorest individuals in our simulations than could occur in practice where eligibility is often determined using the Basis Data Terpadu (Unified Database).
Nevertheless, for the policies that have been modelled, it is clear that they served to protect millions of people from a greater financial shock than would otherwise have been the case. Based on our results, for households containing one or more children, poverty would have risen to a high of 11.99 percent in May 2020 without the COVID-19 policies, but instead rose to 9.49 percent. Also, for households containing one or more elderly people, poverty would have risen to a high of 14.25 percent without the COVID-19 policies, but instead rose to 11.40 percent.
The Government of Indonesia is continuing to apply countercyclical measures in 2021 to handle the COVID-19 pandemic and to mitigate the economic downturn through its 2021 State Budget. The Government’s 2021 fiscal policy direction is intended to be expansive yet consolidative, with the deficit level at 5.7 percent of GDP, and is expected to gradually return to its ceiling of 3 percent of GDP in 2023. The State Budget has been designed to support the return of Indonesia’s economy to its medium-term growth trajectory while anticipating global economic recovery uncertainty.
Understanding the vital role of National Economic Recovery (Pemulihan Ekonomi Nasional/PEN) programmes in preserving the economy and combatting the pandemic, the Government has committed to strengthen this program in 2021. The allocation for PEN programmes is IDR 699.43 trillion to finance health measures and the social safety net, and to support the economic recovery from both the supply and demand-side. That amount is 21 percent higher than the PEN realization in 2020. The additional budget is intended to finance the vaccination program, protect household’s consumption, and create jobs. In terms of supporting household consumption in 2021, especially for poor and vulnerable groups, the Government will maintain PKH for 10 million families, BPNT/Kartu Sembako for 18.8 million families, cash assistance (for people not in receipt of PKH and Kartu Sembako) for 10 million families, the Village Fund cash transfer for 8 million families not in receipt of other programmes, pre-employment cards for 5.6 million unemployed people, a monthly electricity subsidy, and an internet quota subsidy for students and teachers.
These initiatives demonstrate the strong commitment of the Government to protect people from the impact of the pandemic and associated reductions in earnings using adaptive social protection. It will be important to continue to monitor the impact of these policies as the pandemic unfolds, ideally using more up-to-date SUSENAS data and incorporating policy changes beyond 2020. Additionally, an important area for further research is to examine the extent to which different groups were adequately protected from this type of crisis by the standard and emergency measures, and what steps are needed to extend and strengthen such support going forwards.
Footnotes
1.
INDOMOD does not simulate corporate income tax as the underpinning dataset is a household survey. Other taxes that are not simulated include the luxury goods sales tax, excise duty, real estate tax, stamp duty, transfer taxes for land, buildings, and shares; environmental taxes, fuel tax, vehicle tax (administered at regional level), and hotel tax (administered at district level).
2.
The Unified Database is an electronic database of the households in Indonesia with the lowest welfare status. It is used for targeting social assistance programmes. See http://tnp2kgoid/data-and-indicator/unified-database.
3.
Although it is possible to dampen oversimulated benefits on-model, it is not possible to augment undersimulated benefits and so the on-model benefits were left unadjusted at these levels. External validation data for PKH could not be obtained.
4.
See also Annex 1 for an account of how the poorest households were identified in the input data for three of the new COVID benefits.
5.
In addition, there was a target of 2 million honorary teachers under the Ministry of Education, and 620,000 honorary teachers under the Ministry of Religious Affairs but these were not simulated in INDOMOD.
6.
The policies not modelled include the food assistance expansion/rice subsidy, a monthly electricity subsidy, cash transfers to micro-level businesses, and subsidies, credit guarantees and credit incentives for MSMEs.
7.
In the case where no meaningful and significant relationship was found for certain sectors, we assume that the elasticity is zero and use the previous economic growth to carry forward for the next period (we use the lags of growth instead).
8.
See the final part of this section for a discussion of other assumptions made.
9.
Unless otherwise stated, the quarterly numbers/amounts in this and subsequent figures are obtained by averaging the key variables for the three months in that quarter.
10.
See Annex 7 (1) (2) for comparable results using disposable income.
11.
Although some policies are targeted at percentage or numbers of families, in INDOMOD the household unit had to be used rather than the family unit.
12.
Annex 1 Further details about the method for identifying poor families in INDOMOD’s input dataset
Standardising the expenditure data
As the cost of living is not the same in all parts of Indonesia, the country has a total of 67 poverty lines which vary by province and urban/rural classification. There are 33 urban poverty lines and 33 rural poverty lines for each of the provinces other than Jakarta, and one urban poverty line for Jakarta. The variation in poverty lines reflects the variation in prices throughout the country, and so the poverty line variation was accordingly used to adjust per capita expenditure in INDOMOD’s input dataset. A multiplier was used to convert all expenditure data to Jakarta prices, which was achieved simply by dividing the Jakarta poverty line for 2019 by the poverty lines of all other provinces (both the urban and rural poverty lines were used).
Identifying the poorest X% of households and the poorest number of households11
Having standardised the expenditure data, two new variables were created in INDOMOD’s input dataset. These were used in INDOMOD as proxies for the household occurring within Indonesia’s Unified Database which is an electronic database of the households in Indonesia with the lowest welfare status and is used for targeting social assistance programmes.12 The first new variable, xpe, gives the percentile of the national standardised expenditure distribution for each household (assigned to the head of household only) in the input dataset. This allows the relevant percentage of the weighted per capita expenditure to be used as the eligibility criterion within the model, depending on the policy (e.g. the bottom 25% for PIP).
For the PKH and BPNT policies, the poorest 9.2 million households and the poorest 15.6 million households respectively are eligible, and therefore a second new variable was constructed to give each household (assigned to the head of household only) their position in the national standardised expenditure distribution. The variable xcu is simply a cumulative number of households ordered from low to high by weighted per capita expenditure. The households positioned in the bottom 9.2 or 15.6 million (or any other threshold desired) can be selected as eligible within the model.
Additional xcu variables were constructed for three of the COVID-19 benefits (summarised in Annex 3): Basic food assistance for Jabodetabek, Cash transfer for non-Jabodetabek non-rural areas, and Village Fund cash transfer for non-Jabodetabek rural areas. For each of these policies, the rules state that the next x million families not in receipt of PKH or BPNT would be eligible for the COVID benefit. Prior to April 2020, when these benefits commenced, the poorest 9.2 million families (households in INDOMOD) received PKH and the poorest 15.6 million families/households received BPNT/Sembako, meaning that 9.2 million households in INDOMOD will receive both PKH and BPNT/Sembako, and an extra 6.4 million households will receive BPNT only. Therefore, any family/household in the poorest 15.6 million would not be eligible for the COVID benefits within INDOMOD as they would be receiving either both PKH and BPNT or just BPNT. In order to calculate the next x million families/households eligible for the COVID benefits, a new ranking of households starting at 15.6 million was calculated within each area (Jabodetabek, non-Bodetabek urban, non-Bodetabek rural) called xcujk, xcunu, xcunr respectively. Using the relevant xcu variable it was then possible to select, on model, the poorest x million not in receipt of PKH or BPNT in a particular area targeted by the benefit.
Annex 2 External validation data for pre-crisis period, 2019
Tax and benefit instruments simulated in INDOMOD: Number of recipients/payers
| Tax–benefit policy | INDOMOD 2019A | External 2019B | Ratio 2019A/B |
|---|---|---|---|
| Income Tax (Pajak Penghasilan Pribadi, PPP) | 16.5M | 12.6M (a) | 131% |
| Government subsidised National Health Insurance (Jaminan Kesehatan Nasional Penerima Bantuan Iuran, JKN-PBI) | 121.7M individuals | 96.8M individuals (b) | 126% |
| National Health Insurance (Jaminan Kesehatan Nasional, JKN) | 91.5M individuals | 127.4M individuals (c) | 72% |
| Social Security Contribution (BPJS Ketenagakerjaan) | 48.1M wage recipient workers; 52.9M if include government workers for JKK and JKM | 30.6M active members (d) | 173% if include government workers for JKK and JKM |
| Social Security Contribution for civil servants (Iuran Wajib Pegawai, IWP) | 4.8M individuals | 4.2M civil servants (e) | 114% |
| Family Hope Program (Program Keluarga Harapan, PKH) | 8.1M households | 10.0M families (f) | 81% |
| Smart Indonesia Program (Program Indonesia Pintar, PIP) | 17.7M children | 20.1M children (g) | 88% |
| Child Social Welfare Program ( Program Kesejahteraan Sosial Anak , PKSA) | 0.41M children | Not available. | / |
| Electronic food voucher (Bantuan Pangan Non Tunai, BPNT) | 15.6M households | 15.6M families(BPNT) (g) | 100% |
| VAT (Pajak Pertambahan Nilai, PPN) | N/A | N/A | N/A |
-
Source: Column A: INDOMOD Version 2.1. Column B: (a) Provided by Ministry of Finance for 2019; (b) https://health.detik.com/berita-detikhealth/d-4377463/kado-tahun-baru-kuota-pbi-jk-bpjs-kesehatan-tambah And https://www.beritasatu.com/timboel-siregar/opini/6029/iuran-jkn-rakyat-miskin-ditanggung-apbn; (c) https://bpjs-kesehatan.go.id/bpjs/dmdocuments/0f13488b25e3985aed51f444d6607ec7.pdf; (d) https://www.bpjsketenagakerjaan.go.id//assets/uploads/laporan_tahunan/BPJS19_LO23_FS.pdf; 30.6M contributors out of 51M workers (e) https://www.bkn.go.id/wp-content/uploads/2020/04/e-Book-Statistik-Pegawai-Negeri-Sipil-Desember-2019.pdf; (f) https://kemsos.go.id/program-keluarga-harapan-pkh; (g) PKAPBN; (h) UNICEF.
Tax and benefit instruments simulated in INDOMOD: Annual amounts IDR
| Tax–benefit policy | INDOMOD 2019A | External 2019B | Ratio 2019A/B |
|---|---|---|---|
| Income Tax (Pajak Penghasilan Pribadi, PPP) | 114.6T | 148.9T (a) | 77% |
| Government subsidised National Health Insurance (Jaminan Kesehatan Nasional Penerima Bantuan Iuran, JKN-PBI) | 33.6T | 26.7T (b) | 126% |
| National Health Insurance (Jaminan Kesehatan Nasional, JKN) | 20.9T (employee)And 64.9T (employer) | 117.75T (c) | 73% |
| Social Security Contribution (BPJS Ketenagakerjaan) | 59.9T (employee)And 113.6T (employer) | 73.4T (d) | 236% |
| Social Security Contribution for civil servants (Iuran Wajib Pegawai, IWP) | 21.6T | 7.4T (e) | 292% |
| Family Hope Program (Program Keluarga Harapan, PKH) | 39.2T | 34.4T (f) | 114% |
| Smart Indonesia Program (Program Indonesia Pintar, PIP) | 10.6T | 11.0T (f) | 96% |
| BEN: Child Social Welfare Program (Program Kesejahteraan Sosial Anak, PKSA) | 0.41T | Not available | / |
| Electronic food voucher (Bantuan Pangan Non Tunai, BPNT) | 20.6T | 28.1T (h) | 73% (f) |
| VAT (Pajak Pertambahan Nilai, PPN) | 135.9T | 347.3 T (a) | 39% |
-
Source: Column A: INDOMOD version 2.1. Column B: (a) Laporan Keuangan Pemerintah Pusat (LKPP) The Central Government Financial Report, Provided by Ministry of Finance for 2019; (b) https://www.beritasatu.com/timboel-siregar/opini/6029/iuran-jkn-rakyat-miskin-ditanggung-apbn; (c) https://bpjs-kesehatan.go.id/bpjs/dmdocuments/0f13488b25e3985aed51f444d6607ec7.pdf; (d) https://www.bpjsketenagakerjaan.go.id/assets/uploads/laporan_keuangan/Laporan_Keuangan_Audit_2019_-_BPJS_Ketenagakerjaan.pdf https://www.bpjsketenagakerjaan.go.id//assets/uploads/laporan_tahunan/BPJS19_LO23_FS.pdf; (e) https://www.kemenkeu.go.id/media/15858/lkpp-2019.pdf; (f) PKAPBN; (g) UNICEF; (h) https://money.kompas.com/read/2019/08/17/060200826/2020-pemerintah-anggarkan-bantuan-pangan-non-tunai-rp-28-1-triliun-
Annex 3 Summary of changes made to Indonesia’s benefit policies in response to the COVID-19 pandemic in 2020
Changes to benefit policies in 2020
| Policy | Amount of benefit (IDR) and periodicity of distribution | Relevant months in 2020 | Number of families/individuals targeted | Notes |
|---|---|---|---|---|
| PKH | 12(Jan-Dec) | 9.2 million families (Jan-Mar); increased to 10 million families (Apr-Dec) | The distribution of PKH, which was previously per 3 months, became per month from Apr-Dec 2020.Access part of PKH not simulated as it was not possible to obtain the necessary sub-district information for this part of PKH. | |
| Regular | 550,000 per year | |||
| Access | 1,000,000 per year | |||
| 1. Pregnant mother | 3,750,000 per year | |||
| 2. Baby/toddler | 3,750,000 per year | |||
| 3. Child in elementary school | 1,125,000 per year | |||
| 4. Child in junior high school | 1,875,000 per year | |||
| 5. Child in senior high school | 2,500,000 per year | |||
| 6. Disability | 3,000,000 per year | |||
| 7. Elderly | 3,000,000 per year | |||
| BPNT / Sembako | 150,000 per month (Jan-Mar); 200,000 per month (Apr-Dec) | 12(Jan-Dec) | 15.6 million families (Jan-Mar); increased to 19.4 million families (Apr-Dec) | |
| Basic food assistance for Jabodetabek | Apr-Jun 600,000 per month; Jul-Dec 300,000 per month | 9(Apr-Dec) | 2.2 million families | If not receiving PKH or BPNT |
| Cash transfer non-Jabodetabek | Apr-Jun 600,000 per month; Jul-Dec 300,000 per month | 9(Apr-Dec) | 9.2 million families in non-Jabodetabek non-rural areas | If not receiving PKH or BPNT |
| Village fund cash transfer | Apr-Jun 600,000 per month; Jul-Dec 300,000 per month | 9(Apr-Dec) | 8 million families in non-Jabodetabek rural areas | If not receiving PKH or BPNT |
| Cash support expansion | 500,000 per household, one off payment | N/A | 9 million families | If receiving BPNT but not PKH |
| Food assistance expansion | Aug-Oct, 15 kgs of rice per month | 3(Aug-Oct) | 9 million families | If receiving PKH but not BPNT.Rice price assumption=Rp12000/kgNot simulated in INDOMOD |
| Wage subsidy | Aug-Dec, IDR 2.4 Million, payable as two payments of 1.2 Million | 5(Aug-Dec) | 12.4 million employees | For individuals with employment income less than IDR 5 million per month, and registered as a BPJSTK member (in INDOMOD non-government wage recipient workers are used as proxy) |
| Pre-employment cards | Apr-Dec, payable over four months at 600,000 per month plus a final incentive payment of 150,000; averaged on-model to 637,500 per month for four months. | 9(Apr-Dec) | 5.6 million unemployed | For individuals who are unemployed and not receiving any social assistance. The training and survey allowances (IDR 1 Million per person) are not modelled in INDOMOD. |
-
Notes: In INDOMOD V2.1 households are used as the unit of analysis rather than families for the policies that are targeted at families. This is because in SUSENAS it is not possible to identify multiple families within a household. Districts eligible for Jabodetabek are treated as those within DKI Jakarta, Jawa Barat and Banten Provinces, i.e. Kepulauan Seribu, Jakarta Selatan, Jakarta Timur, Jakarta Pusat, Jakarta Barat, Jakarta Utara, Kabupaten Bogor, Kabupaten Bekasi, Kota Bogor, Kota Bekasi, Kota Depok, Kabupaten Tangerang, Kota Tangerang, and Kota Tangerang Selatan.
Annex 4 Sector codes
Nine sector categories were used (Badan Pusat Statistik (BPS), 2020). Appendix 4—table 1 shows how the 26 business sector codes in SUSENAS were aggregated to BPS’ nine higher level codes with one modification whereby communication and transport were split for the purposes of the analysis presented in this paper as communication and transport were very differently affected during the pandemic.
Sector codes
| Modified BPS sector categories | SUSENAS business sector categories |
|---|---|
| 1.Agriculture, livestock, forestry and fisheries | 1.Rice crop and palawija agriculture2.Horticulture3.Plantation4.Fishery5.Animal husbandry6.Forestry and other agriculture |
| 2.Mining and quarrying | 7.Mining and excavation |
| 3.Processing Industry | 8.Processing industry |
| 4.Electricity, gas and clean water | 9.Electricity, gas, steam/hot water, and cold air procurement10.Water management, waste water management, waste management and recycling, and remediation activities |
| 5.Building | 11.Construction |
| 6.Trade, hotel and restaurant | 12.Wholesale and retail trade, car and motorcycle maintenance14.Accommodation and food and beverage services |
| 7.Transport | 13.Shipment and storage |
| 8.Communication | 15.Information and communication |
| 9.Finance, rental and business services | 16.Financial and insurance activities17.Real estate18.Professional, scientific, and technical activities |
| 10.Services | 19.Rental and lease without option rights activities, labor force, travel agent, and other business support20.Government administration, defense, mandatory social security21.Education22.Human health and social activities23.Art, entertainment and recreational24.Other service activities25.Household activities as employer26.International agency activities and other international extra agencies |
Annex 5 Regression results for estimating elasticity of community mobility to economic growth
Regression results from elasticity estimation
| Workplace | Transit | Retail | Workplace | Transit | Retail | |
|---|---|---|---|---|---|---|
| Agriculture, Forestry and Fishery | Mining and Quarrying | |||||
| Mobility | -0.236**(0.0937) | -0.0660(0.0732) | -0.0451(0.0695) | -0.105(0.233) | -0.0520(0.142) | -0.0534(0.239) |
| Quarter 3 (1=yes, 0=otherwise) | 1.610(1.137) | 0.782(1.730) | 0.318(1.500) | -3.251(3.756) | -3.182(4.071) | -3.229(5.065) |
| Bali (1=Yes, 0=otherwise) | -7.970***(1.825) | -5.695**(2.294) | -4.631***(1.429) | 2.031(4.400) | 2.407(4.445) | 2.938(4.678) |
| Papua (1=Yes, 0=otherwise) | -0.901(0.744) | -1.108(0.819) | -1.734*(0.946) | 19.87**(9.191) | 19.88**(9.093) | 19.26**(9.251) |
| Constant | -7.917***(2.184) | -5.580(3.713) | -3.509*(2.097) | -6.759(6.869) | -6.915(8.215) | -5.837(7.907) |
| Observations | 68 | 68 | 68 | 68 | 68 | 68 |
| R-squared | 0.130 | 0.056 | 0.043 | 0.120 | 0.120 | 0.119 |
| Manufacturing Industry | Electricity, Gas & Water Supply | |||||
| Mobility | 0.647**(0.265) | 0.292(0.295) | 0.0161(0.215) | 0.702***(0.153) | 0.279***(0.0946) | 0.219(0.179) |
| Quarter 3 (1=yes, 0=otherwise) | -4.946(3.816) | -4.805(4.342) | 0.511(6.380) | -3.898*(2.219) | -3.023(2.672) | -1.565(3.946) |
| Bali (1=Yes, 0=otherwise) | 6.527(4.399) | 3.378(7.048) | -4.477(5.198) | -3.950(3.134) | -8.412**(3.465) | -12.42***(4.127) |
| Papua (1=Yes, 0=otherwise) | -5.241**(2.454) | -5.193(3.413) | -3.708(3.077) | -5.202***(0.890) | -4.973***(0.999) | -2.128(1.768) |
| Constant | 9.912(7.686) | 9.325(16.06) | -5.504(6.684) | 13.39***(3.927) | 10.78**(5.076) | 2.906(5.566) |
| Observations | 68 | 68 | 68 | 68 | 68 | 68 |
| R-squared | 0.054 | 0.032 | 0.006 | 0.352 | 0.236 | 0.188 |
| Construction | Trade, Hotel & Restaurants | |||||
| Mobility | 0.170(0.232) | 0.290**(0.132) | 0.305(0.194) | 0.363***(0.120) | 0.286**(0.114) | 0.312***(0.0922) |
| Quarter 3 (1=yes, 0=otherwise) | -1.600(2.946) | -5.644*(3.077) | -5.513(4.209) | -0.372(1.589) | -2.631(2.462) | -2.695(2.244) |
| Bali (1=Yes, 0=otherwise) | 3.248(3.731) | 8.347**(3.501) | 5.522*(3.008) | -11.30***(2.562) | -9.671***(3.585) | -12.27***(2.199) |
| Papua (1=Yes, 0=otherwise) | 7.182**(3.222) | 6.195(3.916) | 9.688***(3.559) | 1.630**(0.738) | 1.085(0.911) | 4.610***(1.062) |
| Constant | -7.273(6.423) | 3.740(7.308) | -2.023(6.775) | -7.385**(3.042) | -1.318(5.833) | -6.669**(2.977) |
| Observations | 68 | 68 | 68 | 68 | 68 | 68 |
| R-squared | 0.035 | 0.107 | 0.088 | 0.350 | 0.401 | 0.378 |
| Transportation | Communication | |||||
| Mobility | 0.232(0.274) | 0.727***(0.169) | 0.0588(0.250) | -0.221(0.185) | -0.141(0.0975) | -0.141(0.146) |
| Quarter 3 (1=yes, 0=otherwise) | 8.663*(4.395) | -3.211(4.460) | 9.681(5.961) | 1.630(2.238) | 2.363(2.394) | 2.173(3.097) |
| Bali (1=Yes, 0=otherwise) | -11.79*(6.118) | 4.387(5.165) | -14.83**(5.818) | -8.837**(3.614) | -8.897***(2.568) | -7.404**(2.927) |
| Papua (1=Yes, 0=otherwise) | -25.06***(2.496) | -27.96***(3.957) | -24.13***(2.534) | -3.526**(1.666) | -3.351**(1.588) | -4.997**(2.020) |
| Constant | -29.32***(7.763) | 3.101(9.317) | -33.21***(8.979) | -2.436(4.431) | -4.374(5.532) | -1.357(4.419) |
| Observations | 68 | 68 | 68 | 68 | 68 | 68 |
| R-squared | 0.228 | 0.367 | 0.223 | 0.057 | 0.059 | 0.050 |
| Finance, Real Estate and Business | Services | |||||
| Mobility | 0.319***(0.0741) | 0.126**(0.0545) | 0.284*(0.163) | 0.0866(0.113) | 0.164**(0.0620) | 0.112(0.0961) |
| Quarter 3 (1=yes, 0=otherwise) | -3.523*(2.081) | -3.097(2.397) | -5.735(4.281) | 1.542(1.367) | -0.838(1.580) | 0.311(2.242) |
| Bali (1=Yes, 0=otherwise) | 1.976(1.919) | -0.0935(2.055) | 1.282(3.522) | 1.426(2.062) | 4.486**(1.730) | 1.846(1.919) |
| Papua (1=Yes, 0=otherwise) | -4.507***(0.875) | -4.396***(0.975) | -1.819(1.977) | 0.0463(0.837) | -0.535(0.707) | 1.024(1.064) |
| Constant | 3.070(1.864) | 1.807(2.966) | 3.991(5.028) | -6.420**(2.807) | 0.0636(3.377) | -5.074*(3.020) |
| Observations | 68 | 68 | 68 | 68 | 68 | 68 |
| R-squared | 0.068 | 0.039 | 0.092 | 0.066 | 0.135 | 0.083 |
Annex 6 March 2020 baseline using disposable income

Deciles of mean monthly household disposable income in Indonesia, with and without benefits, March 2020. Source: Authors’ analysis using INDOMOD V2.1.
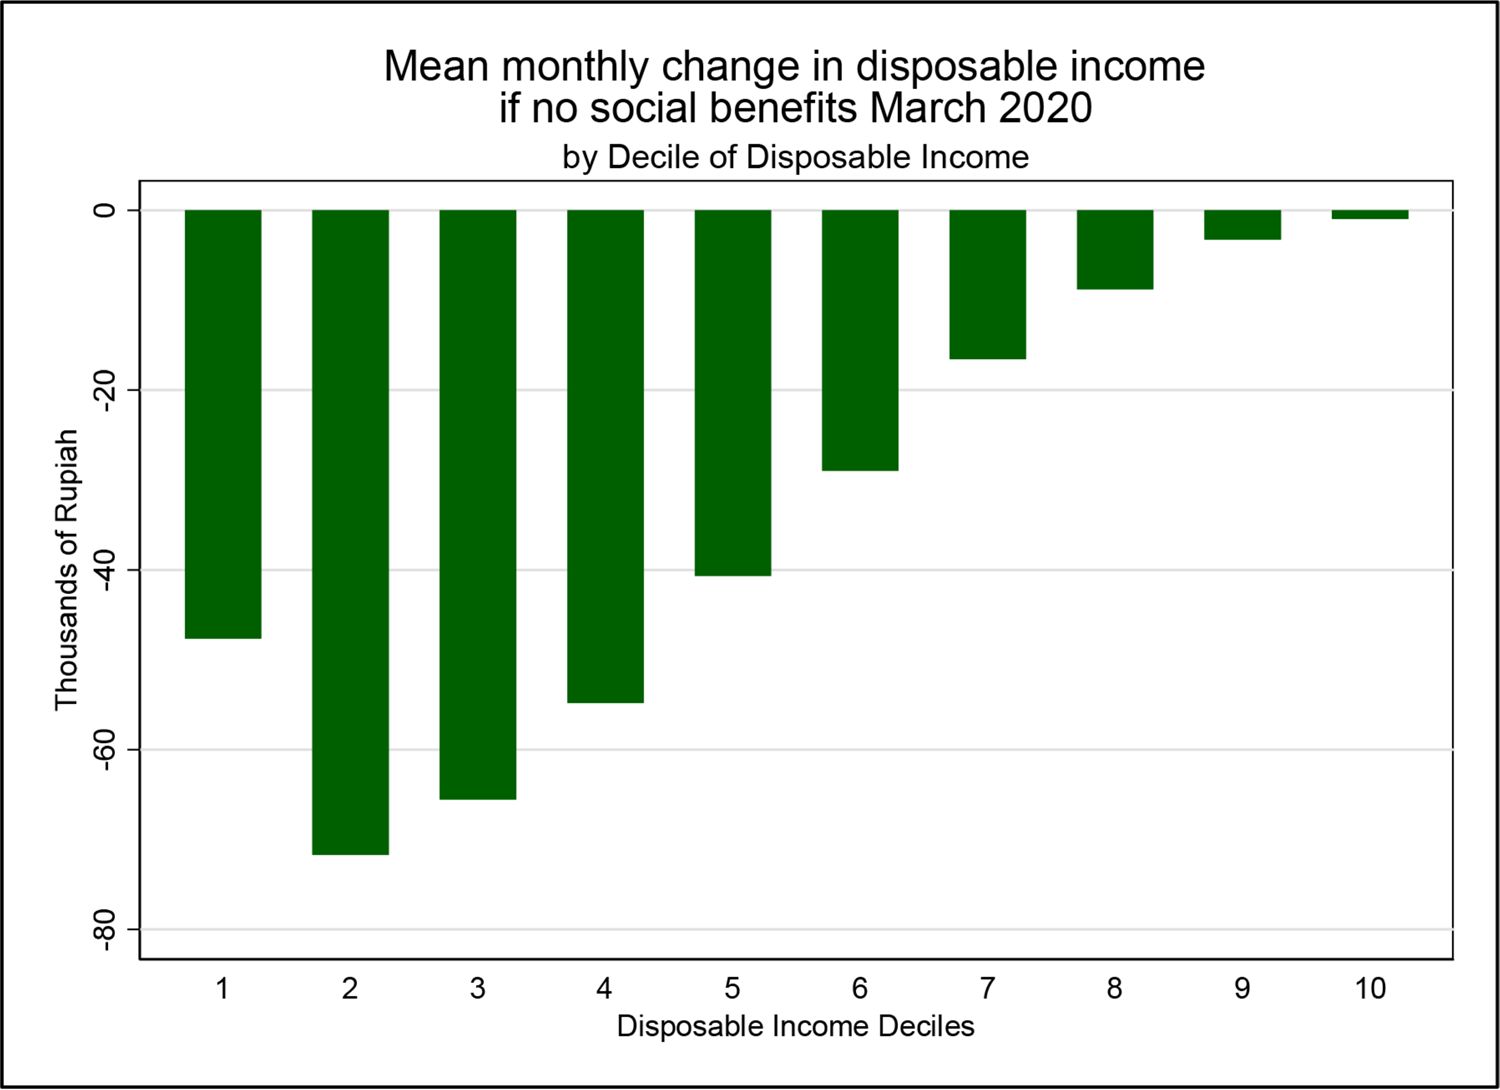
Change in mean monthly household disposable income in Indonesia by decile if there were no benefits, March 2020. Source: Authors’ analysis using INDOMOD V2.1.
Annex 7 Combined impact of COVID-19 and the remedial tax and benefit policies using disposable income

Deciles of mean monthly household disposable income in Indonesia by quarter in 2020. Source: Authors’ analysis using INDOMOD V2.1.
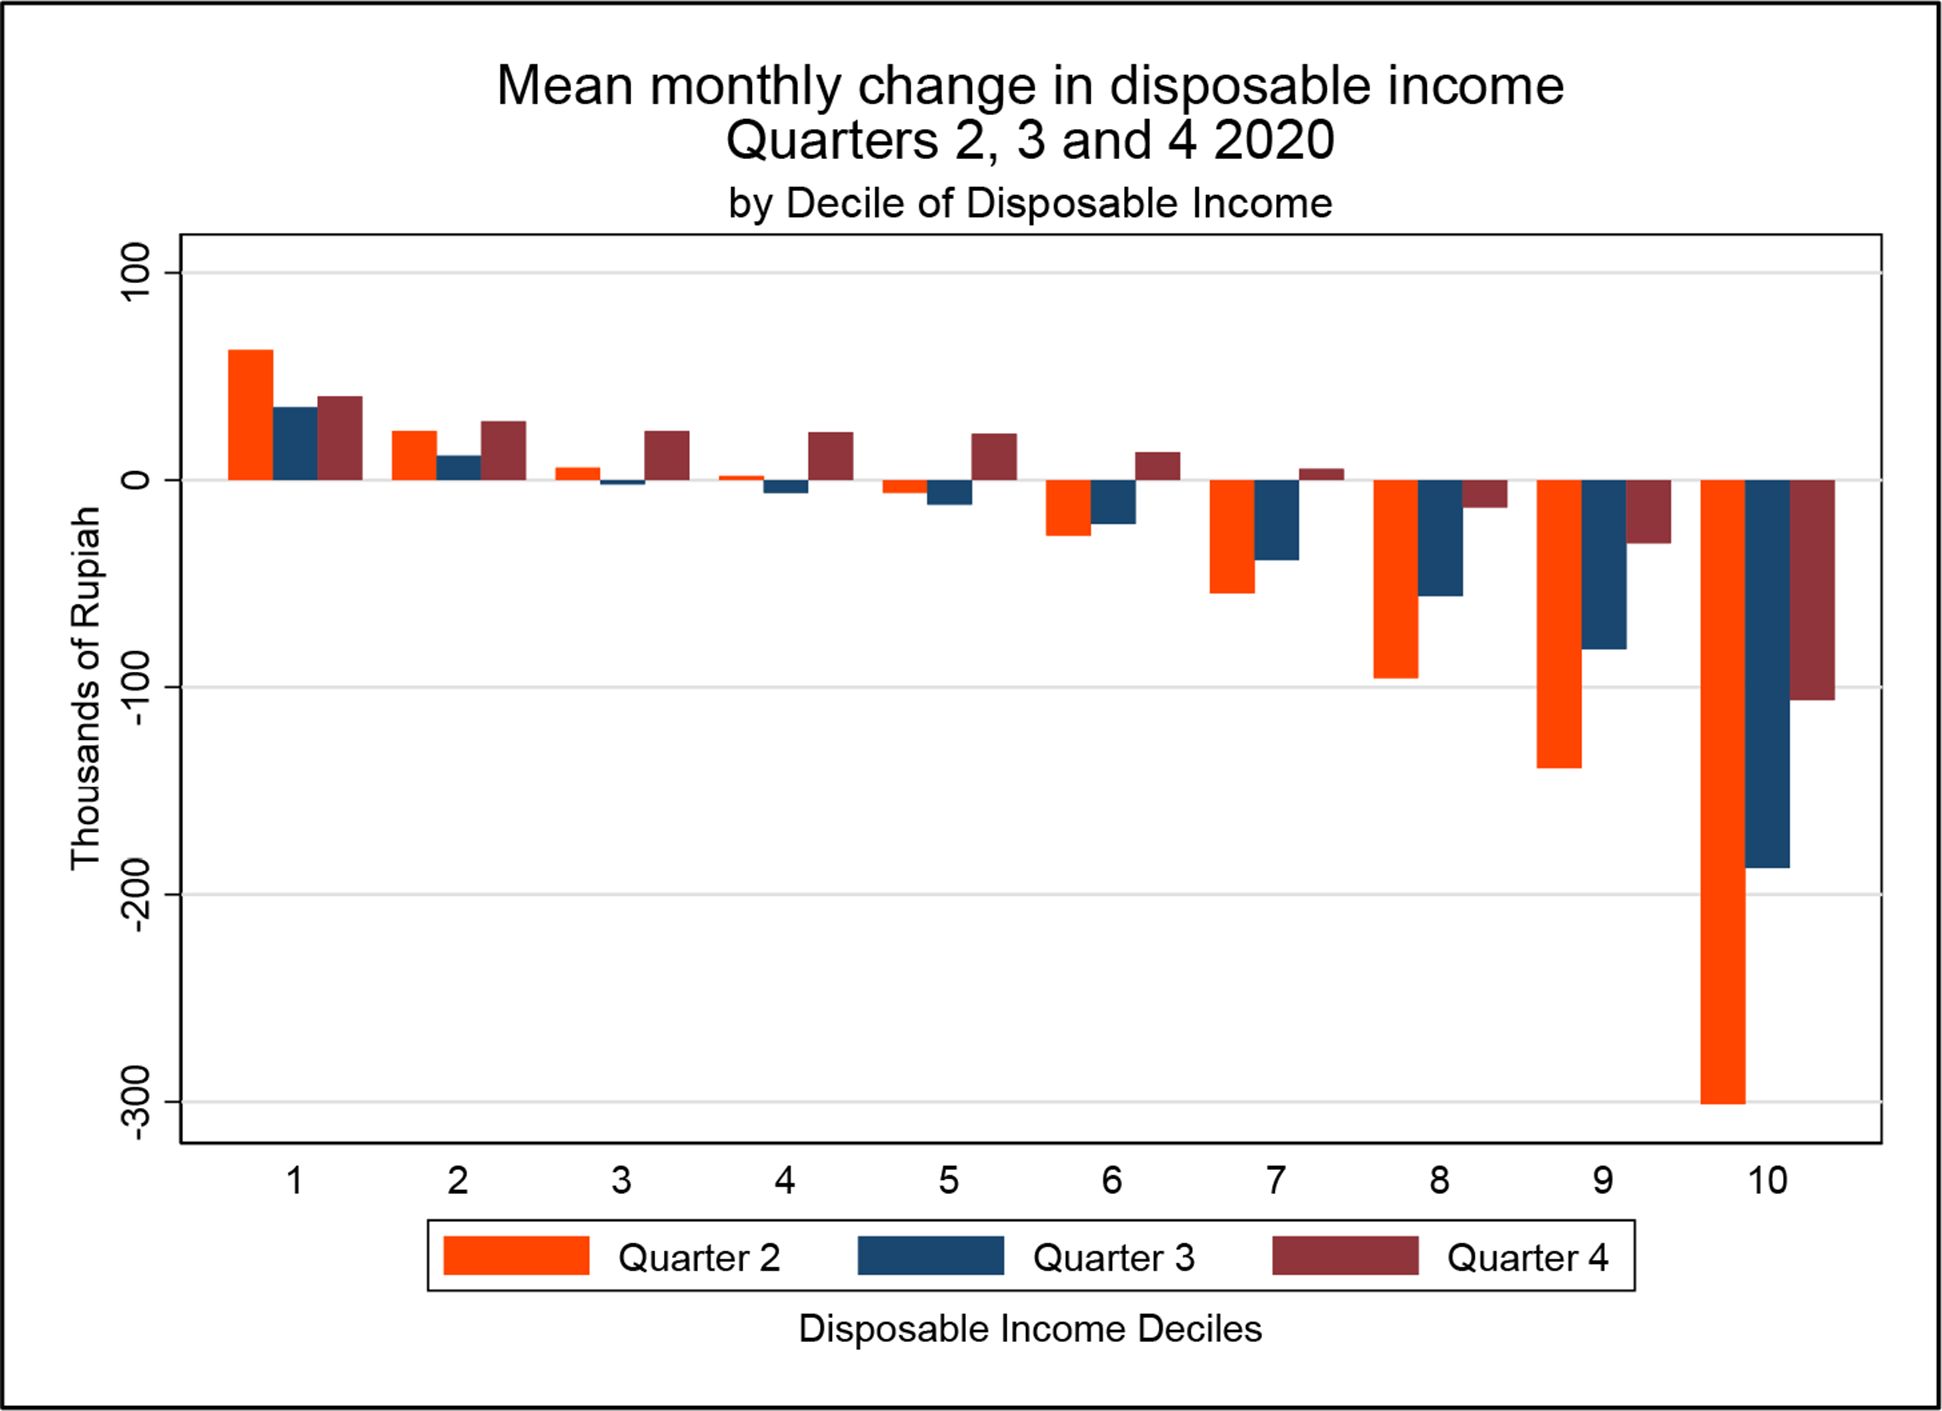

Change in mean monthly household disposable income in Indonesia by quarter in 2020. Source: Authors’ analysis using INDOMOD V2.1.
References
-
1
WIDER Working Paper 2021/148To the rescue? The mitigating role of tax and benefit rescue packages for poverty and inequality in Africa amid the COVID-19 pandemic, WIDER Working Paper 2021/148, Helsinki, UNU-WIDER.
- 2
- 3
- 4
- 5
- 6
- 7
-
8
INDOMOD Country Report: Indonesia – INDOMOD V1.3. Report for UNICEF IndonesiaINDOMOD Country Report: Indonesia – INDOMOD V1.3. Report for UNICEF Indonesia.
-
9
INDOMOD Country Report: Indonesia – INDOMOD V2.0. Report for UNICEF IndonesiaINDOMOD Country Report: Indonesia – INDOMOD V2.0. Report for UNICEF Indonesia.
-
10
The potential costs and distributional effect of Covid-19 related unemployment in IrelandEconomic and Social Research Institute 1.https://doi.org/10.26504/bp202101
-
11
EUROMOD Working Paper EM12/20Did the UK policy response to Covid-19 protect household incomes?, EUROMOD Working Paper EM12/20, Colchester, University of Essex.
-
12
EUROMOD Working Paper EM11/20The Covid-19 Crisis Response Helps the Poor: The Distributional and Budgetary Consequences of the UK Lock- Down, EUROMOD Working Paper EM11/20, Colchester, University of Essex.
-
13
Life under lockdown: Illustrating tradeoffs in South Africa’s response to COVID-19’World Development 137 :105168.
-
14
EUROMOD Working Paper EM 06/20Welfare Resilience in the Immediate Aftermath of the COVID-19 Outbreak in Italy, EUROMOD Working Paper EM 06/20, Colchester, University of Essex.
-
15
A Call to Action for Governments to Expand Children’s Access to Child-Sensitive Social Protection in the Wake of COVID-19A Call to Action for Governments to Expand Children’s Access to Child-Sensitive Social Protection in the Wake of COVID-19.
- 16
-
17
Social Protection in Asia and the Pacific: Inventory of Non-Contributory ProgrammesBrasília: International Policy Centre for Inclusive Growth.
-
18
WIDER Working Paper 4/2021The role of automatic stabilizers and emergency tax-benefit policies during the COVID-19 pandemic in Ecuador, WIDER Working Paper 4/2021, Helsinki, UNU-WIDER.
-
19
The Distributional Impact of Fiscal Policy: Experience from Developing CountriesThe distributional impact of fiscal policy in Indonesia, The Distributional Impact of Fiscal Policy: Experience from Developing Countries, Washington, DC, World Bank.
-
20
WIDER Working Paper 2020/31Structural transformation and inclusive growth: Kuznets’ ‘developer’s dilemma’ in Indonesia, WIDER Working Paper 2020/31, Helsinki, UNU-WIDER, 10.35188/UNU-WIDER/2020/788-0.
-
21
WIDER Technical Note 2021/16Deriving Shocks To Household Consumption Expenditures From The Associated Income Shocks Resulting From Covid-19, WIDER Technical Note 2021/16, Helsinki, UNU-WIDER.
-
22
Policy Research Working Paper No.9247Nowcasting economic activity in times of COVID-19: An approximation from the Google Community Mobility Report, Policy Research Working Paper No.9247, Washington DC, World Bank.
-
23
WIDER Working Paper 2020/77Precarity and the Pandemic: COVID-19 and Poverty Incidence, Intensity, and Severity in Developing Countries, WIDER Working Paper 2020/77, Helsinki, UNU-WIDER.
-
24
Estimating the Impact of COVID-19 on Poverty in IndonesiaBulletin of Indonesian Economic Studies 56 :175–192.https://doi.org/10.1080/00074918.2020.1779390
-
25
EUROMOD: the European Union Tax-Benefit Microsimulation ModelTernational Journal of Microsimulation 6 :4–26.
-
26
The Future of the Social Protection System in Indonesia: Social Protection for AllJakarta: Tim Nasional Percepatan Penanggulangan Kemiskinan (TNP2K).
-
27
Looking back to look ahead: A rights-based approach to social protection in the post-COVID-19 economic recovery. Report of the United Nations Special Rapporteur on extreme poverty and human rightsLooking back to look ahead: A rights-based approach to social protection in the post-COVID-19 economic recovery. Report of the United Nations Special Rapporteur on extreme poverty and human rights.
- 28
-
29
Towards a Comprehensive, Integrated, and Effective Social Assistance System in Indonesia, Indonesia’s Social Assistance Public Expenditure Review Update.Washington DC:The World BankTowards a Comprehensive, Integrated, and Effective Social Assistance System in Indonesia, Indonesia’s Social Assistance Public Expenditure Review Update.Washington DC:The World Bank, http://documents.worldbank.org/curated/en/535721509957076661/pdf/120905-REVISED-PUBLIC-Screen-English-1211-update.pdf.
- 30
-
31
The effect of social protection programs on inequality in IndonesiaReport to Asian Development Bank 1.
-
32
Poverty and Inequality during COVID-19 Pandemic: Early Observations from Indonesia MimeoPoverty and Inequality during COVID-19 Pandemic: Early Observations from Indonesia Mimeo.
Article and author information
Author details
Arief Anshory Yusuf

Funding
No specific funding for this article is reported.
Acknowledgements
The paper is based on analysis that was undertaken as part of the Programme Cooperation Agreement #2018/82/SP/SASPRI between the United Nations Children’s Fund and Southern African Social Policy Research Insights. An earlier version of this paper was published in the CeMPA Working Paper Series https://wwwiseressexacuk/research/publications/working-papers/cempa/cempa2-21.
Publication history
- Version of Record published: August 31, 2021 (version 1)
Copyright
© 2021, Wright et al.
This article is distributed under the terms of the Creative Commons Attribution License, which permits unrestricted use and redistribution provided that the original author and source are credited.