Estimating the Distributional Impacts of the COVID-19 Pandemic and the Remedial Tax and Benefit Policies in Indonesia
- College of Graduate Studies, University of South Africa, South Africa
- Southern African Social Policy Research Insights, United Kingdom
- Fiscal Policy Agency, Indonesia
- UNICEF Indonesia, Indonesia
- Department of Economics, Indonesia
Figures
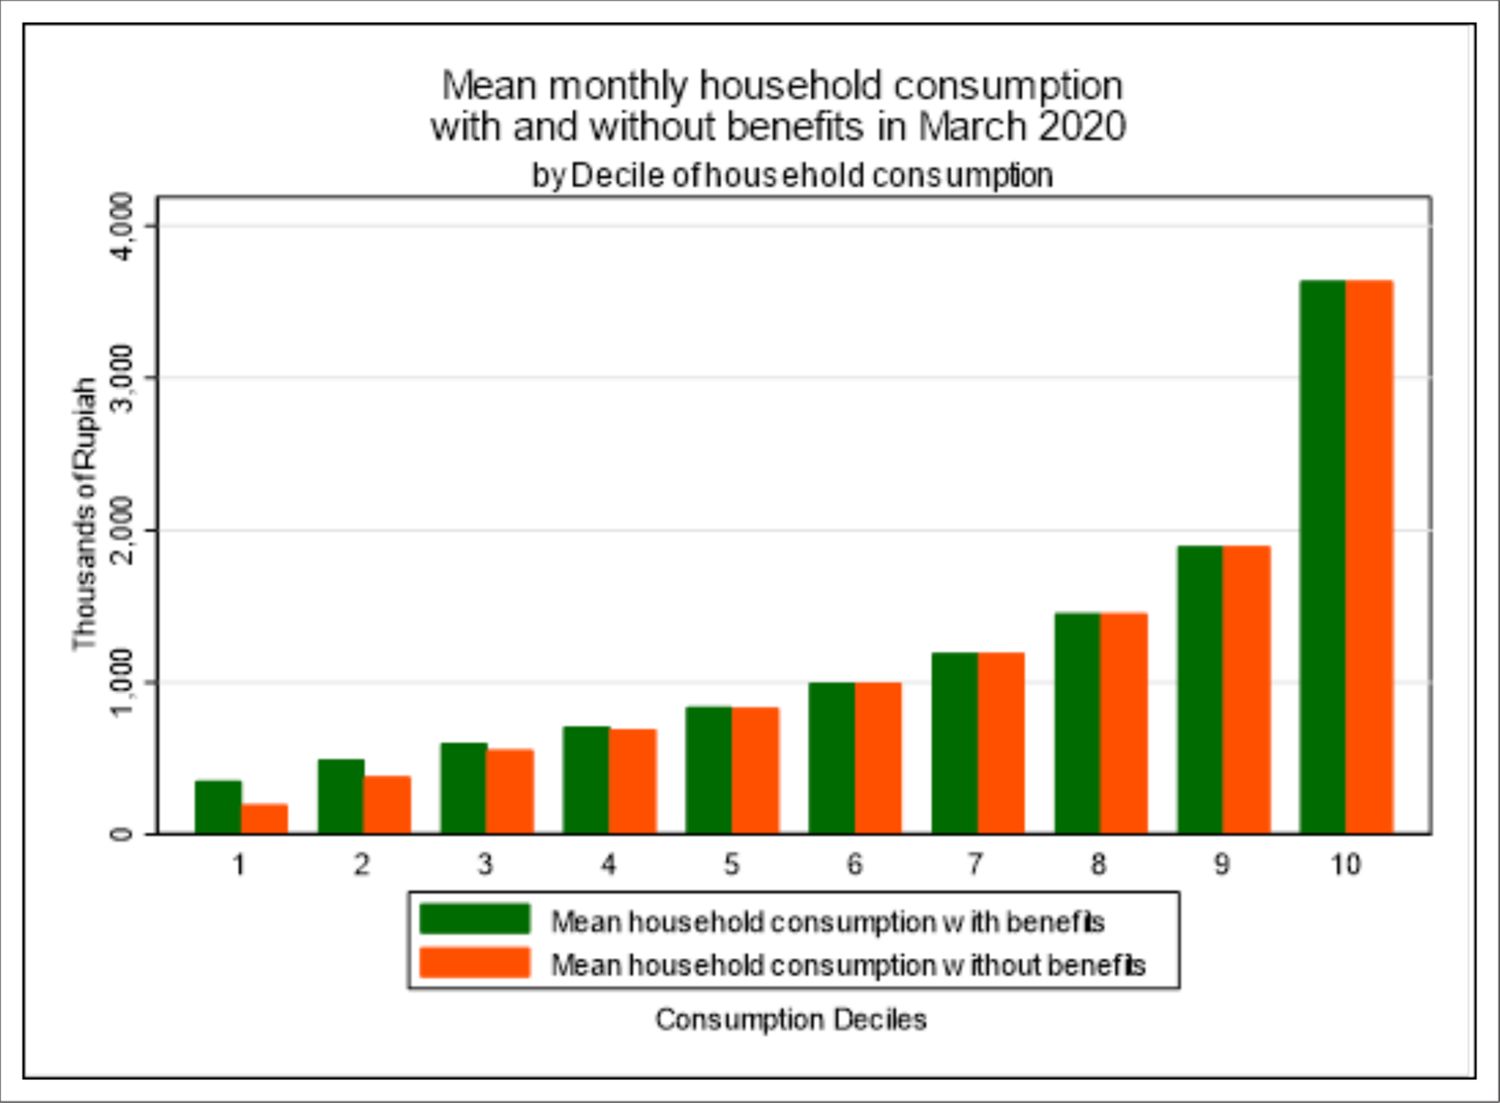
Deciles of mean monthly household consumption in Indonesia, with and without social benefits, March 2020. Source: Authors’ analysis using INDOMOD V2.1.
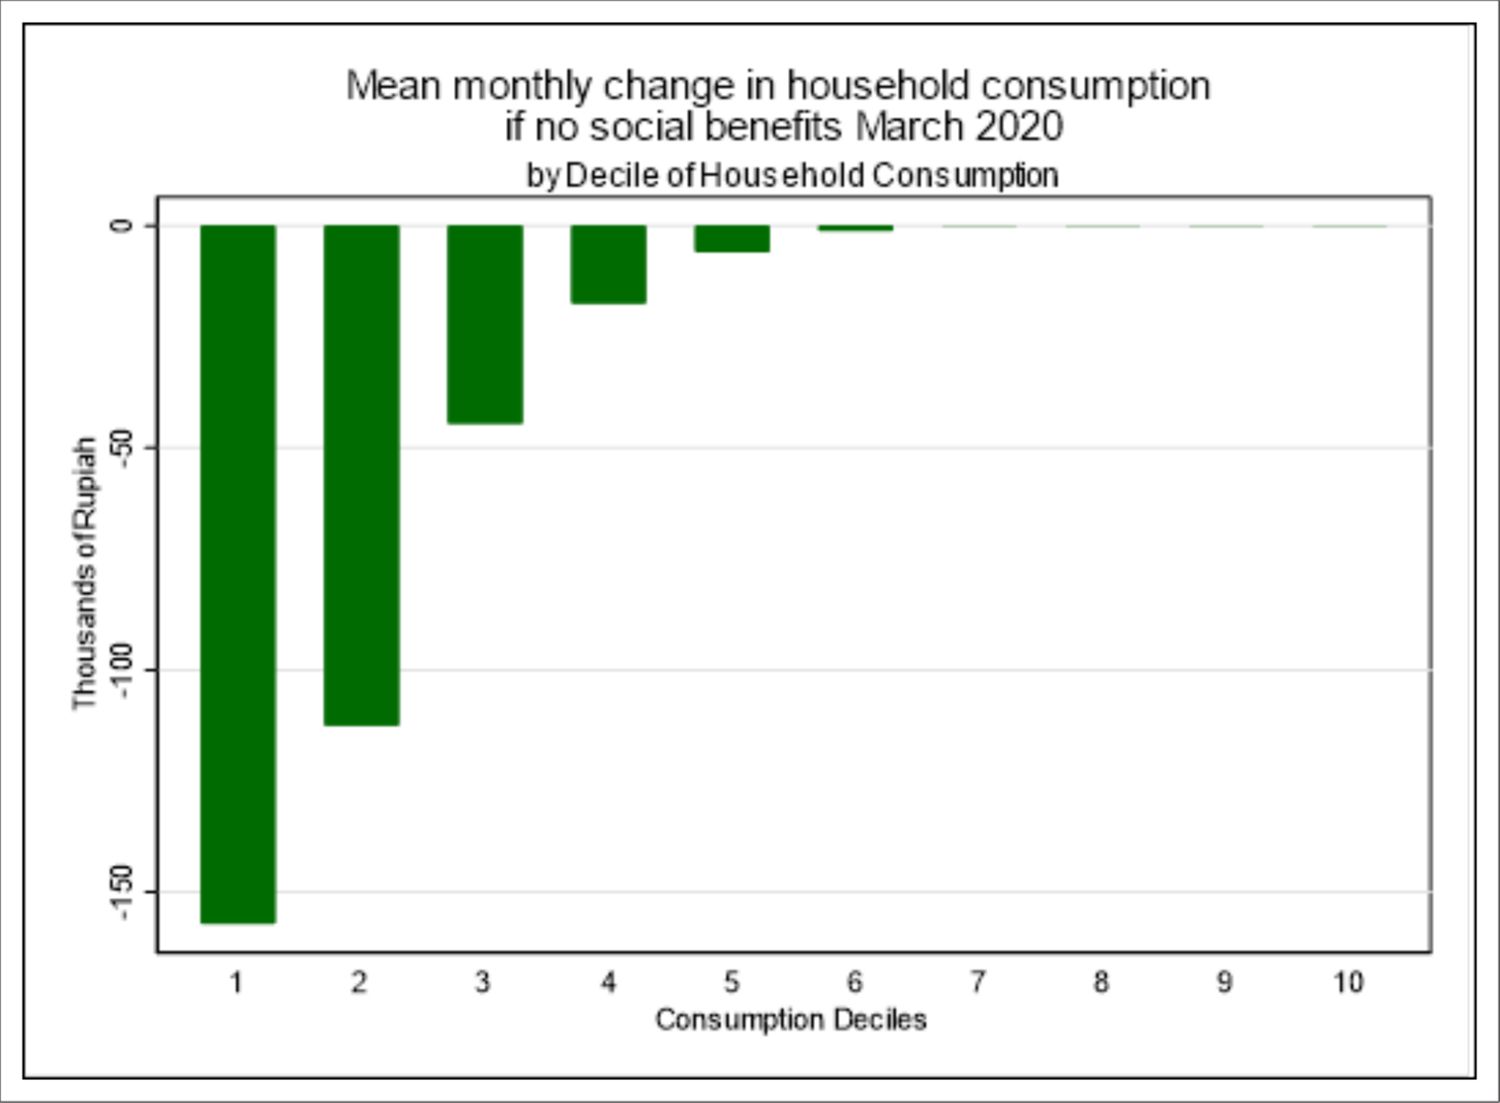
Change in mean monthly household consumption in Indonesia by decile if there were no social benefits, March 2020. Source: Authors’ analysis using INDOMOD V2.1.

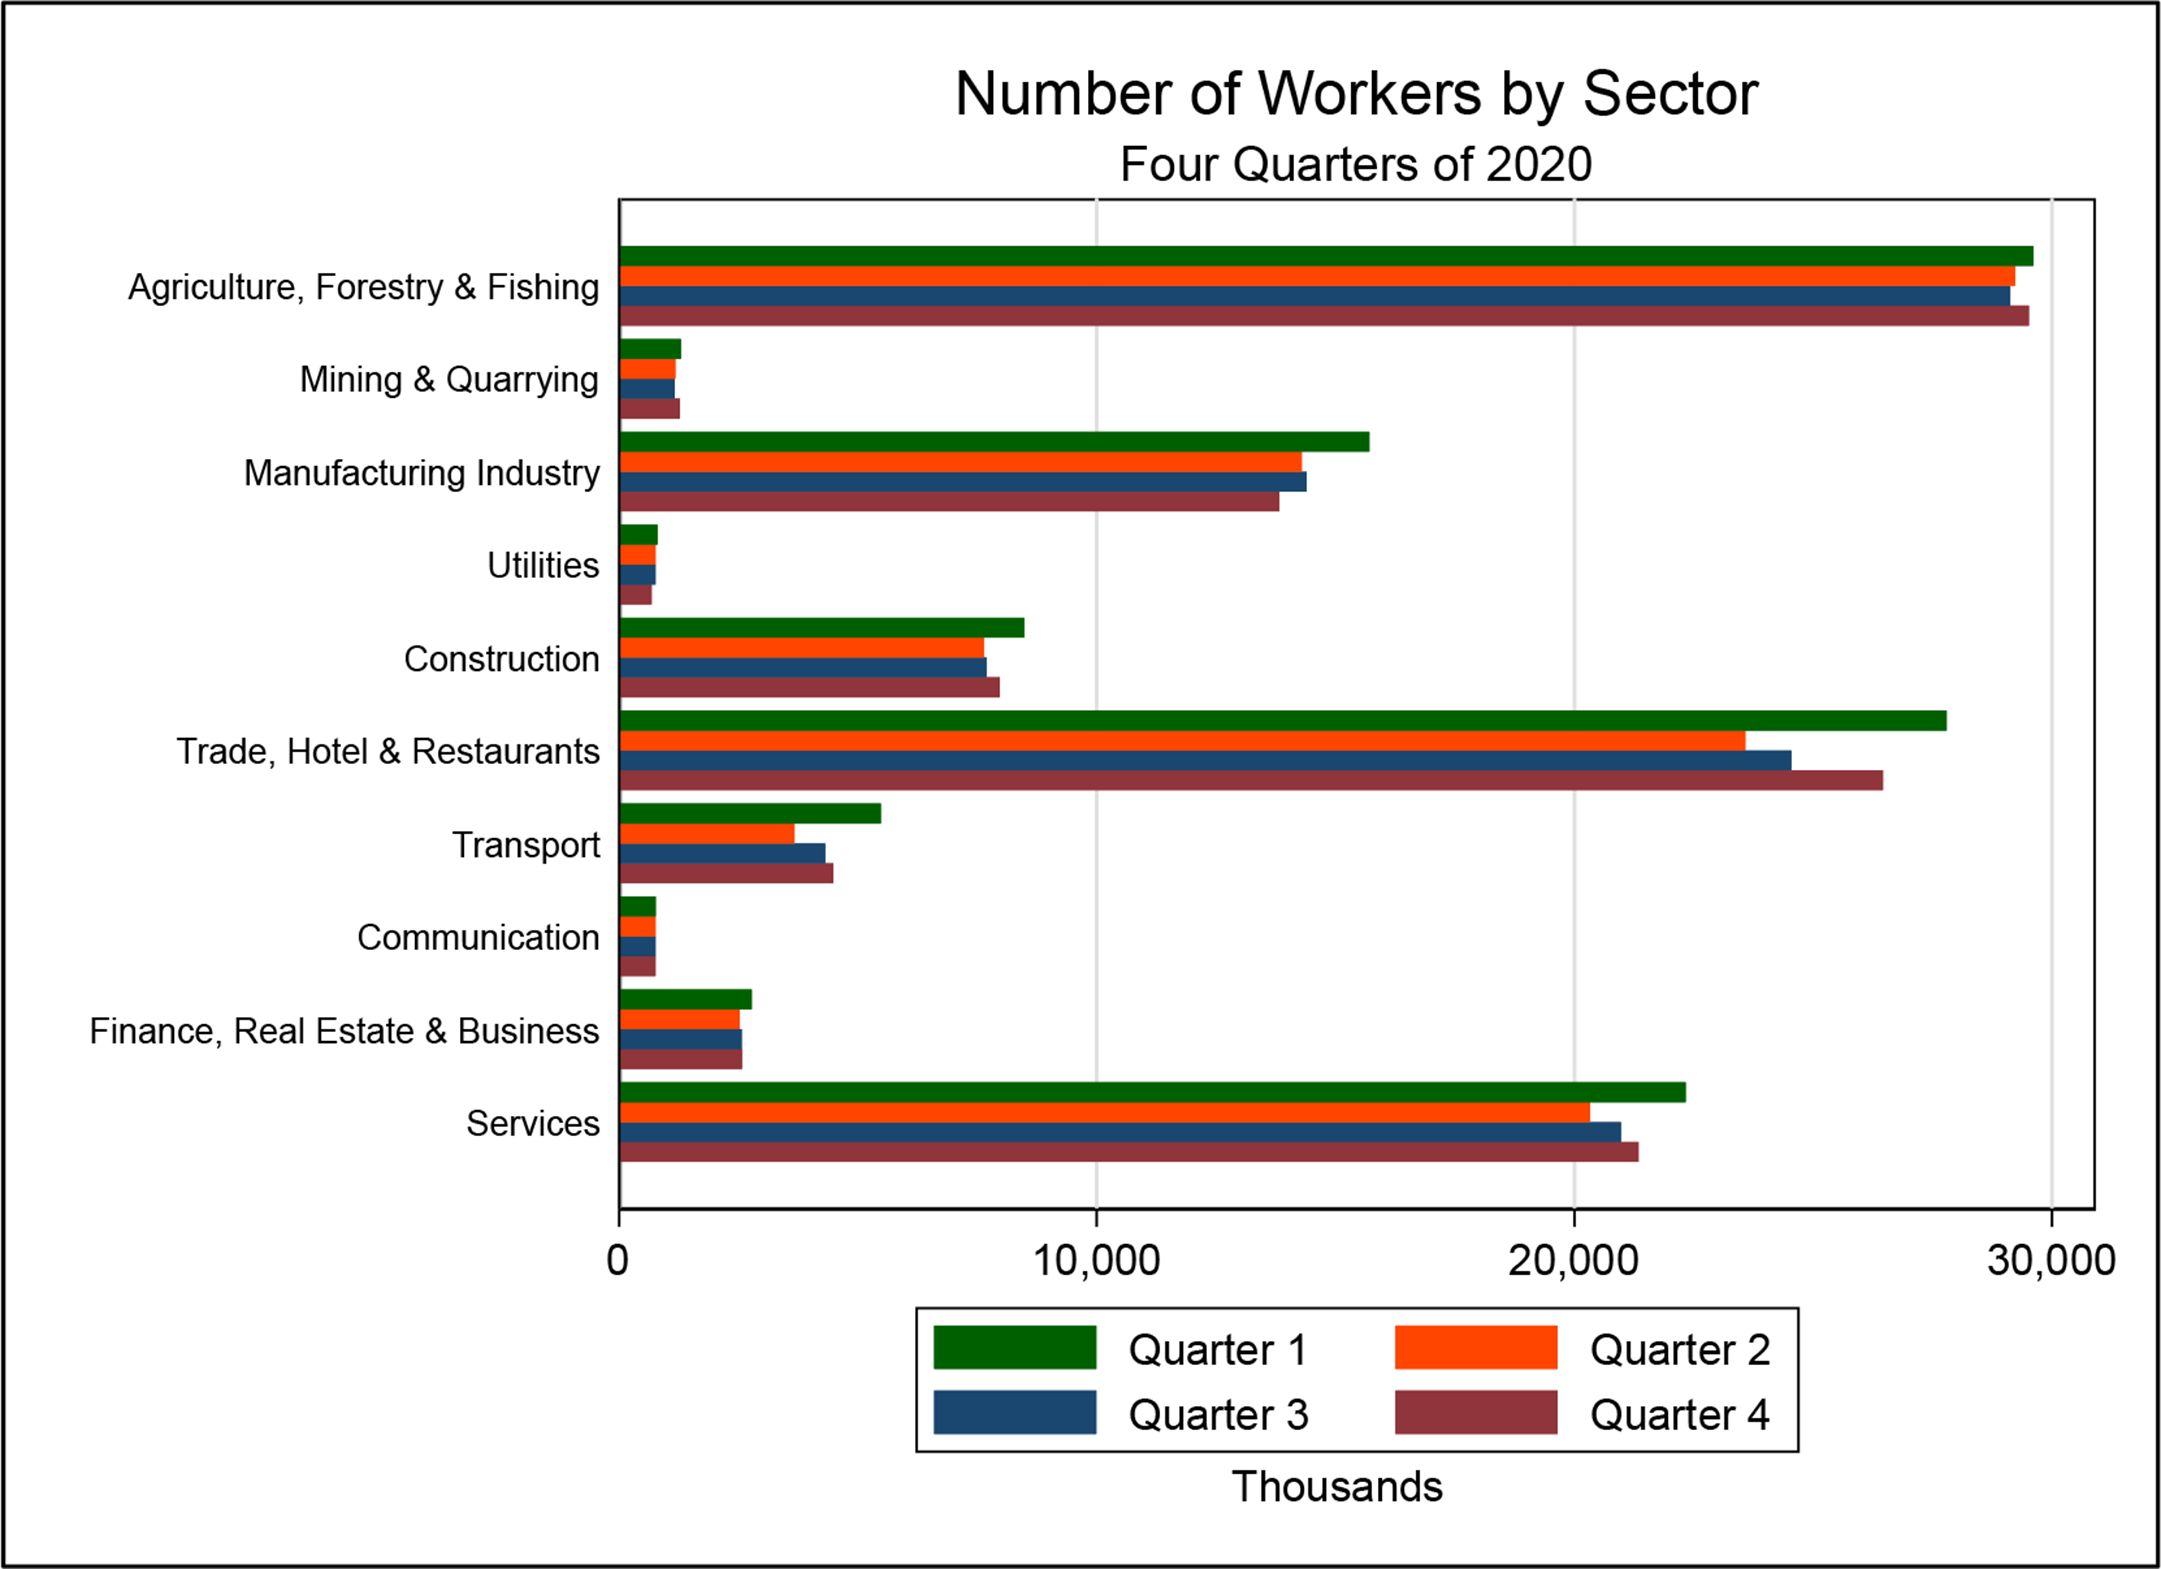
Number of workers in Indonesia by sector by quarter in 2020. Source: Authors’ analysis using the four input datasets.

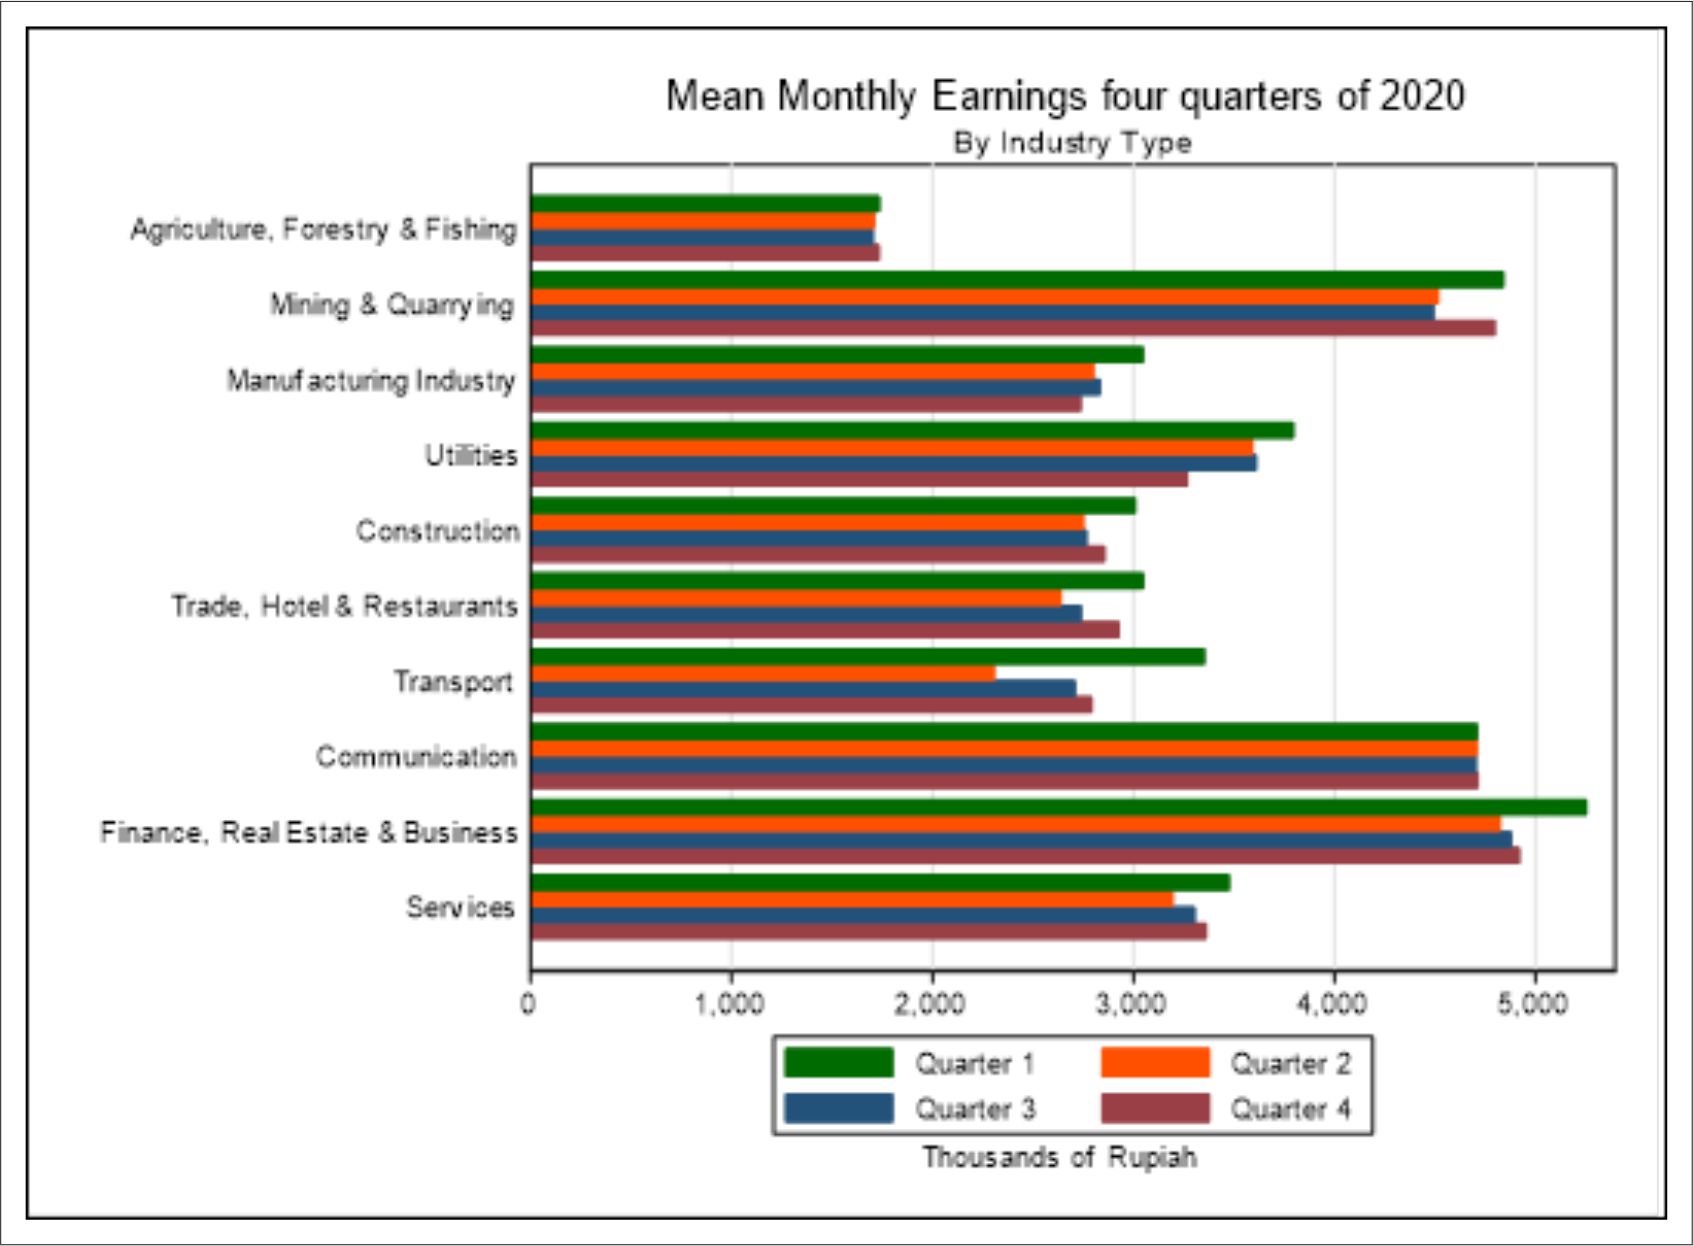
Mean monthly earnings in Indonesia by sector by quarter in 2020. Notes: The figures for Q2, Q3 and Q4 include the zero earnings of the individuals who were in employment in Q1 but were not in employment in one or more of the subsequent quarters. Source: Authors’ analysis using the four input datasets.

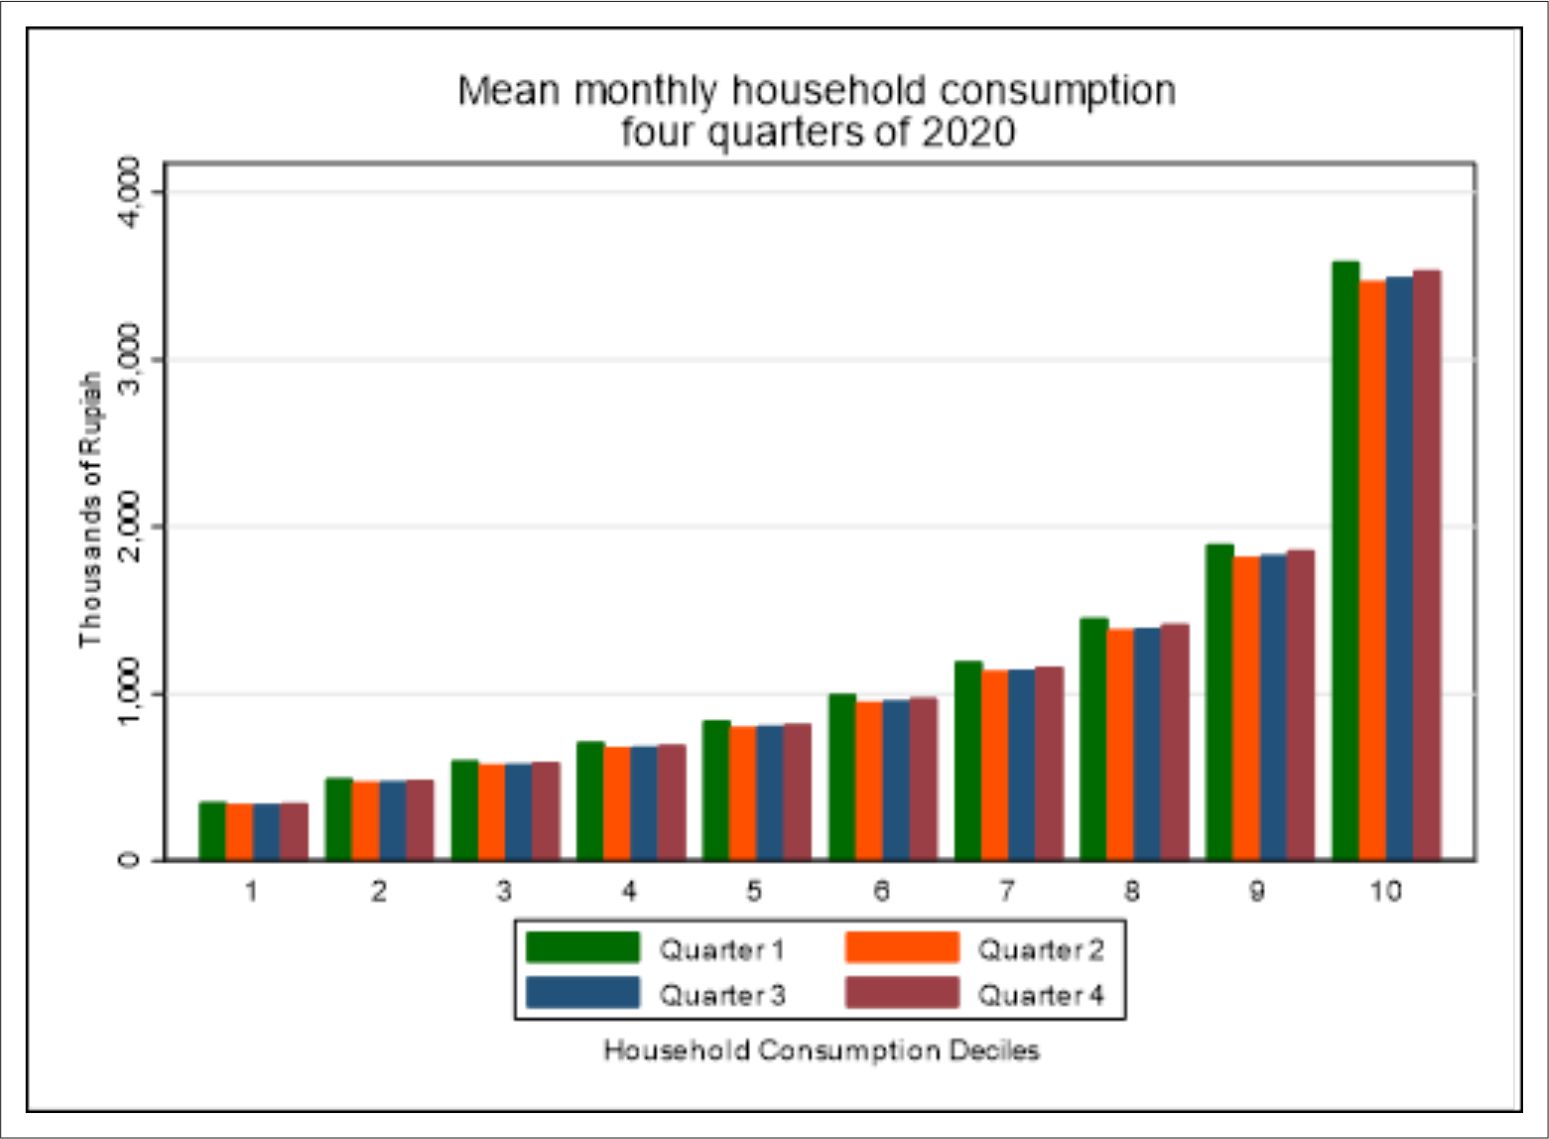
Deciles of mean monthly household consumption in Indonesia by quarter in 2020. Source: Authors’ analysis using INDOMOD V2.1.

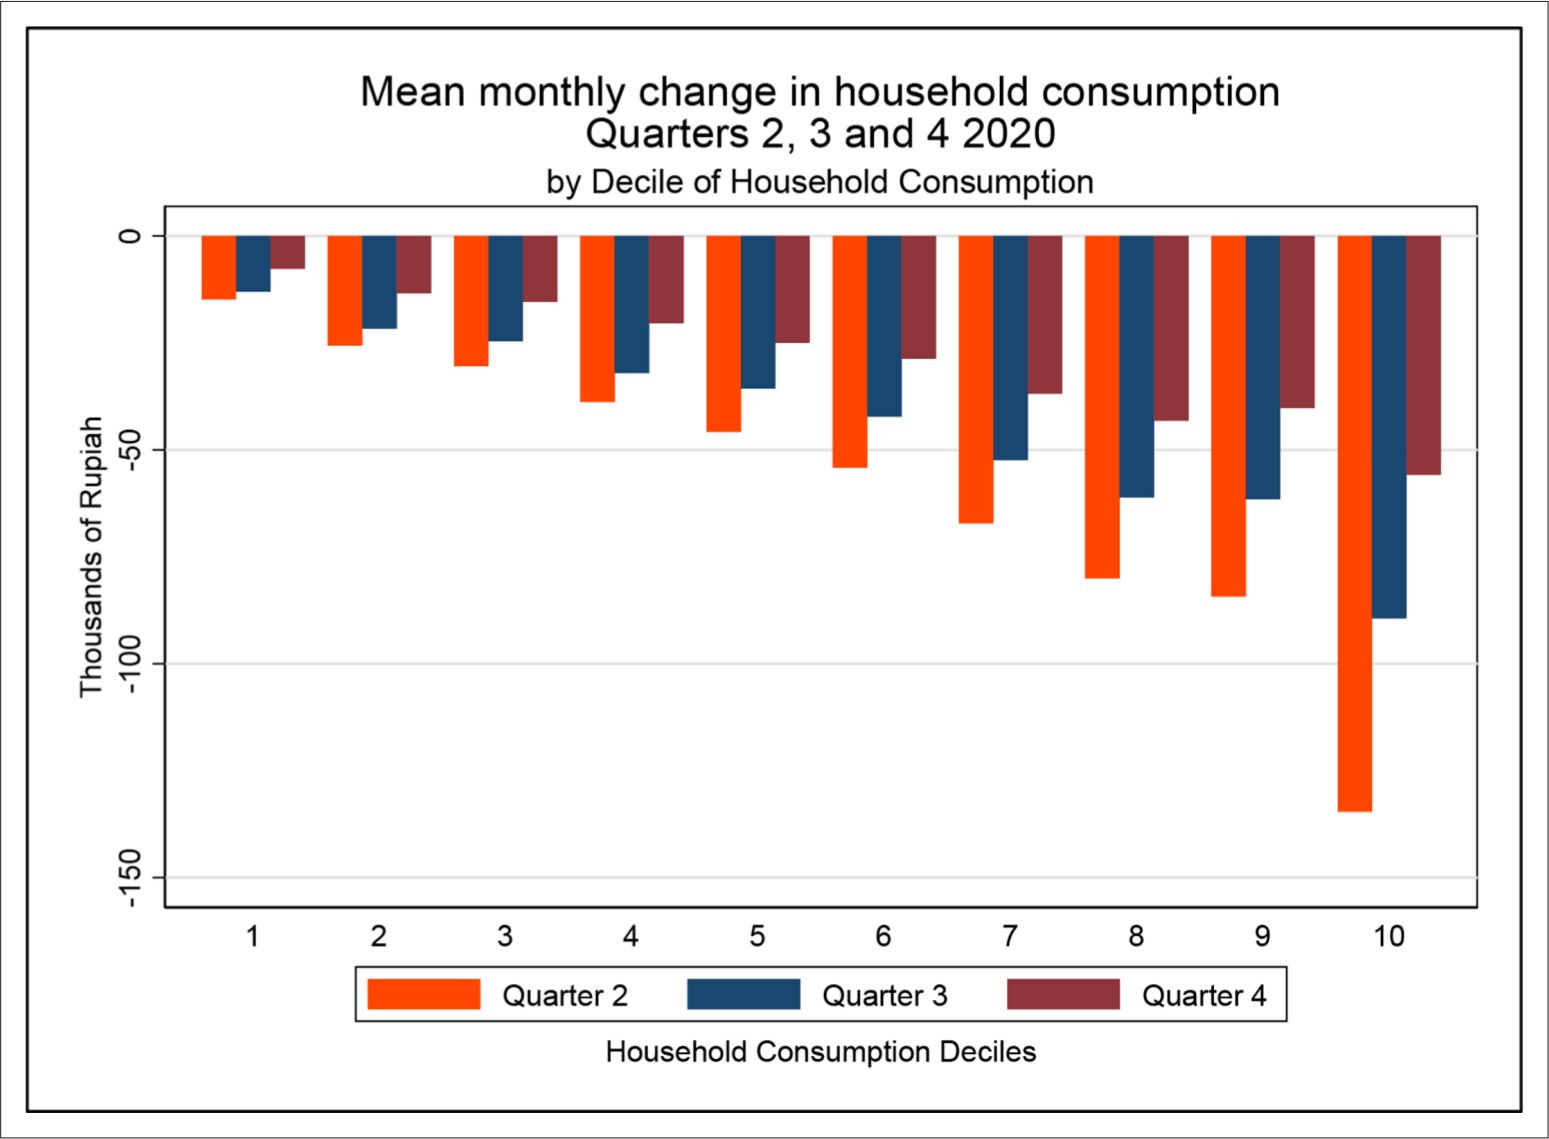
Change in mean monthly household consumption in Indonesia by quarter in 2020. Source: Authors’ analysis using INDOMOD V2.1.
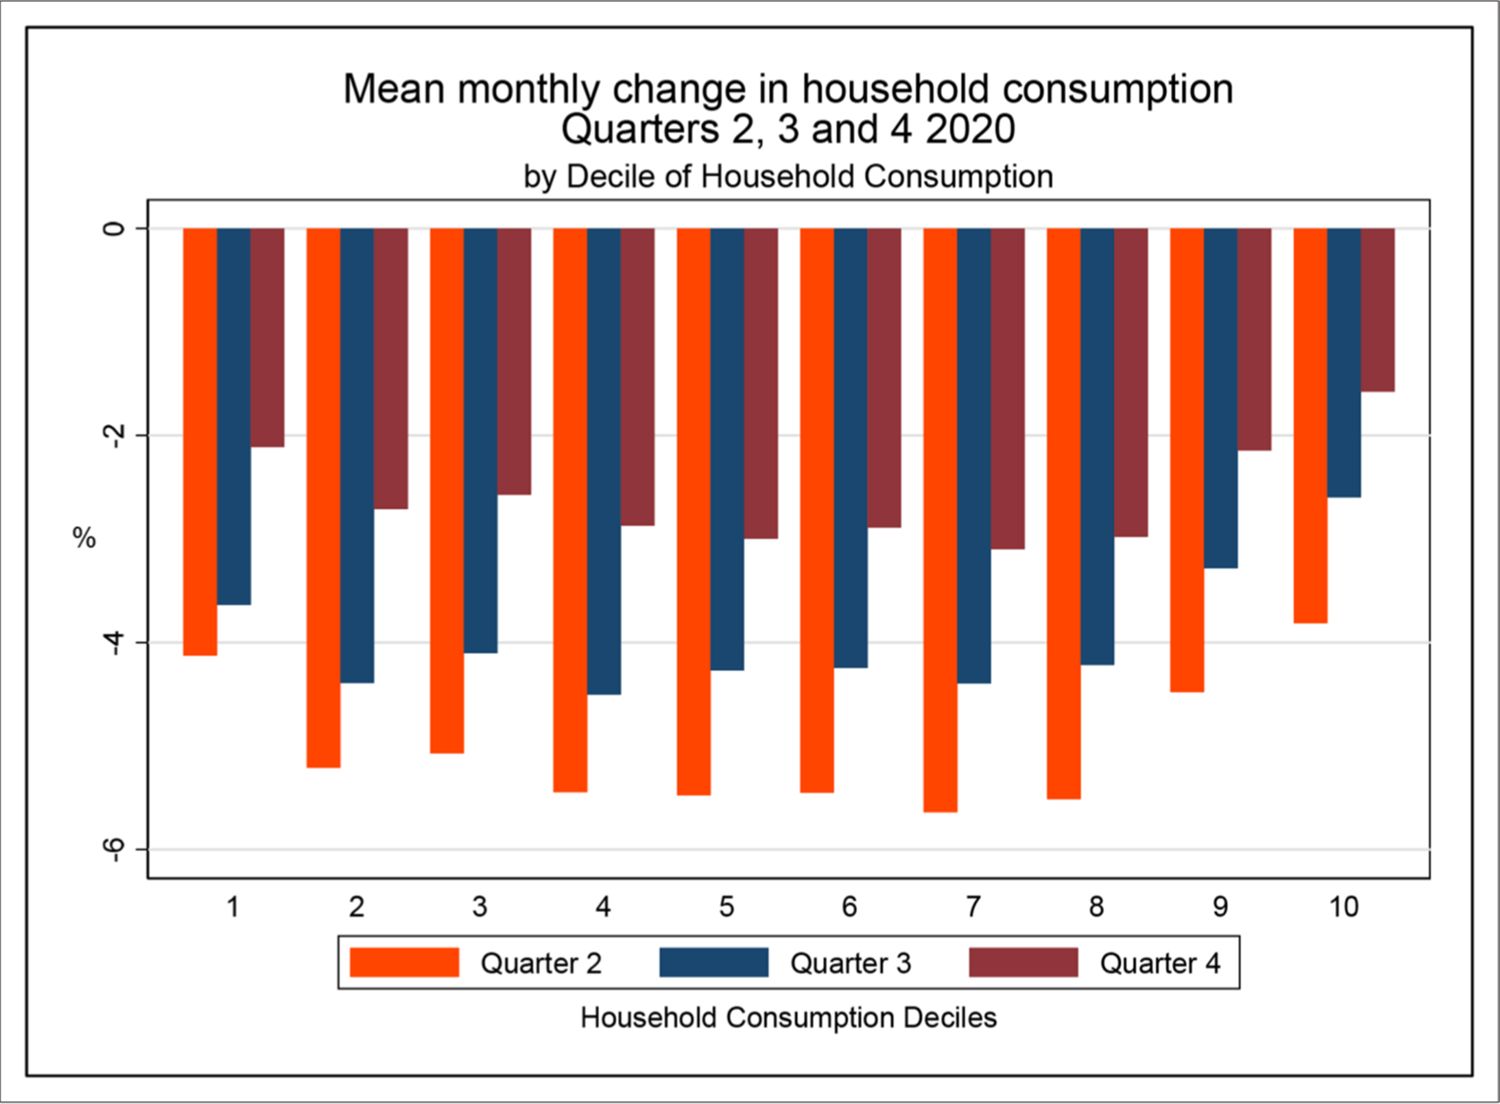
Percentage change in mean monthly household consumption in Indonesia by quarter in 2020. Source: Authors’ analysis using INDOMOD V2.1.
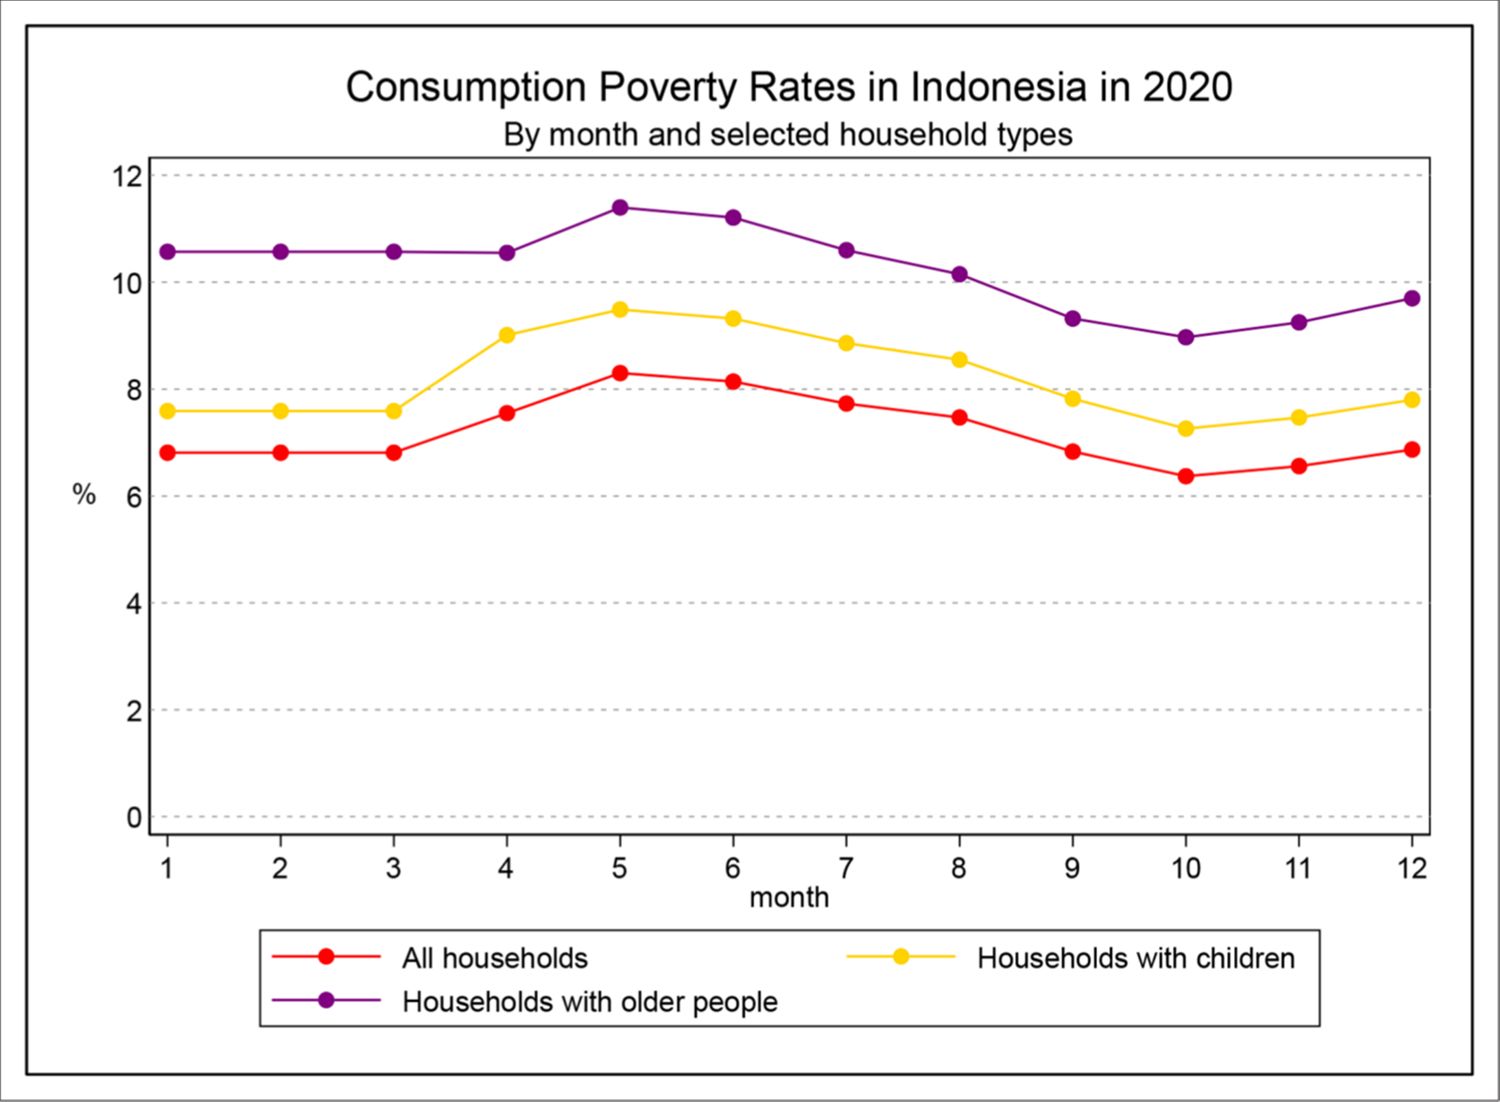
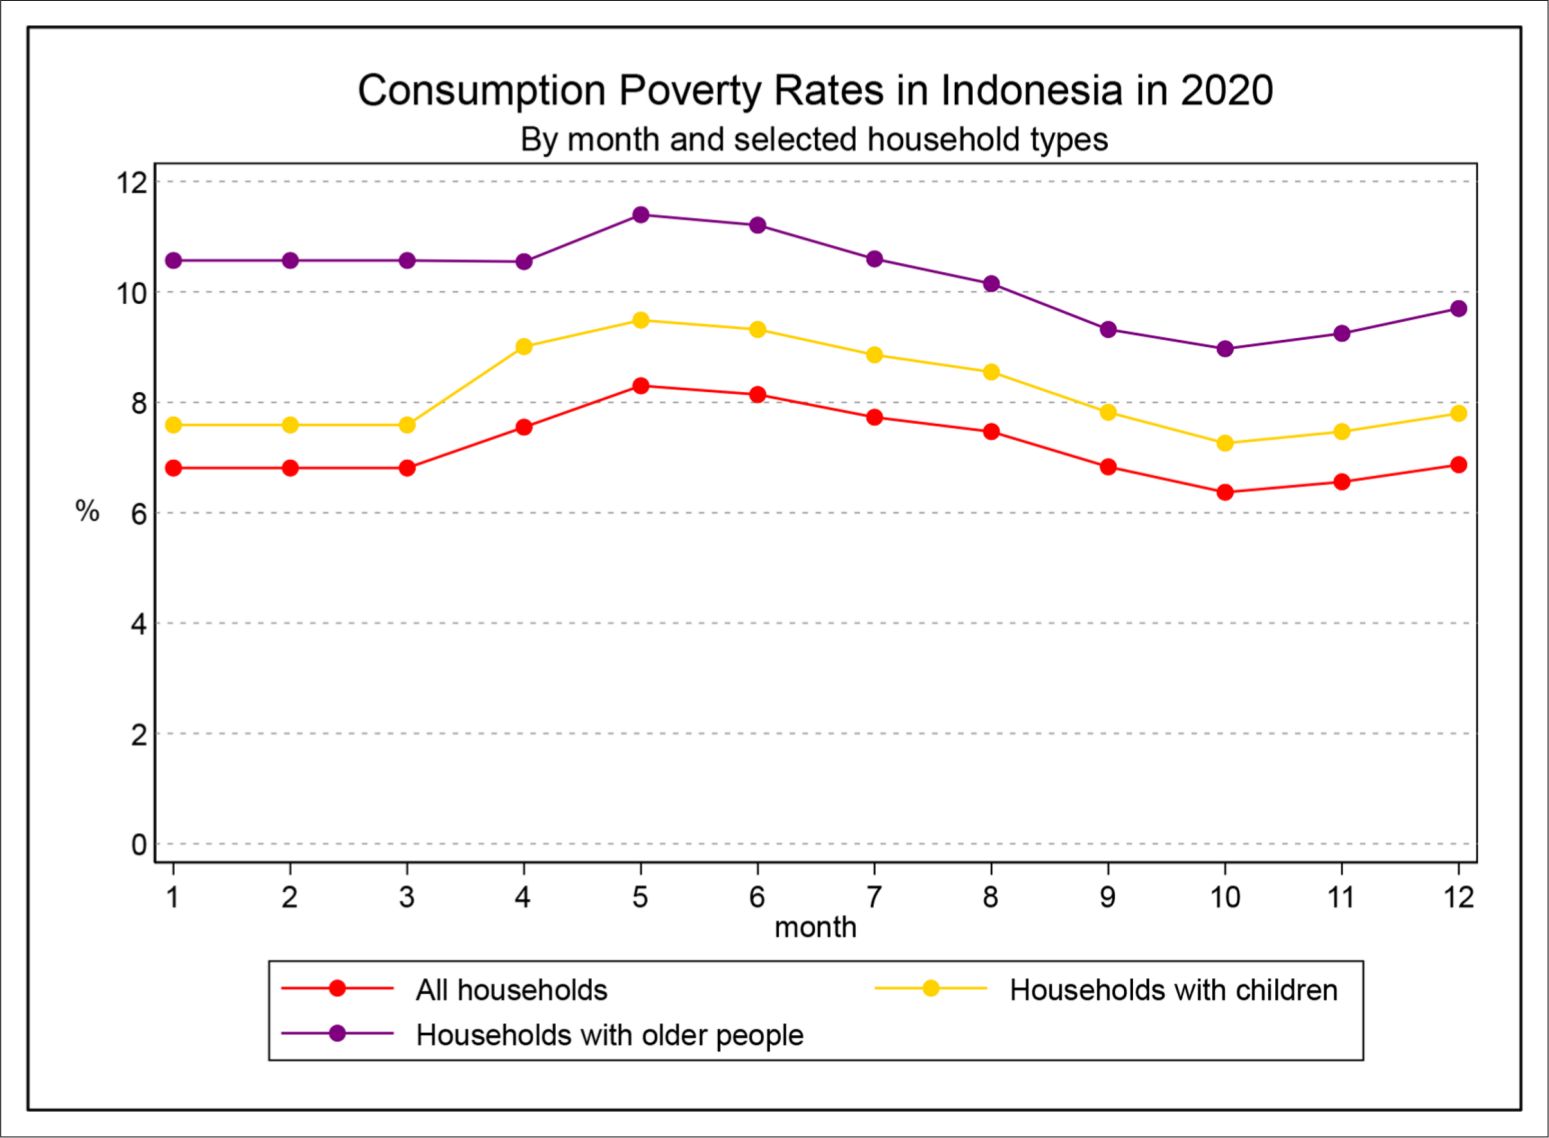
Poverty in Indonesia by month, 2020. Source: Authors’ analysis using INDOMOD V2.1.
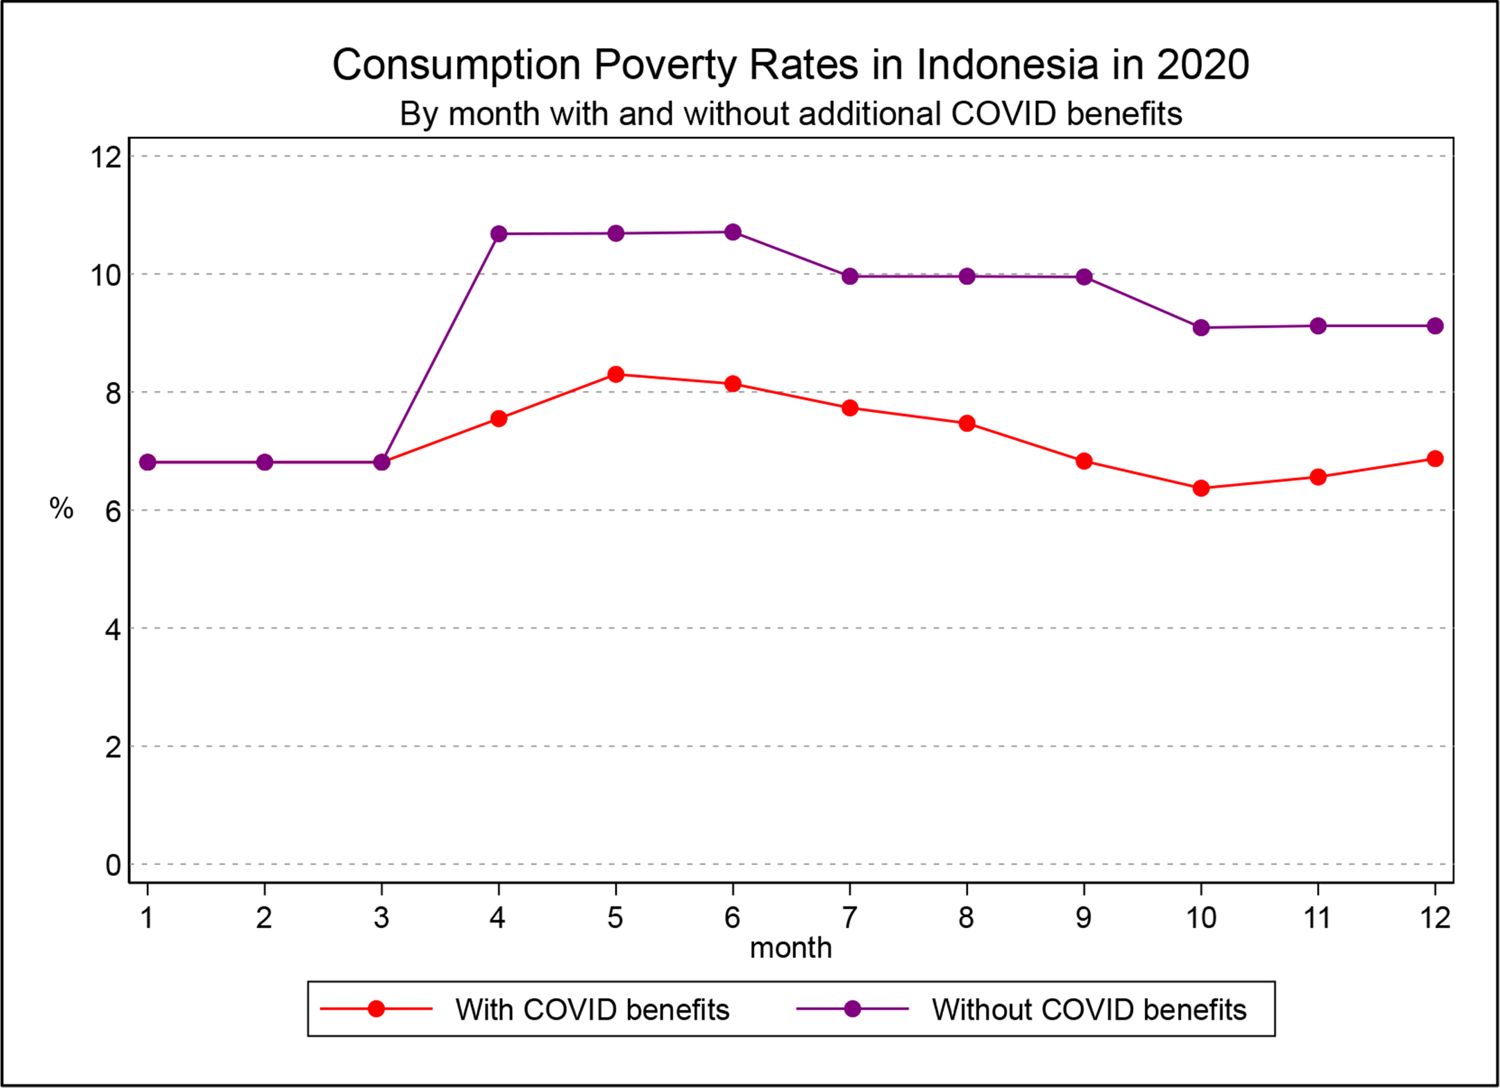
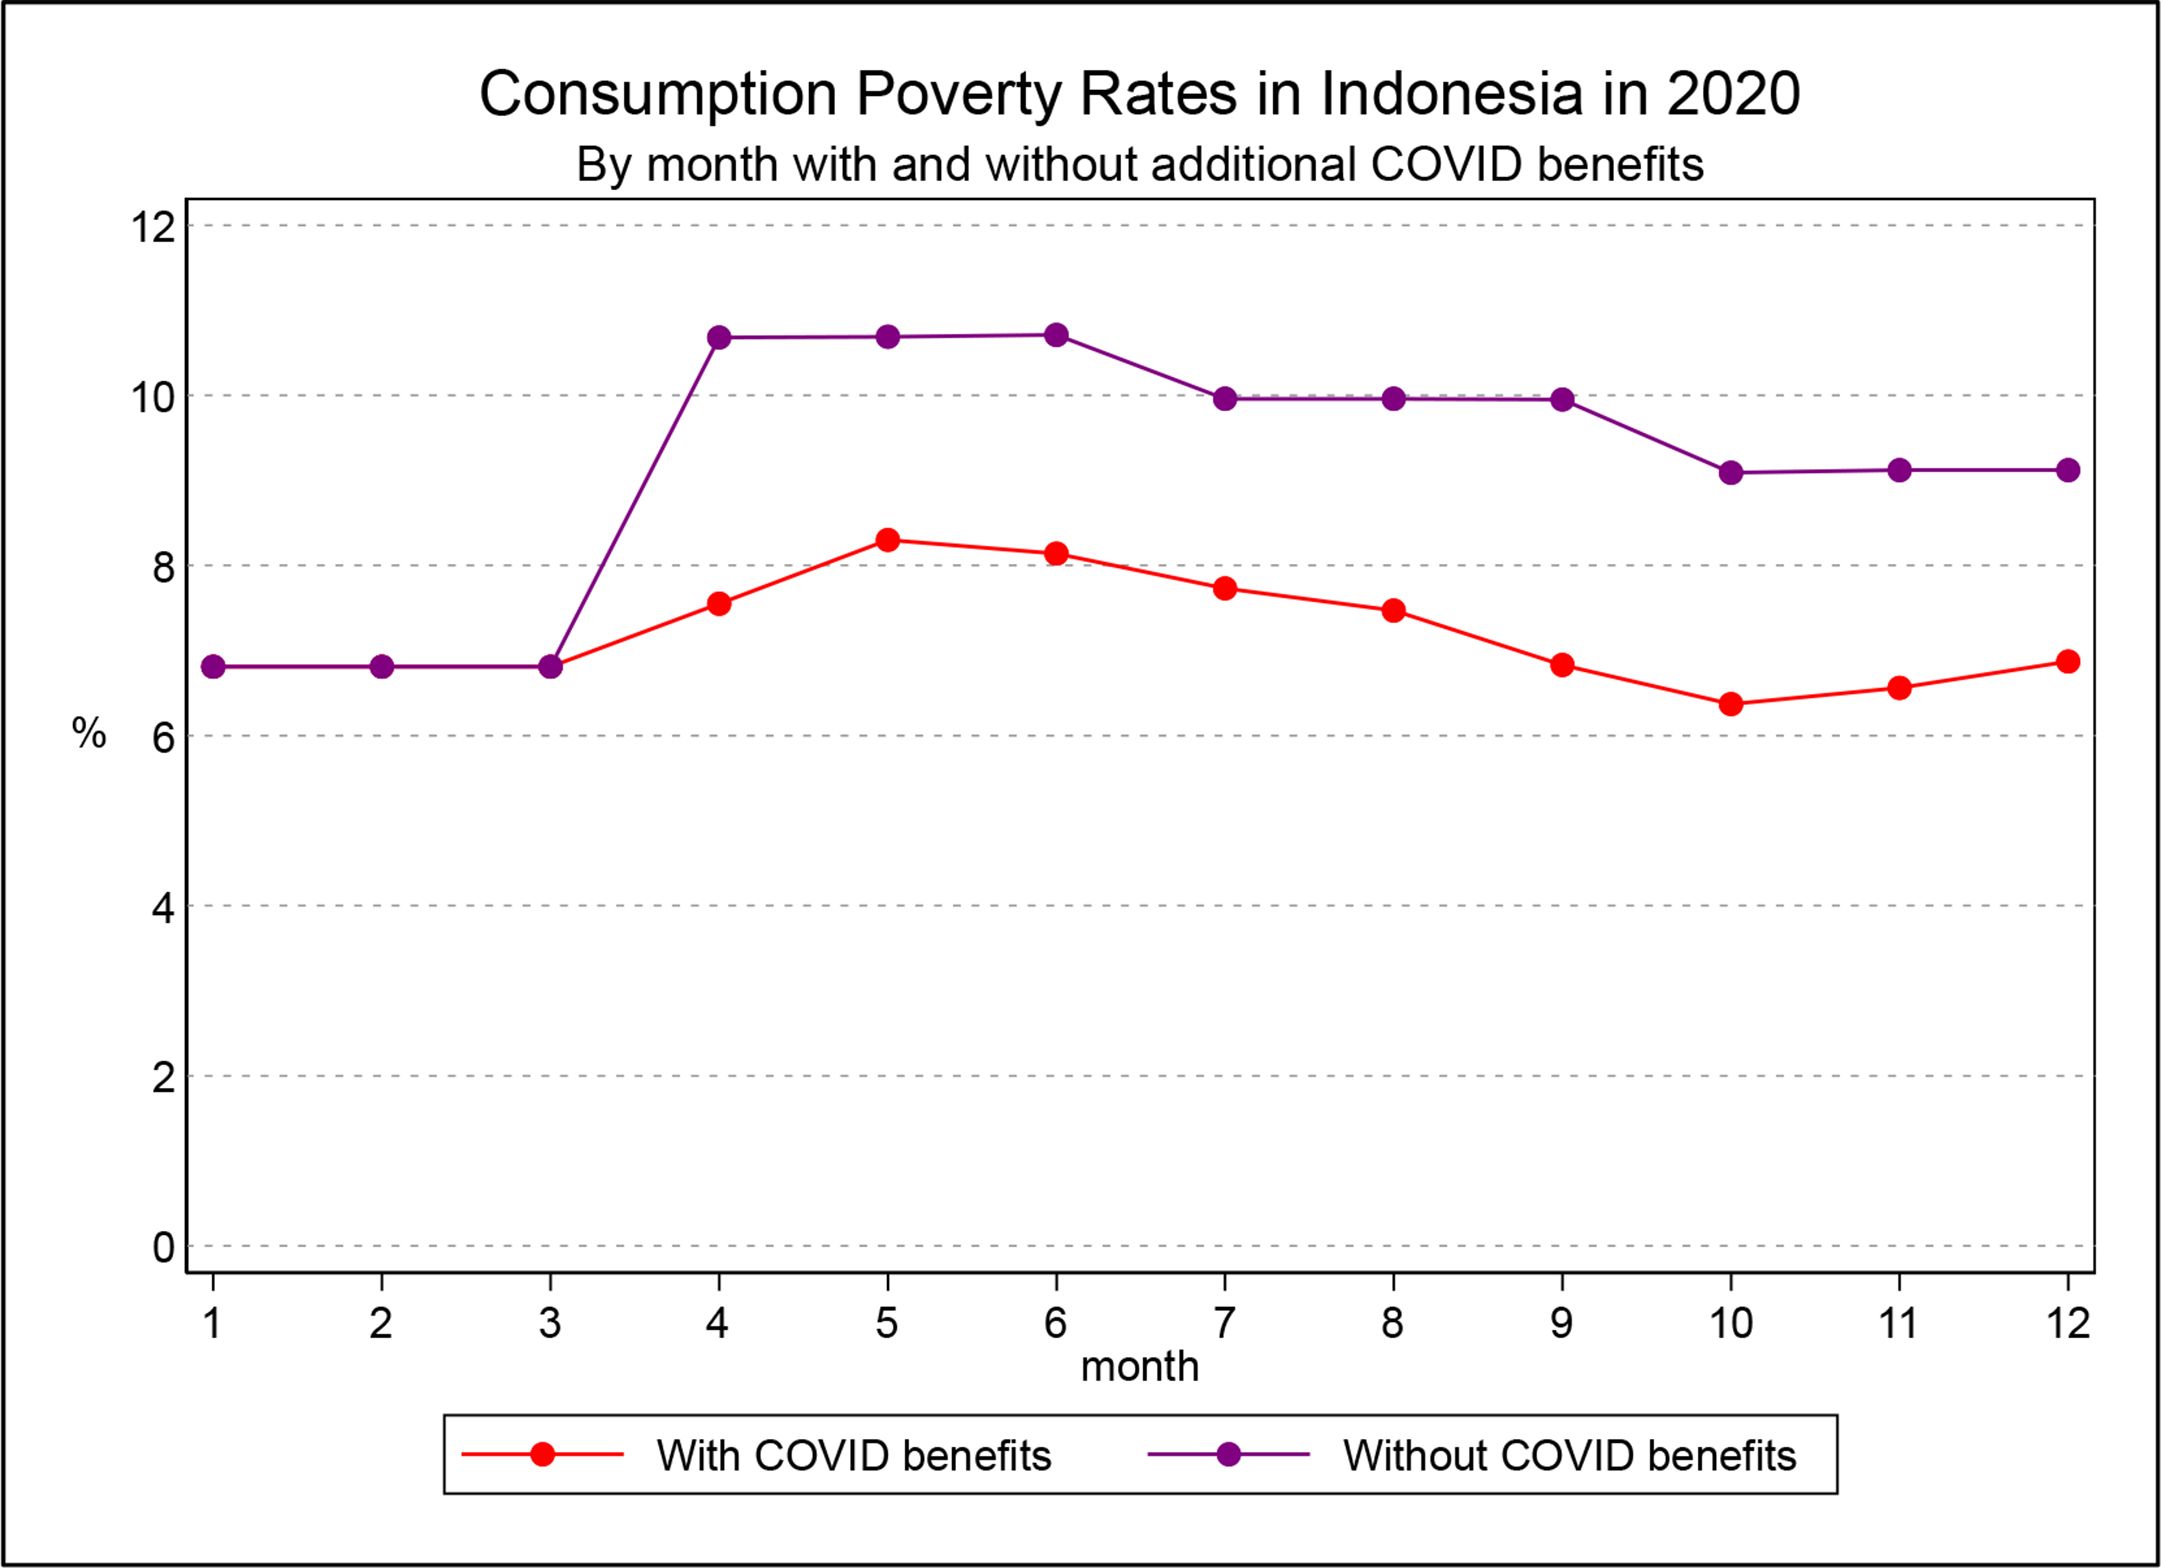
Poverty in Indonesia by month in 2020 – with and without additional COVID benefits. Source: Authors’ analysis using INDOMOD V2.1.

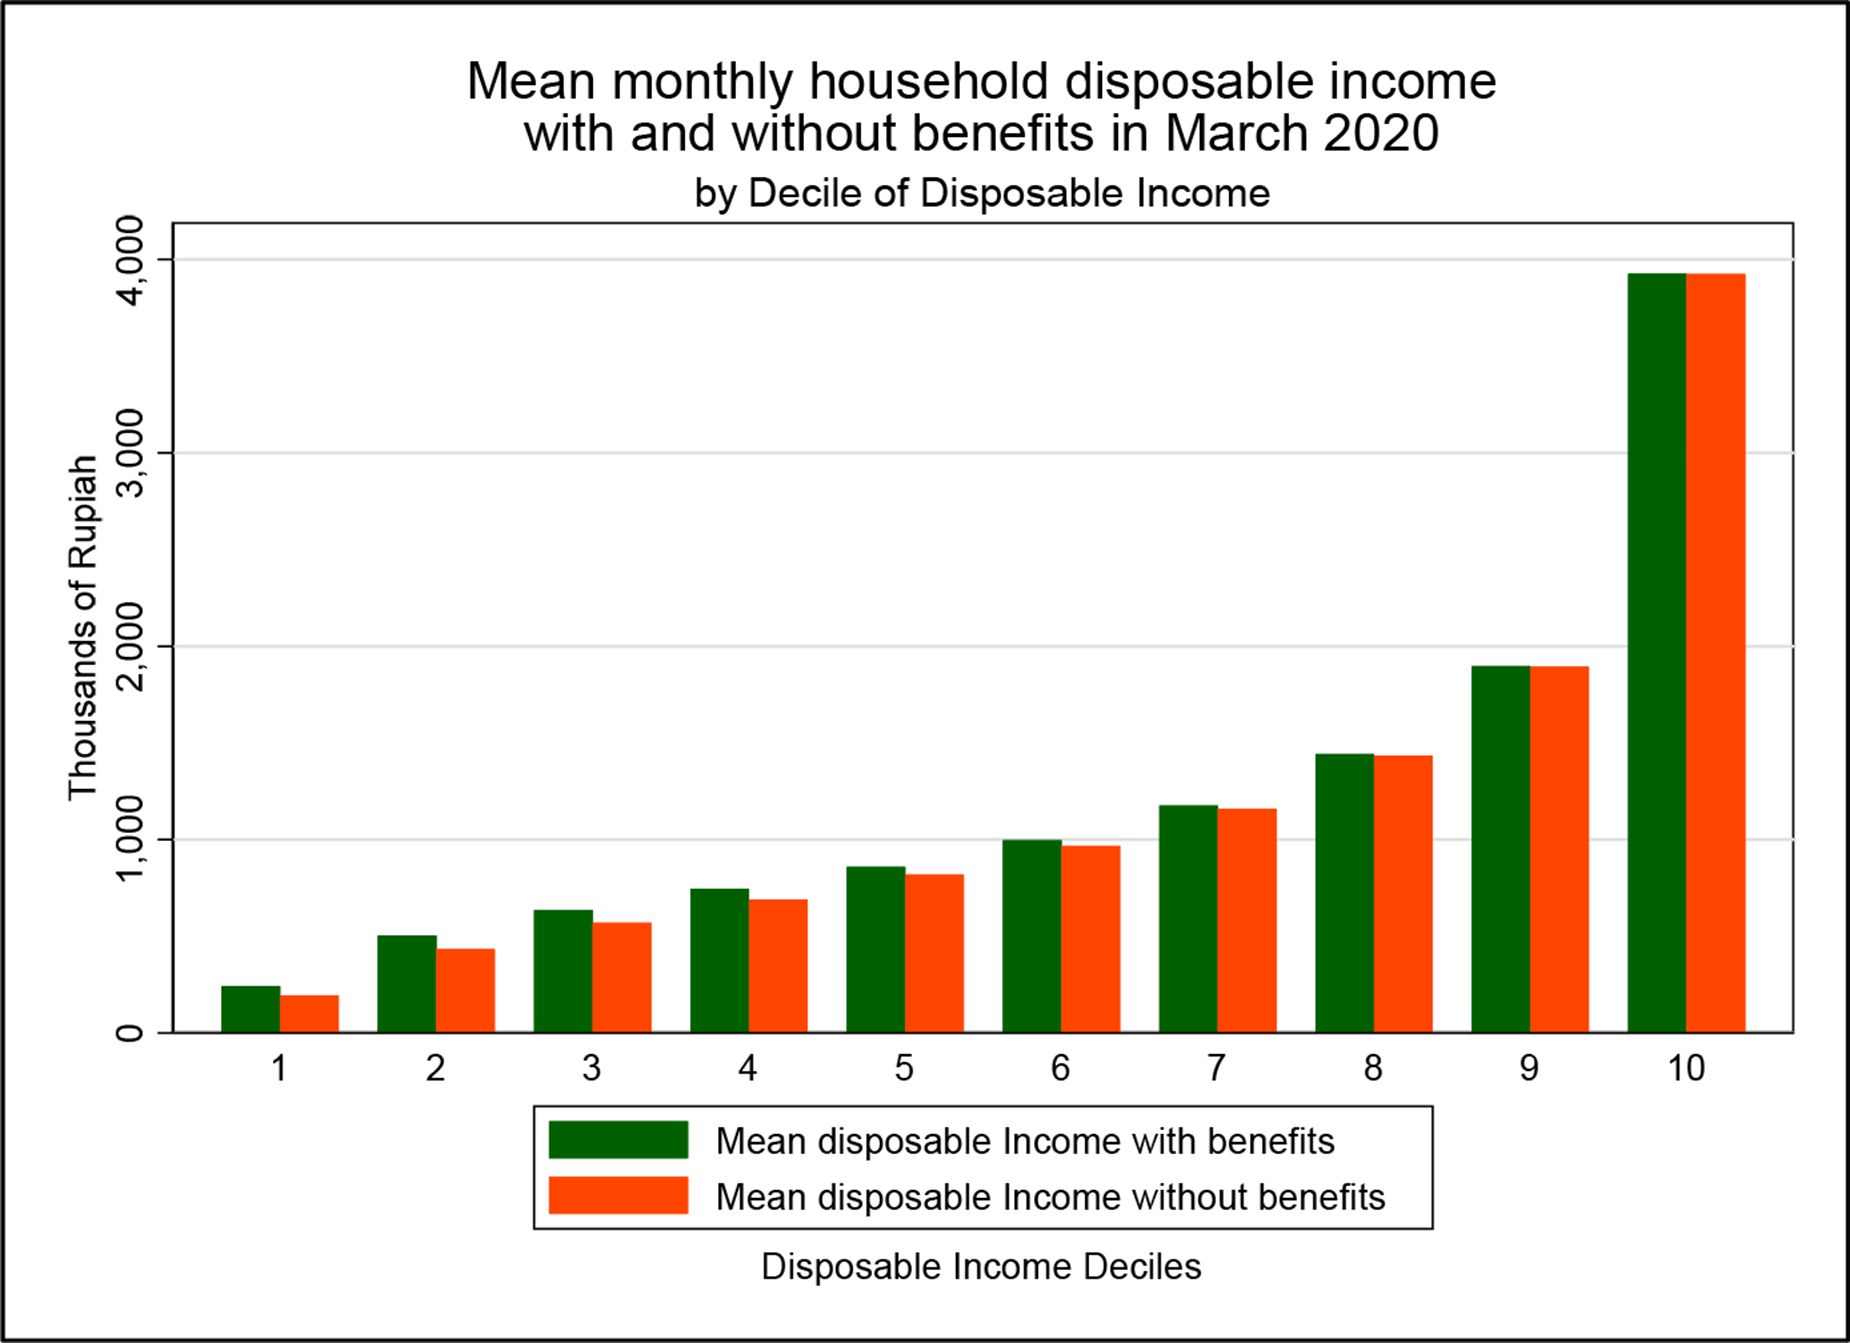
Deciles of mean monthly household disposable income in Indonesia, with and without benefits, March 2020. Source: Authors’ analysis using INDOMOD V2.1.
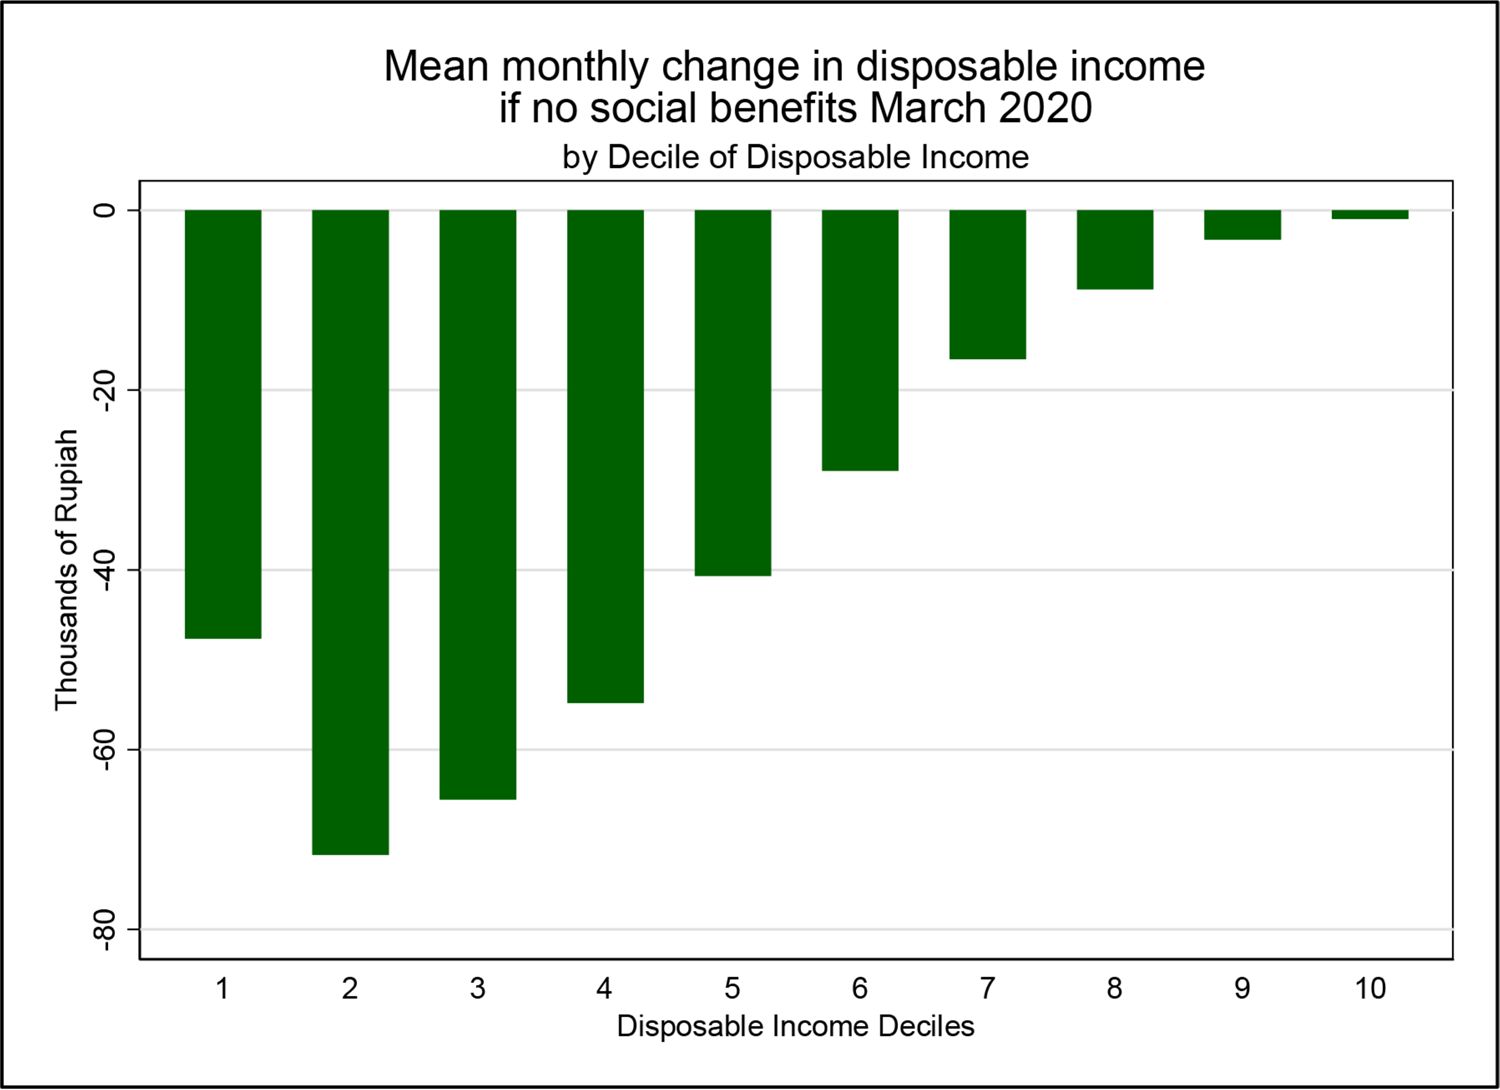
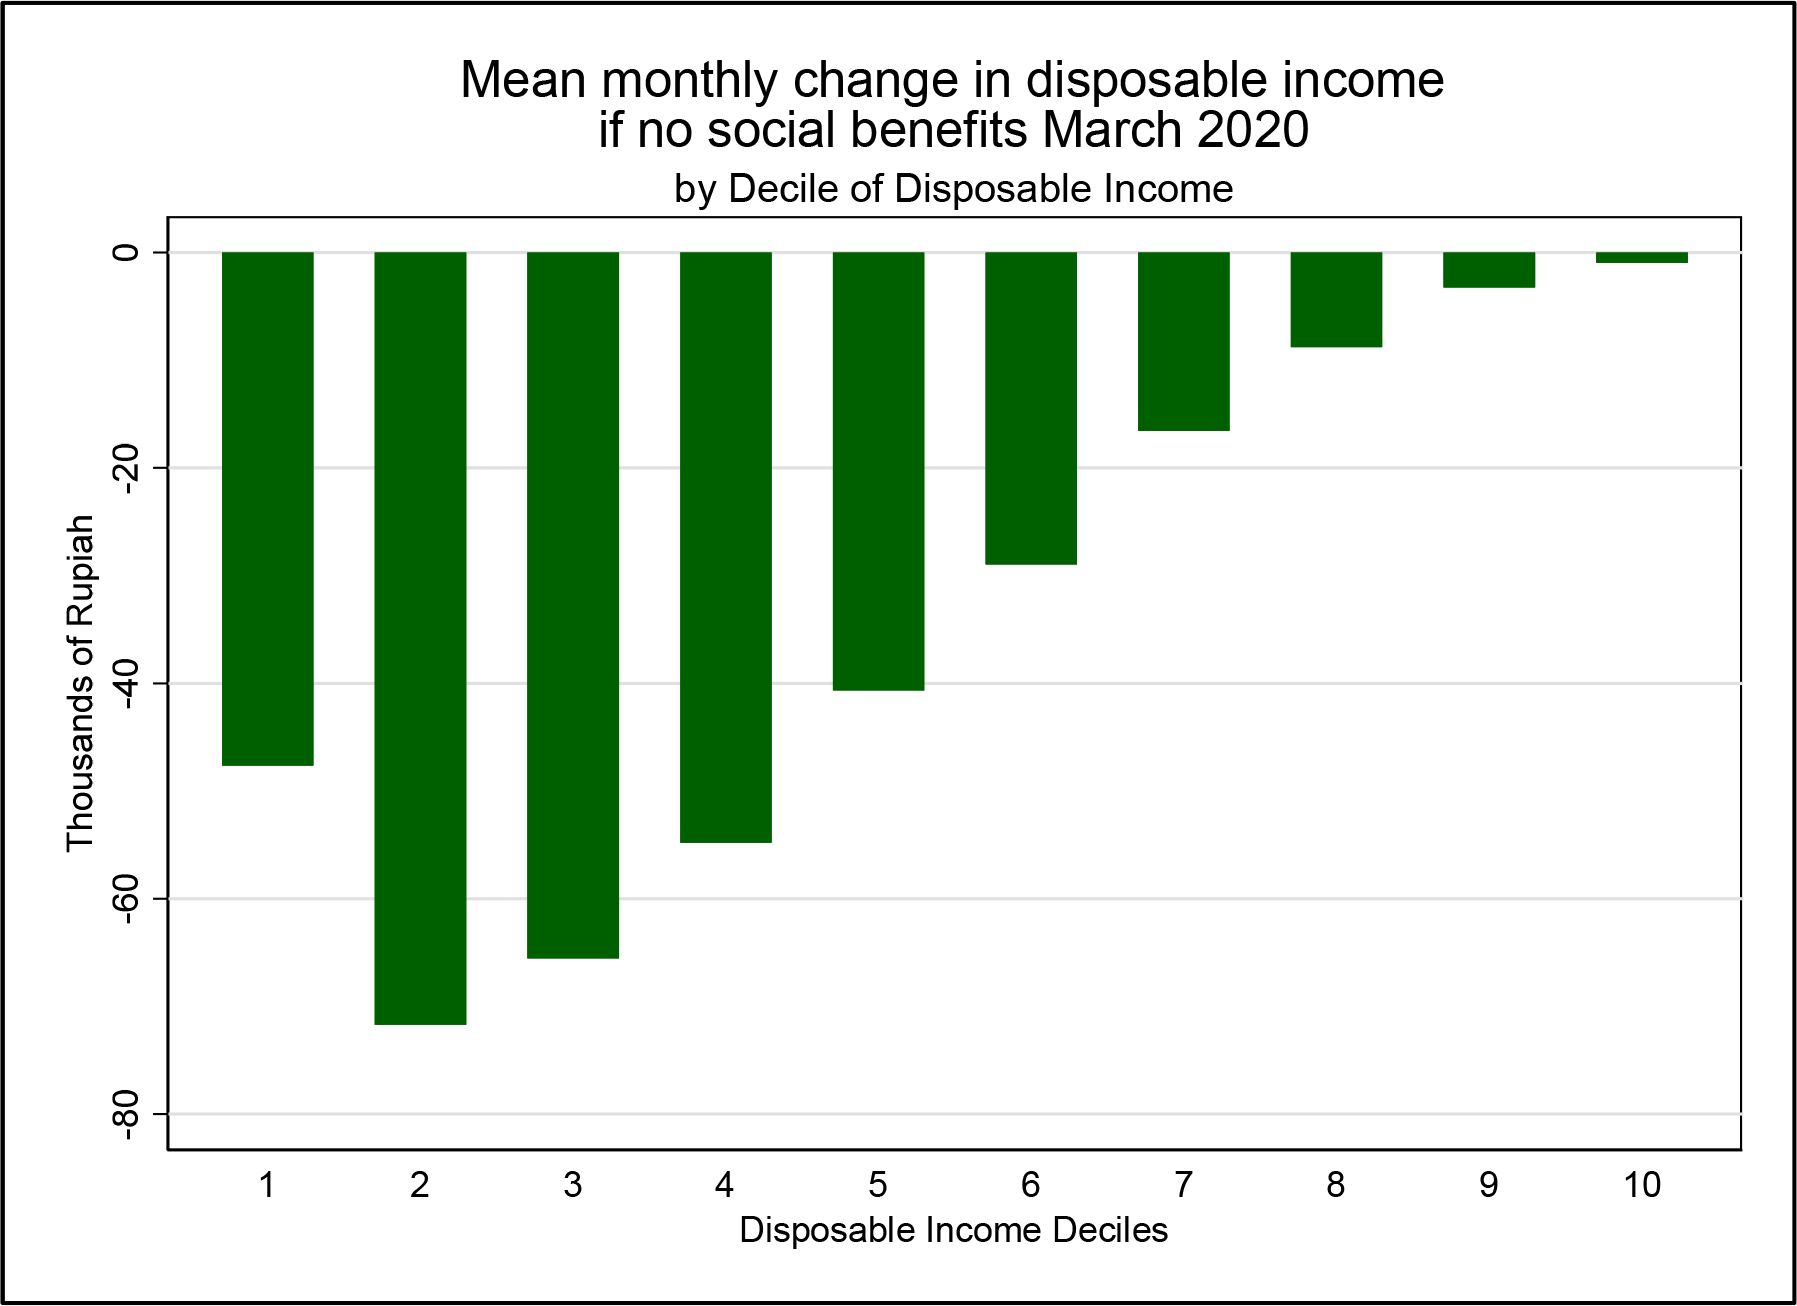
Change in mean monthly household disposable income in Indonesia by decile if there were no benefits, March 2020. Source: Authors’ analysis using INDOMOD V2.1.

Deciles of mean monthly household disposable income in Indonesia by quarter in 2020. Source: Authors’ analysis using INDOMOD V2.1.

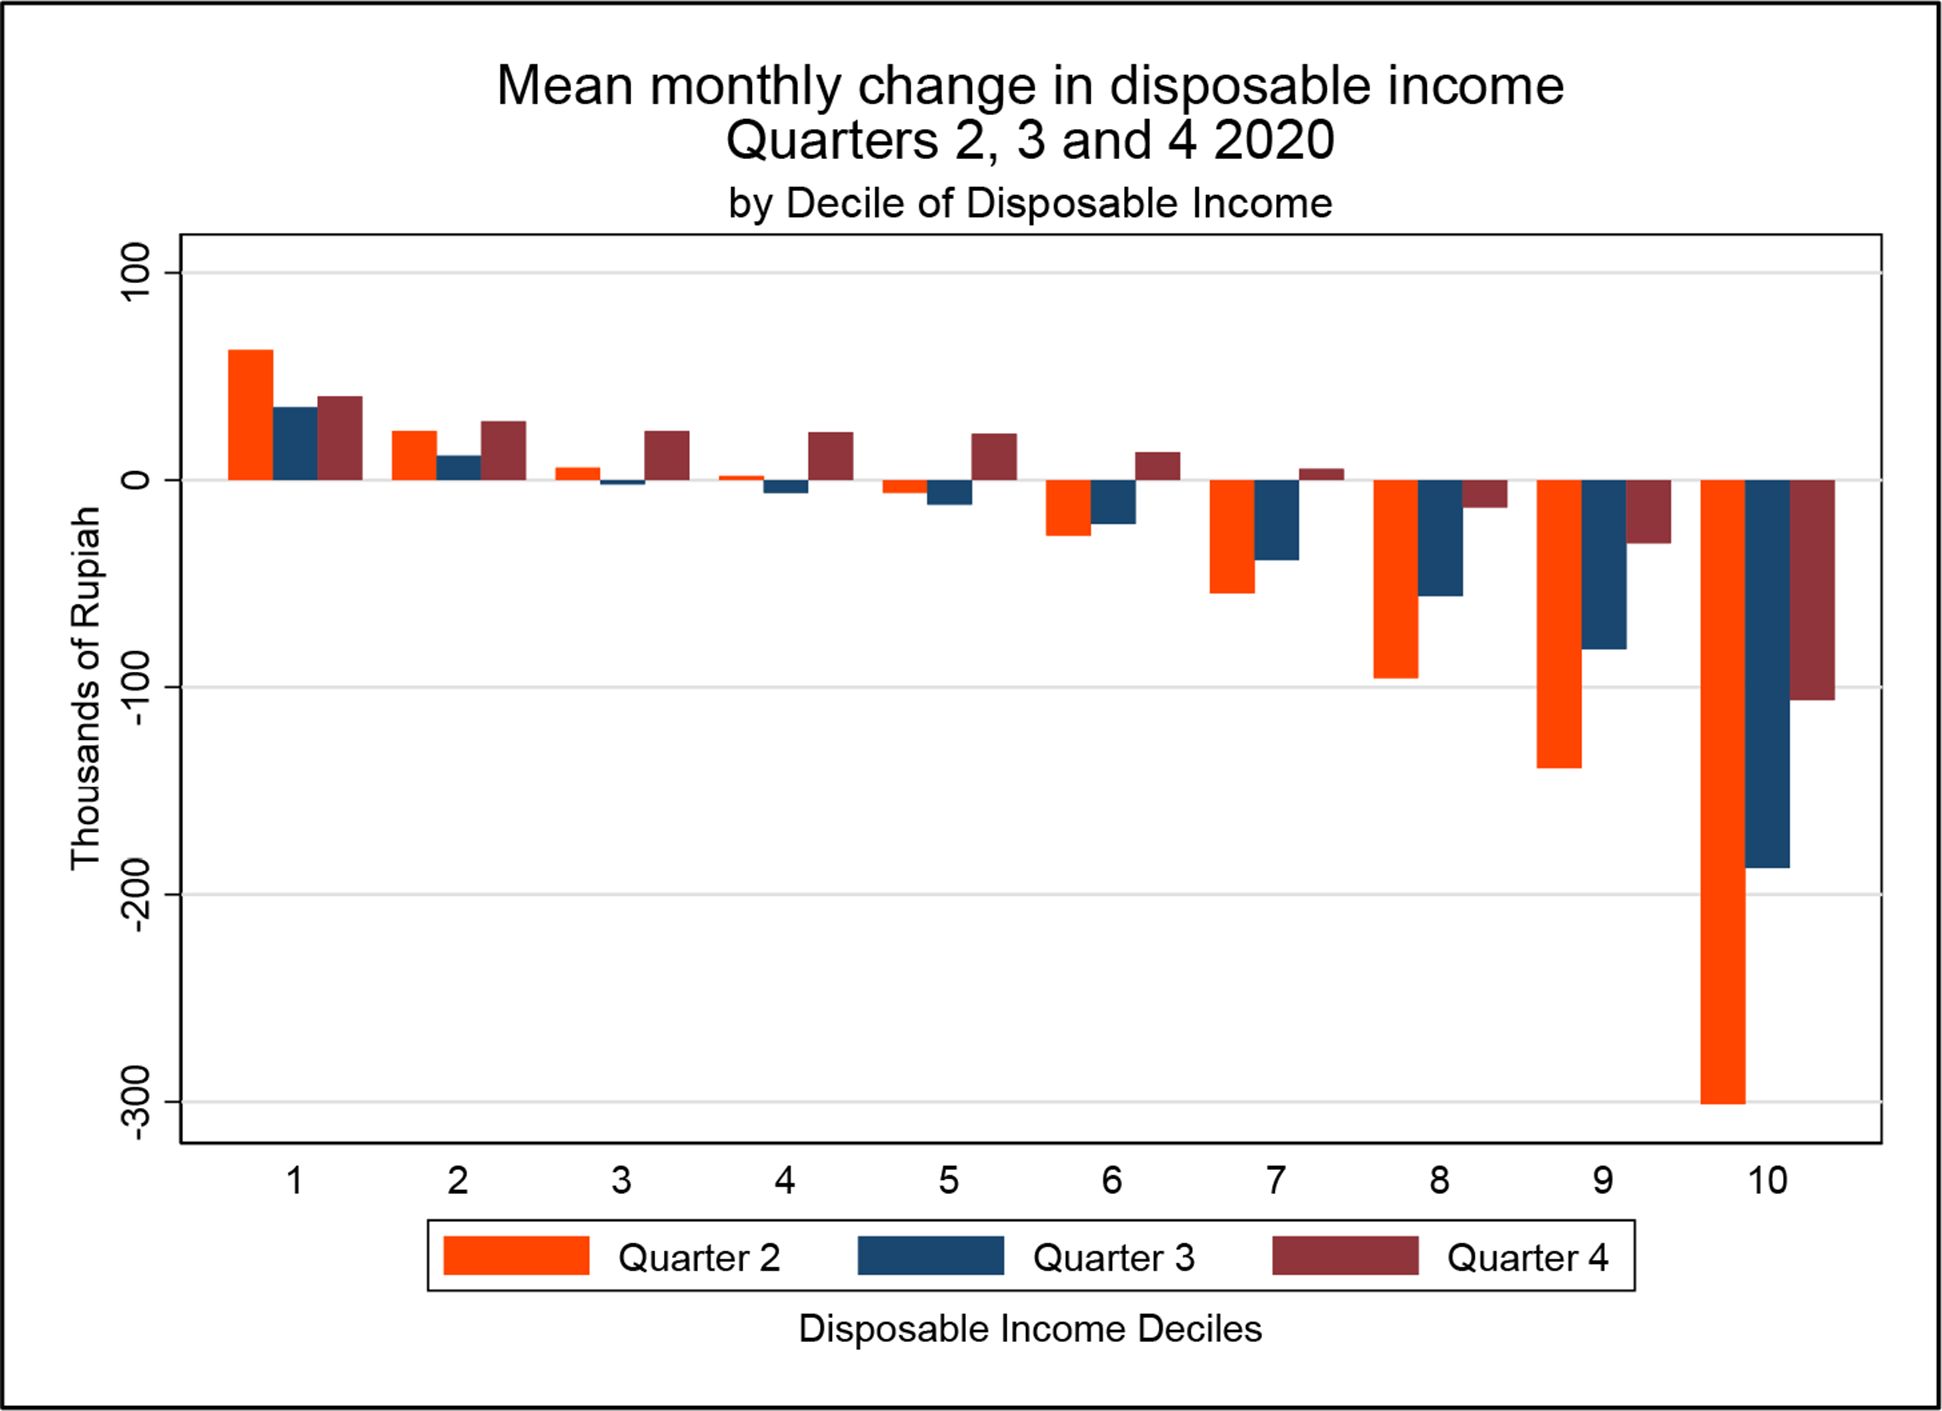
Change in mean monthly household disposable income in Indonesia by quarter in 2020. Source: Authors’ analysis using INDOMOD V2.1.
Tables
Tax and benefit policies modelled in INDOMOD for the 2019 policy year
| Policy | Description | Notes on simulation in INDOMOD |
|---|---|---|
| Benefits | ||
| Electronic Food Voucher/Basic Food Card, Bantuan Pangan Non Tunai, BPNT/Kartu Sembako | Electronic voucher for the poorest 15.6 million families in Indonesia forpurchasing basic foodstuffs | |
| Family Hope Program, Program Keluarga Harapan, PKH | Conditional cash transfer paid to the poorest 9.2 million families in Indonesia | Area level top-up for Eastern Indonesia (PKH Access) is not simulated |
| Smart Indonesia Program, Program Indonesia Pintar, PIP | Cash transfer paid to school age children from the poorest 25 percent of families in Indonesia | |
| Child Social Welfare Program, Program Kesejahteraan Sosial Anak, PKSA | Combines cash transfers with assistance from social workers and access to basic social services for children with a range of social problems | Only certain groups of children are simulated due to data constraints: those with disabilities and those who cannot be assigned a suitable caregiver |
| Social security contributions | ||
| Pension scheme, Jaminan Pensiun, JP | Mandatory scheme for all wage-recipient workers, apart from government, with both employer and employee (for JP and JHT) contributions. Employer contributions are also made for government workers to JKK and JKM. Voluntary contributions for non-wage-recipient workers. | Contributions are simulated for both government and non-government wage recipient workers. Contributions for non-wage recipient workers are not simulated as the contributions are voluntary and few actually contribute. |
| Casualty or work injury compensation scheme, Jaminan Kecelakaan Kerja, JKK | ||
| Survivors’ benefit scheme, Jaminan Kematian, JKM | ||
| Old age savings with disability benefit, Jaminan Hari Tua, JHT | ||
| Social insurance for government workers, PT Asabri and PT Taspen, part of Iuran Wajib Pegawai, IWP | Mandatory scheme for military, police, Ministry of Defence and civil servants (all other government employees and employees of state-owned enterprises) | |
| National Health Insurance, Jaminan Kesehatan Nasional, JKN, and Jaminan Kesehatan Nasional - Penerima Bantuan Iuran, JKN-PBI | Mandatory scheme with employer and employee contributions. Government makes contributions on behalf of the poorest 40 percent of families in the form of JKN-PBI. | Contributions for non-wage recipient workers and non-workers are not simulated in INDOMOD as the contributions are optional. Government contributions for veterans and pioneers of independence are not simulated. |
| Taxes | ||
| Personal income tax – labour income, Pajak Penghasilan Pribadi, PPP [Personal income tax for non-labour income is not simulated in INDOMOD as this would require more detailed income data] | There are four tax bands, and the amount of tax payable takes into account the presence of a spouse and the number of dependants (up to a maximum of three) | Income from employment is captured at the individual level in SUSENAS and then summed within a household. Due to data constraints, pension expenditure could not be deducted in the calculation of personal income tax. Income from lump sums is not taken into account. |
| Value-Added Tax on supply of goods and services, Pajak Pertambahan Nilai, PPN | The standard rate of VAT is 10%. The rate of VAT on cigarettes is 9.1% and the rate of VAT on pilgrimage/Hajj costs is 1%, and certain goods and services are VAT-exempt. | Of 258 purchasable items in SUSENAS, 109 are standard-rated (the rest are zero-rated or VAT-exempt). Cigarettes and pilgrimage/Hajj costs have VAT applied separately. SUSENAS records the amount paid for an item so VAT has to be deducted before expenditure data can be brought into the model and VAT simulated. |
Consumption based poverty and inequality in Indonesia, with and without social benefits, March 2020
| March 2020 BaselineA | March 2020 with no benefitsB | Difference(B-A) | |
|---|---|---|---|
| Share of poor population, in % | |||
| All | 6.81 | 15.43 | 8.62 |
| Poor households out of ... | |||
| ... male headed households | 6.70 | 15.26 | 8.56 |
| ... female headed households | 7.67 | 16.78 | 9.11 |
| ... households with children | 7.59 | 17.56 | 9.97 |
| ... households with older persons | 10.57 | 22.38 | 11.81 |
| Poverty gap (average normalised poverty gap, FGT(1)) | |||
| All | 0.89 | 5.33 | 4.44 |
| Poor households out of ... | |||
| ... male headed households | 0.88 | 5.19 | 4.31 |
| ... female headed households | 1.02 | 6.43 | 5.40 |
| ... households with children | 1.00 | 6.06 | 5.07 |
| ... households with older persons | 1.39 | 8.59 | 7.20 |
| Gini (household income) | 0.3723 | 0.4035 | 0.0312 |
| P80/P20 | 2.83 | 3.23 | 0.40 |
| Quantiles of distribution and median | IDR | ||
| 20th | 6,876,178.32 | 6,032,591.01 | -843,587.31 |
| 40th | 9,335,834.64 | 9,189,955.88 | -145,878.76 |
| 50th | 10,958,145.00 | 10,889,965.84 | -68,179.16 |
| 60th | 13,041,102.48 | 13,028,532.96 | -12,569.52 |
| 80th | 19,458,819.12 | 19,457,939.58 | -879.54 |
-
Source: Authors’ analysis using INDOMOD V2.1.
Consumption-based poverty and inequality in Indonesia in February, May, August and November 2020
| February 2020 BaselineA | May 2020B | Difference to baseline(B-A) | August2020C | Difference to baseline(C-A) | November 2020D | Difference to baseline(D-A) | |
|---|---|---|---|---|---|---|---|
| Share of poor population, in % | |||||||
| All | 6.81 | 8.30 | 1.50 | 7.47 | 0.66 | 6.56 | -0.25 |
| Poor households out of ... | |||||||
| ... male headed households | 6.70 | 8.30 | 1.60 | 7.49 | 0.79 | 6.55 | -0.15 |
| ... female headed households | 7.67 | 8.32 | 0.65 | 7.29 | -0.38 | 6.65 | -1.02 |
| ... households with children | 7.59 | 9.49 | 1.90 | 8.55 | 0.96 | 7.47 | -0.13 |
| ... households with older persons | 10.57 | 11.40 | 0.83 | 10.15 | -0.42 | 9.25 | -1.32 |
| Poverty gap (average normalised poverty gap, FGT(1)) | 0.89 | 1.45 | 0.56 | 1.21 | 0.32 | 1.01 | 0.12 |
| All | |||||||
| Poor households out of ... | |||||||
| ... male headed households | 0.88 | 1.46 | 0.58 | 1.23 | 0.35 | 1.02 | 0.14 |
| ... female headed households | 1.02 | 1.37 | 0.35 | 1.08 | 0.06 | 0.96 | -0.07 |
| ... households with children | 1.00 | 1.67 | 0.68 | 1.40 | 0.41 | 1.16 | 0.16 |
| ... households with older persons | 1.39 | 1.85 | 0.46 | 1.52 | 0.13 | 1.33 | -0.05 |
| Gini (household income) | 0.3723 | 0.3647 | -0.0076 | 0.3663 | -0.0060 | 0.3614 | -0.0109 |
| P80/P20 | 2.83 | 2.82 | -0.01 | 2.78 | -0.05 | 2.73 | -0.10 |
-
Notes: The household subgroups are not mutually exclusive.
-
Source: Authors’ analysis using INDOMOD V2.1.
Consumption-based poverty in Indonesia in February, May, August and November 2020 – without the extra COVID benefits
| February 2020 BaselineA | May 2020B | Difference to baseline(B-A) | August2020C | Difference to baseline(C-A) | November 2020D | Difference to baseline(D-A) | |
|---|---|---|---|---|---|---|---|
| Share of poor population, in % | |||||||
| All | 6.81 | 10.69 | 3.88 | 9.96 | 3.15 | 9.12 | 2.31 |
| Poor households out of ... | |||||||
| ... male headed households | 6.70 | 10.68 | 3.98 | 9.92 | 3.22 | 9.07 | 2.37 |
| ... female headed households | 7.67 | 10.79 | 3.12 | 10.24 | 2.56 | 9.51 | 1.84 |
| ... households with children | 7.59 | 11.99 | 4.40 | 11.15 | 3.56 | 10.20 | 2.60 |
| ... households with older persons | 10.57 | 14.25 | 3.68 | 13.52 | 2.95 | 12.75 | 2.18 |
| Poverty gap (average normalised poverty gap, FGT(1)) | 0.89 | 2.07 | 1.18 | 1.86 | 0.97 | 1.56 | 0.67 |
| All | |||||||
| Poor households out of ... | |||||||
| ... male headed households | 0.88 | 2.08 | 1.21 | 1.87 | 0.99 | 1.57 | 0.69 |
| ... female headed households | 1.02 | 1.98 | 0.96 | 1.79 | 0.77 | 1.53 | 0.51 |
| ... households with children | 1.00 | 2.34 | 1.34 | 2.10 | 1.11 | 1.76 | 0.76 |
| ... households with older persons | 1.39 | 2.54 | 1.15 | 2.36 | 0.97 | 2.07 | 0.68 |
| Gini (household income) | 0.3723 | 0.3863 | 0.0139 | 0.3844 | 0.0121 | 0.3808 | 0.0085 |
| P80/P20 | 2.83 | 2.96 | 0.13 | 2.94 | 0.11 | 2.91 | 0.08 |
-
Notes: The household subgroups are not mutually exclusive.
-
Source: Authors’ analysis using INDOMOD V2.1.
Contribution of COVID benefits to poverty reduction
| May% | August% | November% | |
|---|---|---|---|
| Increases to existing benefits | 43.5 | 43.5 | 35.8 |
| Cash support | 33.0 | 5.0 | 7.1 |
| Food assistance | 7.5 | 0.5 | 1.3 |
| Work-related benefits | 16.0 | 51.0 | 55.8 |
| Total | 100 | 100 | 100 |
-
Notes: ‘Increases to existing benefits’: PKH and BPNT; ‘Cash support’: cash transfer for non-Jabodetabek, NB. Village Fund cash transfer was applied in April only; ‘Food assistance’: basic food assistance for Jabodetabek; ‘Work-related benefits’: wage subsidy, pre-employment cards. See Annex 3 for more details about when each policy was introduced.
-
Source: Authors’ analysis using INDOMOD V2.1.
Tax and benefit instruments simulated in INDOMOD: Number of recipients/payers
| Tax–benefit policy | INDOMOD 2019A | External 2019B | Ratio 2019A/B |
|---|---|---|---|
| Income Tax (Pajak Penghasilan Pribadi, PPP) | 16.5M | 12.6M (a) | 131% |
| Government subsidised National Health Insurance (Jaminan Kesehatan Nasional Penerima Bantuan Iuran, JKN-PBI) | 121.7M individuals | 96.8M individuals (b) | 126% |
| National Health Insurance (Jaminan Kesehatan Nasional, JKN) | 91.5M individuals | 127.4M individuals (c) | 72% |
| Social Security Contribution (BPJS Ketenagakerjaan) | 48.1M wage recipient workers; 52.9M if include government workers for JKK and JKM | 30.6M active members (d) | 173% if include government workers for JKK and JKM |
| Social Security Contribution for civil servants (Iuran Wajib Pegawai, IWP) | 4.8M individuals | 4.2M civil servants (e) | 114% |
| Family Hope Program (Program Keluarga Harapan, PKH) | 8.1M households | 10.0M families (f) | 81% |
| Smart Indonesia Program (Program Indonesia Pintar, PIP) | 17.7M children | 20.1M children (g) | 88% |
| Child Social Welfare Program ( Program Kesejahteraan Sosial Anak , PKSA) | 0.41M children | Not available. | / |
| Electronic food voucher (Bantuan Pangan Non Tunai, BPNT) | 15.6M households | 15.6M families(BPNT) (g) | 100% |
| VAT (Pajak Pertambahan Nilai, PPN) | N/A | N/A | N/A |
-
Source: Column A: INDOMOD Version 2.1. Column B: (a) Provided by Ministry of Finance for 2019; (b) https://health.detik.com/berita-detikhealth/d-4377463/kado-tahun-baru-kuota-pbi-jk-bpjs-kesehatan-tambah And https://www.beritasatu.com/timboel-siregar/opini/6029/iuran-jkn-rakyat-miskin-ditanggung-apbn; (c) https://bpjs-kesehatan.go.id/bpjs/dmdocuments/0f13488b25e3985aed51f444d6607ec7.pdf; (d) https://www.bpjsketenagakerjaan.go.id//assets/uploads/laporan_tahunan/BPJS19_LO23_FS.pdf; 30.6M contributors out of 51M workers (e) https://www.bkn.go.id/wp-content/uploads/2020/04/e-Book-Statistik-Pegawai-Negeri-Sipil-Desember-2019.pdf; (f) https://kemsos.go.id/program-keluarga-harapan-pkh; (g) PKAPBN; (h) UNICEF.
Tax and benefit instruments simulated in INDOMOD: Annual amounts IDR
| Tax–benefit policy | INDOMOD 2019A | External 2019B | Ratio 2019A/B |
|---|---|---|---|
| Income Tax (Pajak Penghasilan Pribadi, PPP) | 114.6T | 148.9T (a) | 77% |
| Government subsidised National Health Insurance (Jaminan Kesehatan Nasional Penerima Bantuan Iuran, JKN-PBI) | 33.6T | 26.7T (b) | 126% |
| National Health Insurance (Jaminan Kesehatan Nasional, JKN) | 20.9T (employee)And 64.9T (employer) | 117.75T (c) | 73% |
| Social Security Contribution (BPJS Ketenagakerjaan) | 59.9T (employee)And 113.6T (employer) | 73.4T (d) | 236% |
| Social Security Contribution for civil servants (Iuran Wajib Pegawai, IWP) | 21.6T | 7.4T (e) | 292% |
| Family Hope Program (Program Keluarga Harapan, PKH) | 39.2T | 34.4T (f) | 114% |
| Smart Indonesia Program (Program Indonesia Pintar, PIP) | 10.6T | 11.0T (f) | 96% |
| BEN: Child Social Welfare Program (Program Kesejahteraan Sosial Anak, PKSA) | 0.41T | Not available | / |
| Electronic food voucher (Bantuan Pangan Non Tunai, BPNT) | 20.6T | 28.1T (h) | 73% (f) |
| VAT (Pajak Pertambahan Nilai, PPN) | 135.9T | 347.3 T (a) | 39% |
-
Source: Column A: INDOMOD version 2.1. Column B: (a) Laporan Keuangan Pemerintah Pusat (LKPP) The Central Government Financial Report, Provided by Ministry of Finance for 2019; (b) https://www.beritasatu.com/timboel-siregar/opini/6029/iuran-jkn-rakyat-miskin-ditanggung-apbn; (c) https://bpjs-kesehatan.go.id/bpjs/dmdocuments/0f13488b25e3985aed51f444d6607ec7.pdf; (d) https://www.bpjsketenagakerjaan.go.id/assets/uploads/laporan_keuangan/Laporan_Keuangan_Audit_2019_-_BPJS_Ketenagakerjaan.pdf https://www.bpjsketenagakerjaan.go.id//assets/uploads/laporan_tahunan/BPJS19_LO23_FS.pdf; (e) https://www.kemenkeu.go.id/media/15858/lkpp-2019.pdf; (f) PKAPBN; (g) UNICEF; (h) https://money.kompas.com/read/2019/08/17/060200826/2020-pemerintah-anggarkan-bantuan-pangan-non-tunai-rp-28-1-triliun-
Changes to benefit policies in 2020
| Policy | Amount of benefit (IDR) and periodicity of distribution | Relevant months in 2020 | Number of families/individuals targeted | Notes |
|---|---|---|---|---|
| PKH | 12(Jan-Dec) | 9.2 million families (Jan-Mar); increased to 10 million families (Apr-Dec) | The distribution of PKH, which was previously per 3 months, became per month from Apr-Dec 2020.Access part of PKH not simulated as it was not possible to obtain the necessary sub-district information for this part of PKH. | |
| Regular | 550,000 per year | |||
| Access | 1,000,000 per year | |||
| 1. Pregnant mother | 3,750,000 per year | |||
| 2. Baby/toddler | 3,750,000 per year | |||
| 3. Child in elementary school | 1,125,000 per year | |||
| 4. Child in junior high school | 1,875,000 per year | |||
| 5. Child in senior high school | 2,500,000 per year | |||
| 6. Disability | 3,000,000 per year | |||
| 7. Elderly | 3,000,000 per year | |||
| BPNT / Sembako | 150,000 per month (Jan-Mar); 200,000 per month (Apr-Dec) | 12(Jan-Dec) | 15.6 million families (Jan-Mar); increased to 19.4 million families (Apr-Dec) | |
| Basic food assistance for Jabodetabek | Apr-Jun 600,000 per month; Jul-Dec 300,000 per month | 9(Apr-Dec) | 2.2 million families | If not receiving PKH or BPNT |
| Cash transfer non-Jabodetabek | Apr-Jun 600,000 per month; Jul-Dec 300,000 per month | 9(Apr-Dec) | 9.2 million families in non-Jabodetabek non-rural areas | If not receiving PKH or BPNT |
| Village fund cash transfer | Apr-Jun 600,000 per month; Jul-Dec 300,000 per month | 9(Apr-Dec) | 8 million families in non-Jabodetabek rural areas | If not receiving PKH or BPNT |
| Cash support expansion | 500,000 per household, one off payment | N/A | 9 million families | If receiving BPNT but not PKH |
| Food assistance expansion | Aug-Oct, 15 kgs of rice per month | 3(Aug-Oct) | 9 million families | If receiving PKH but not BPNT.Rice price assumption=Rp12000/kgNot simulated in INDOMOD |
| Wage subsidy | Aug-Dec, IDR 2.4 Million, payable as two payments of 1.2 Million | 5(Aug-Dec) | 12.4 million employees | For individuals with employment income less than IDR 5 million per month, and registered as a BPJSTK member (in INDOMOD non-government wage recipient workers are used as proxy) |
| Pre-employment cards | Apr-Dec, payable over four months at 600,000 per month plus a final incentive payment of 150,000; averaged on-model to 637,500 per month for four months. | 9(Apr-Dec) | 5.6 million unemployed | For individuals who are unemployed and not receiving any social assistance. The training and survey allowances (IDR 1 Million per person) are not modelled in INDOMOD. |
-
Notes: In INDOMOD V2.1 households are used as the unit of analysis rather than families for the policies that are targeted at families. This is because in SUSENAS it is not possible to identify multiple families within a household. Districts eligible for Jabodetabek are treated as those within DKI Jakarta, Jawa Barat and Banten Provinces, i.e. Kepulauan Seribu, Jakarta Selatan, Jakarta Timur, Jakarta Pusat, Jakarta Barat, Jakarta Utara, Kabupaten Bogor, Kabupaten Bekasi, Kota Bogor, Kota Bekasi, Kota Depok, Kabupaten Tangerang, Kota Tangerang, and Kota Tangerang Selatan.
Sector codes
| Modified BPS sector categories | SUSENAS business sector categories |
|---|---|
| 1.Agriculture, livestock, forestry and fisheries | 1.Rice crop and palawija agriculture2.Horticulture3.Plantation4.Fishery5.Animal husbandry6.Forestry and other agriculture |
| 2.Mining and quarrying | 7.Mining and excavation |
| 3.Processing Industry | 8.Processing industry |
| 4.Electricity, gas and clean water | 9.Electricity, gas, steam/hot water, and cold air procurement10.Water management, waste water management, waste management and recycling, and remediation activities |
| 5.Building | 11.Construction |
| 6.Trade, hotel and restaurant | 12.Wholesale and retail trade, car and motorcycle maintenance14.Accommodation and food and beverage services |
| 7.Transport | 13.Shipment and storage |
| 8.Communication | 15.Information and communication |
| 9.Finance, rental and business services | 16.Financial and insurance activities17.Real estate18.Professional, scientific, and technical activities |
| 10.Services | 19.Rental and lease without option rights activities, labor force, travel agent, and other business support20.Government administration, defense, mandatory social security21.Education22.Human health and social activities23.Art, entertainment and recreational24.Other service activities25.Household activities as employer26.International agency activities and other international extra agencies |
Regression results from elasticity estimation
| Workplace | Transit | Retail | Workplace | Transit | Retail | |
|---|---|---|---|---|---|---|
| Agriculture, Forestry and Fishery | Mining and Quarrying | |||||
| Mobility | -0.236**(0.0937) | -0.0660(0.0732) | -0.0451(0.0695) | -0.105(0.233) | -0.0520(0.142) | -0.0534(0.239) |
| Quarter 3 (1=yes, 0=otherwise) | 1.610(1.137) | 0.782(1.730) | 0.318(1.500) | -3.251(3.756) | -3.182(4.071) | -3.229(5.065) |
| Bali (1=Yes, 0=otherwise) | -7.970***(1.825) | -5.695**(2.294) | -4.631***(1.429) | 2.031(4.400) | 2.407(4.445) | 2.938(4.678) |
| Papua (1=Yes, 0=otherwise) | -0.901(0.744) | -1.108(0.819) | -1.734*(0.946) | 19.87**(9.191) | 19.88**(9.093) | 19.26**(9.251) |
| Constant | -7.917***(2.184) | -5.580(3.713) | -3.509*(2.097) | -6.759(6.869) | -6.915(8.215) | -5.837(7.907) |
| Observations | 68 | 68 | 68 | 68 | 68 | 68 |
| R-squared | 0.130 | 0.056 | 0.043 | 0.120 | 0.120 | 0.119 |
| Manufacturing Industry | Electricity, Gas & Water Supply | |||||
| Mobility | 0.647**(0.265) | 0.292(0.295) | 0.0161(0.215) | 0.702***(0.153) | 0.279***(0.0946) | 0.219(0.179) |
| Quarter 3 (1=yes, 0=otherwise) | -4.946(3.816) | -4.805(4.342) | 0.511(6.380) | -3.898*(2.219) | -3.023(2.672) | -1.565(3.946) |
| Bali (1=Yes, 0=otherwise) | 6.527(4.399) | 3.378(7.048) | -4.477(5.198) | -3.950(3.134) | -8.412**(3.465) | -12.42***(4.127) |
| Papua (1=Yes, 0=otherwise) | -5.241**(2.454) | -5.193(3.413) | -3.708(3.077) | -5.202***(0.890) | -4.973***(0.999) | -2.128(1.768) |
| Constant | 9.912(7.686) | 9.325(16.06) | -5.504(6.684) | 13.39***(3.927) | 10.78**(5.076) | 2.906(5.566) |
| Observations | 68 | 68 | 68 | 68 | 68 | 68 |
| R-squared | 0.054 | 0.032 | 0.006 | 0.352 | 0.236 | 0.188 |
| Construction | Trade, Hotel & Restaurants | |||||
| Mobility | 0.170(0.232) | 0.290**(0.132) | 0.305(0.194) | 0.363***(0.120) | 0.286**(0.114) | 0.312***(0.0922) |
| Quarter 3 (1=yes, 0=otherwise) | -1.600(2.946) | -5.644*(3.077) | -5.513(4.209) | -0.372(1.589) | -2.631(2.462) | -2.695(2.244) |
| Bali (1=Yes, 0=otherwise) | 3.248(3.731) | 8.347**(3.501) | 5.522*(3.008) | -11.30***(2.562) | -9.671***(3.585) | -12.27***(2.199) |
| Papua (1=Yes, 0=otherwise) | 7.182**(3.222) | 6.195(3.916) | 9.688***(3.559) | 1.630**(0.738) | 1.085(0.911) | 4.610***(1.062) |
| Constant | -7.273(6.423) | 3.740(7.308) | -2.023(6.775) | -7.385**(3.042) | -1.318(5.833) | -6.669**(2.977) |
| Observations | 68 | 68 | 68 | 68 | 68 | 68 |
| R-squared | 0.035 | 0.107 | 0.088 | 0.350 | 0.401 | 0.378 |
| Transportation | Communication | |||||
| Mobility | 0.232(0.274) | 0.727***(0.169) | 0.0588(0.250) | -0.221(0.185) | -0.141(0.0975) | -0.141(0.146) |
| Quarter 3 (1=yes, 0=otherwise) | 8.663*(4.395) | -3.211(4.460) | 9.681(5.961) | 1.630(2.238) | 2.363(2.394) | 2.173(3.097) |
| Bali (1=Yes, 0=otherwise) | -11.79*(6.118) | 4.387(5.165) | -14.83**(5.818) | -8.837**(3.614) | -8.897***(2.568) | -7.404**(2.927) |
| Papua (1=Yes, 0=otherwise) | -25.06***(2.496) | -27.96***(3.957) | -24.13***(2.534) | -3.526**(1.666) | -3.351**(1.588) | -4.997**(2.020) |
| Constant | -29.32***(7.763) | 3.101(9.317) | -33.21***(8.979) | -2.436(4.431) | -4.374(5.532) | -1.357(4.419) |
| Observations | 68 | 68 | 68 | 68 | 68 | 68 |
| R-squared | 0.228 | 0.367 | 0.223 | 0.057 | 0.059 | 0.050 |
| Finance, Real Estate and Business | Services | |||||
| Mobility | 0.319***(0.0741) | 0.126**(0.0545) | 0.284*(0.163) | 0.0866(0.113) | 0.164**(0.0620) | 0.112(0.0961) |
| Quarter 3 (1=yes, 0=otherwise) | -3.523*(2.081) | -3.097(2.397) | -5.735(4.281) | 1.542(1.367) | -0.838(1.580) | 0.311(2.242) |
| Bali (1=Yes, 0=otherwise) | 1.976(1.919) | -0.0935(2.055) | 1.282(3.522) | 1.426(2.062) | 4.486**(1.730) | 1.846(1.919) |
| Papua (1=Yes, 0=otherwise) | -4.507***(0.875) | -4.396***(0.975) | -1.819(1.977) | 0.0463(0.837) | -0.535(0.707) | 1.024(1.064) |
| Constant | 3.070(1.864) | 1.807(2.966) | 3.991(5.028) | -6.420**(2.807) | 0.0636(3.377) | -5.074*(3.020) |
| Observations | 68 | 68 | 68 | 68 | 68 | 68 |
| R-squared | 0.068 | 0.039 | 0.092 | 0.066 | 0.135 | 0.083 |
Data and code availability
Please contact the authors for information on data and code availability.