Partition of the Life Course: An Extended Dynamic Microsimulation Analysis
- Keva, Finland
- Finnish Centre for Pensions, Finland
Cite this article
as: J. Salonen, H. Tikanmäki, S. Lappo; 2021; Partition of the Life Course: An Extended Dynamic Microsimulation Analysis; International Journal of Microsimulation; 14(3); 54-75.
doi: 10.34196/ijm.00241
Figures
Figure 1
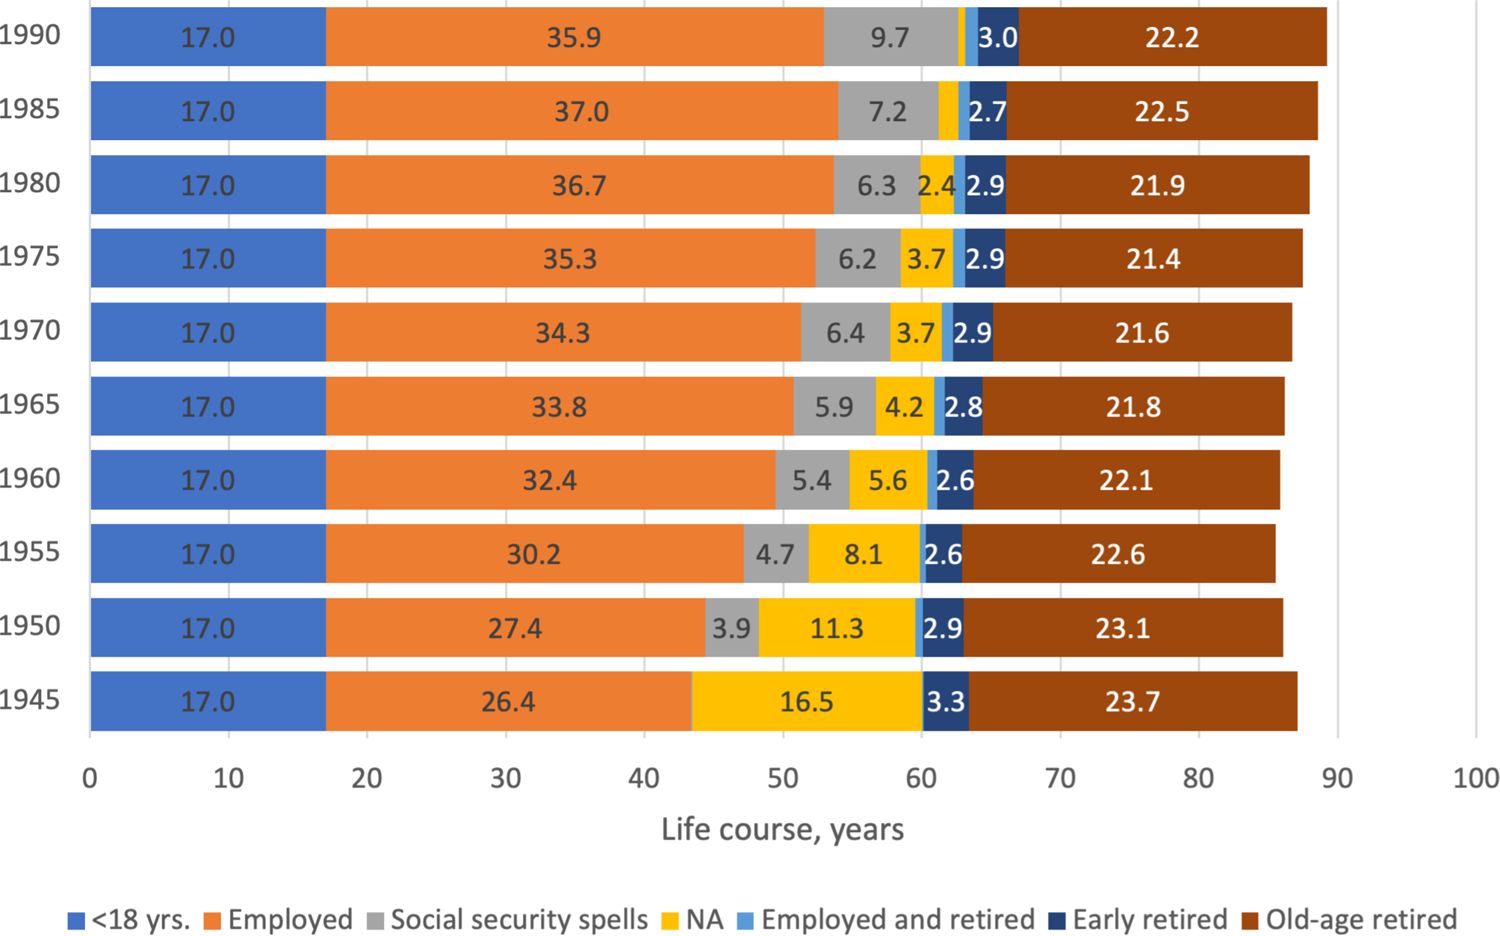
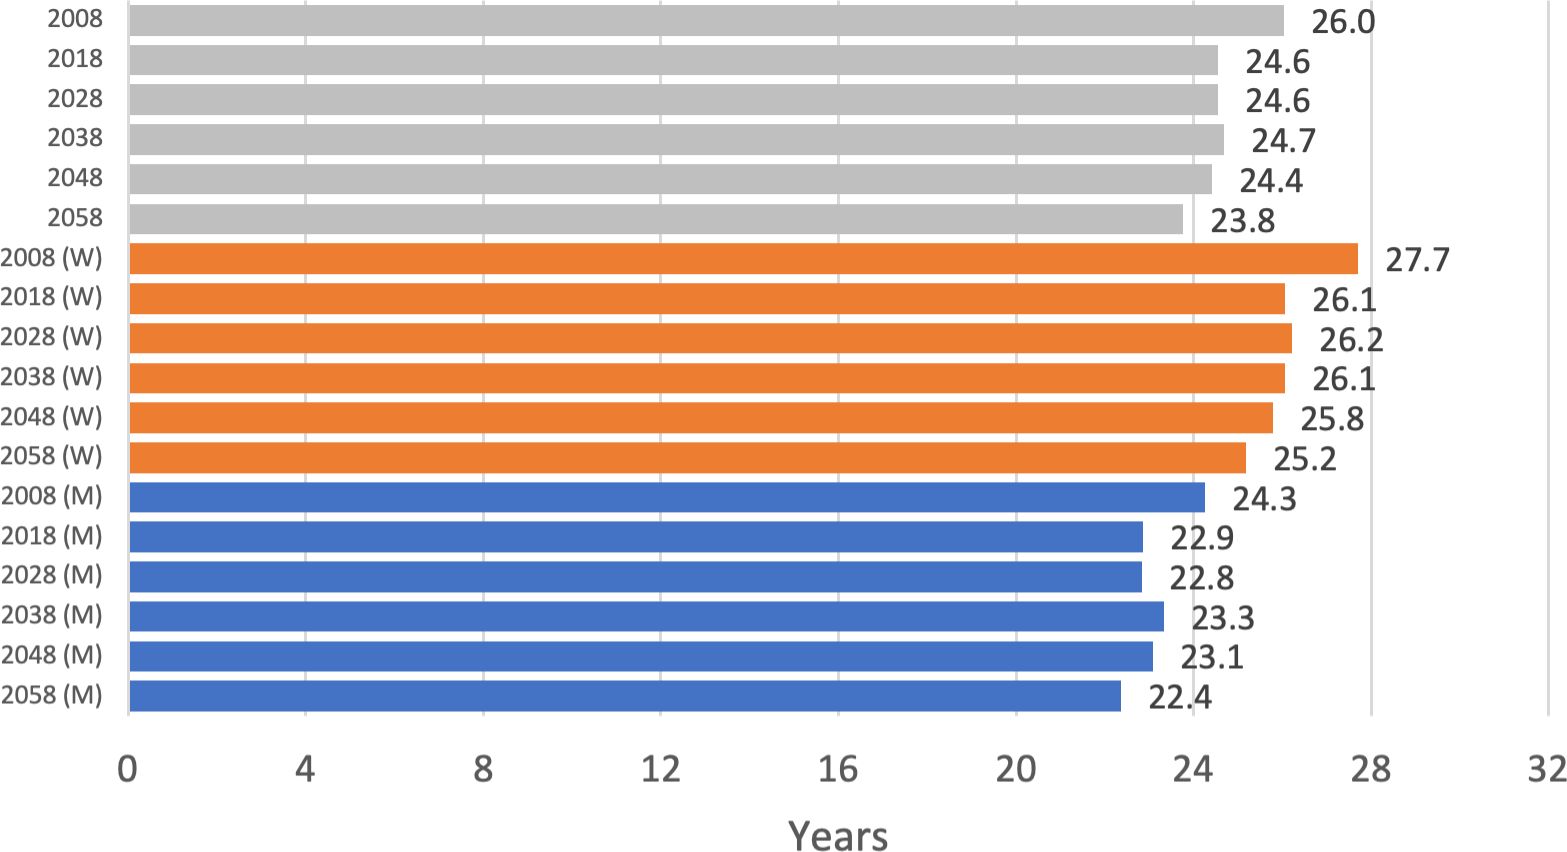
Partition of the life course for cohorts born in 1945–1990, years
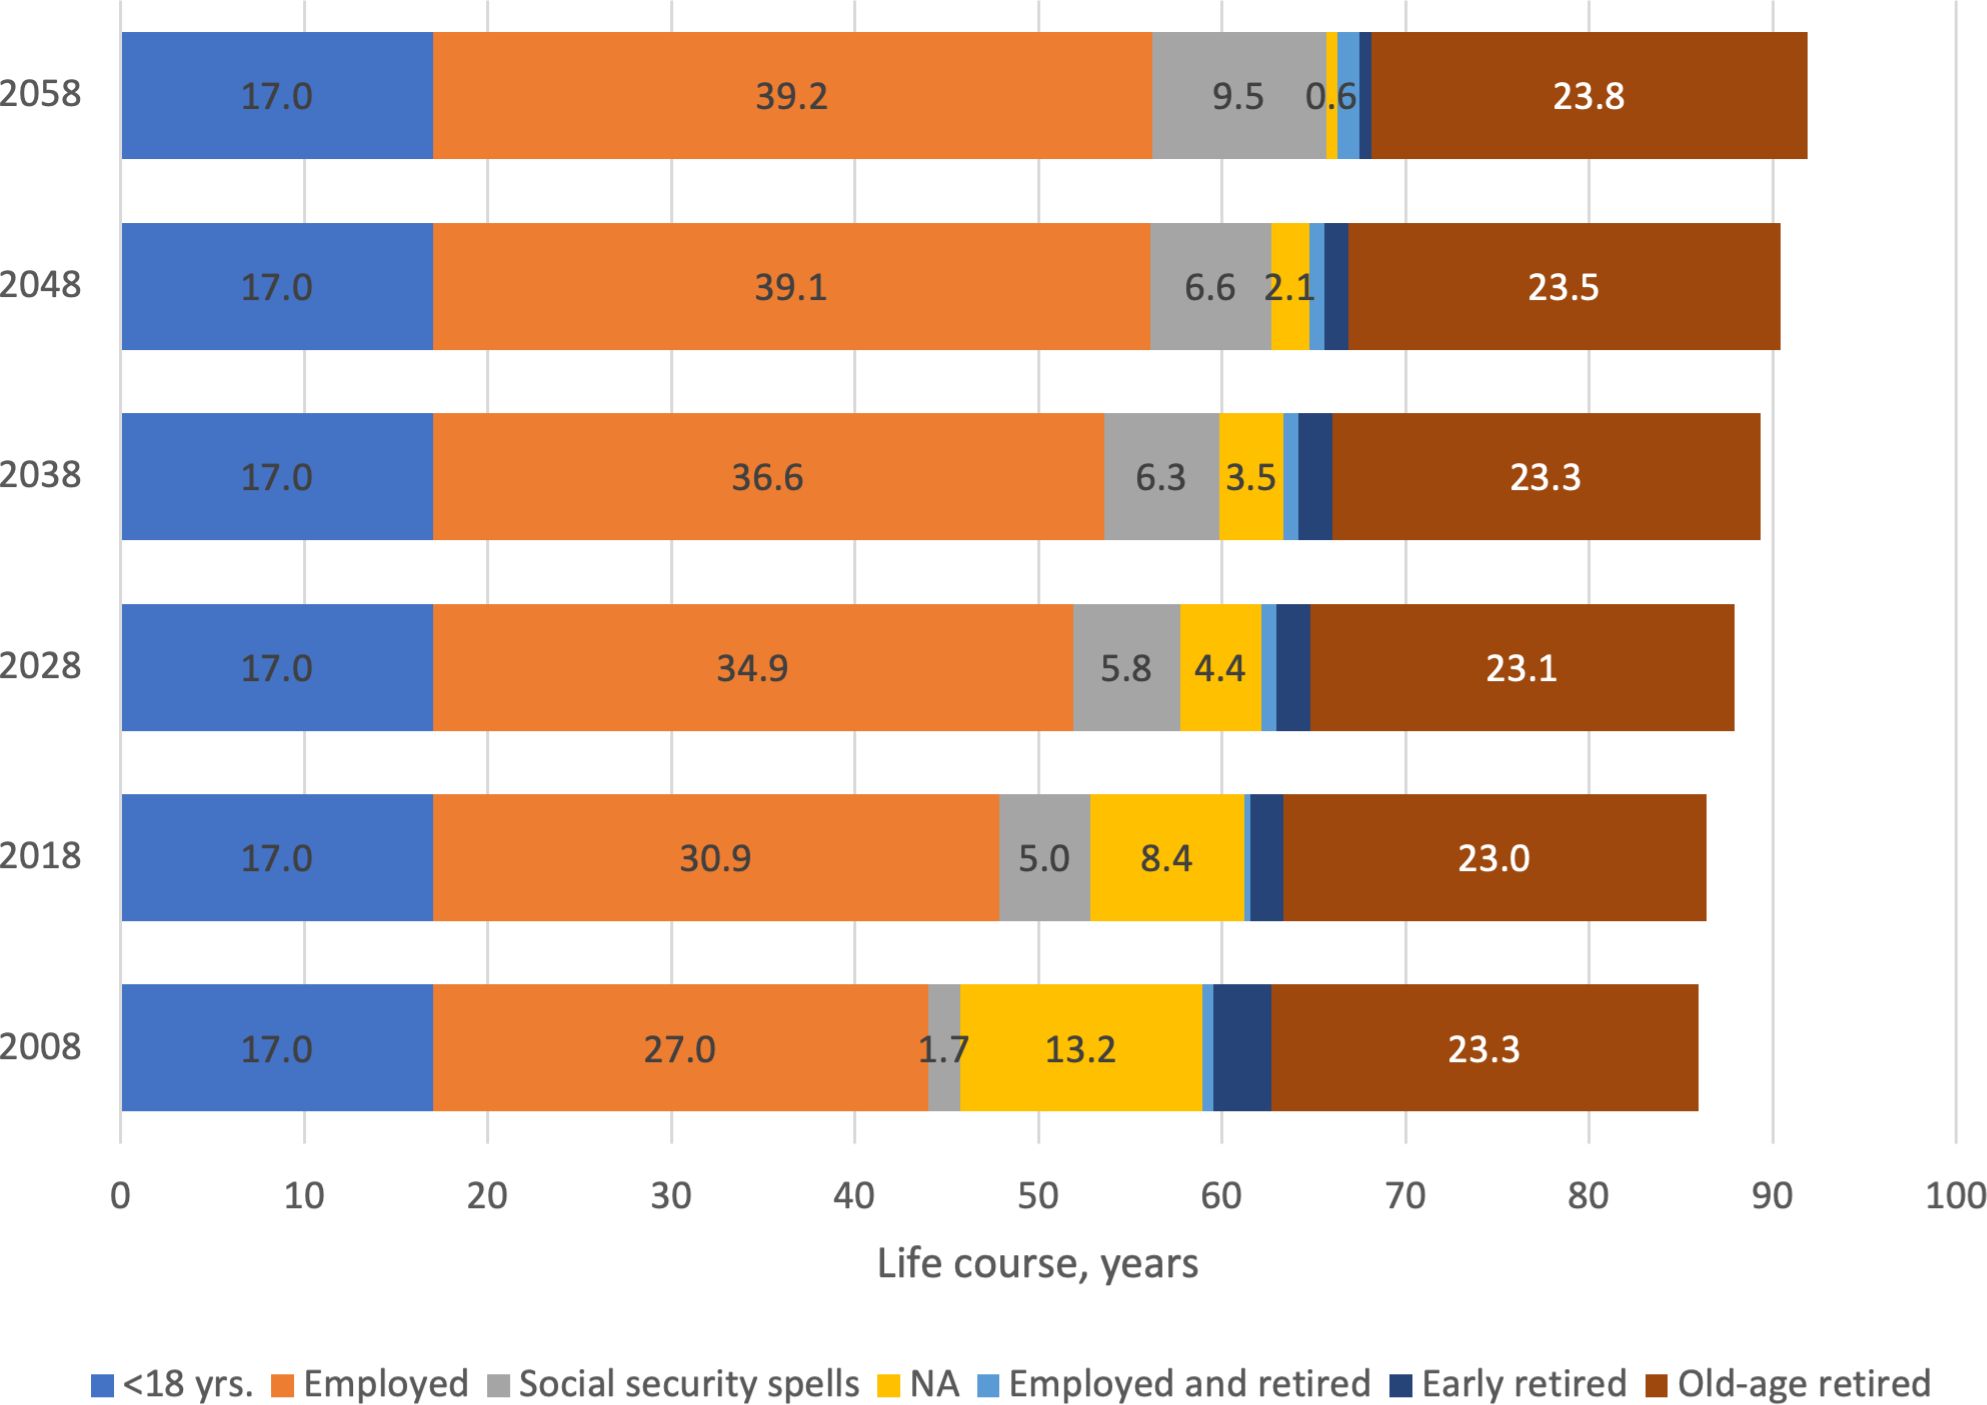
Figure 2

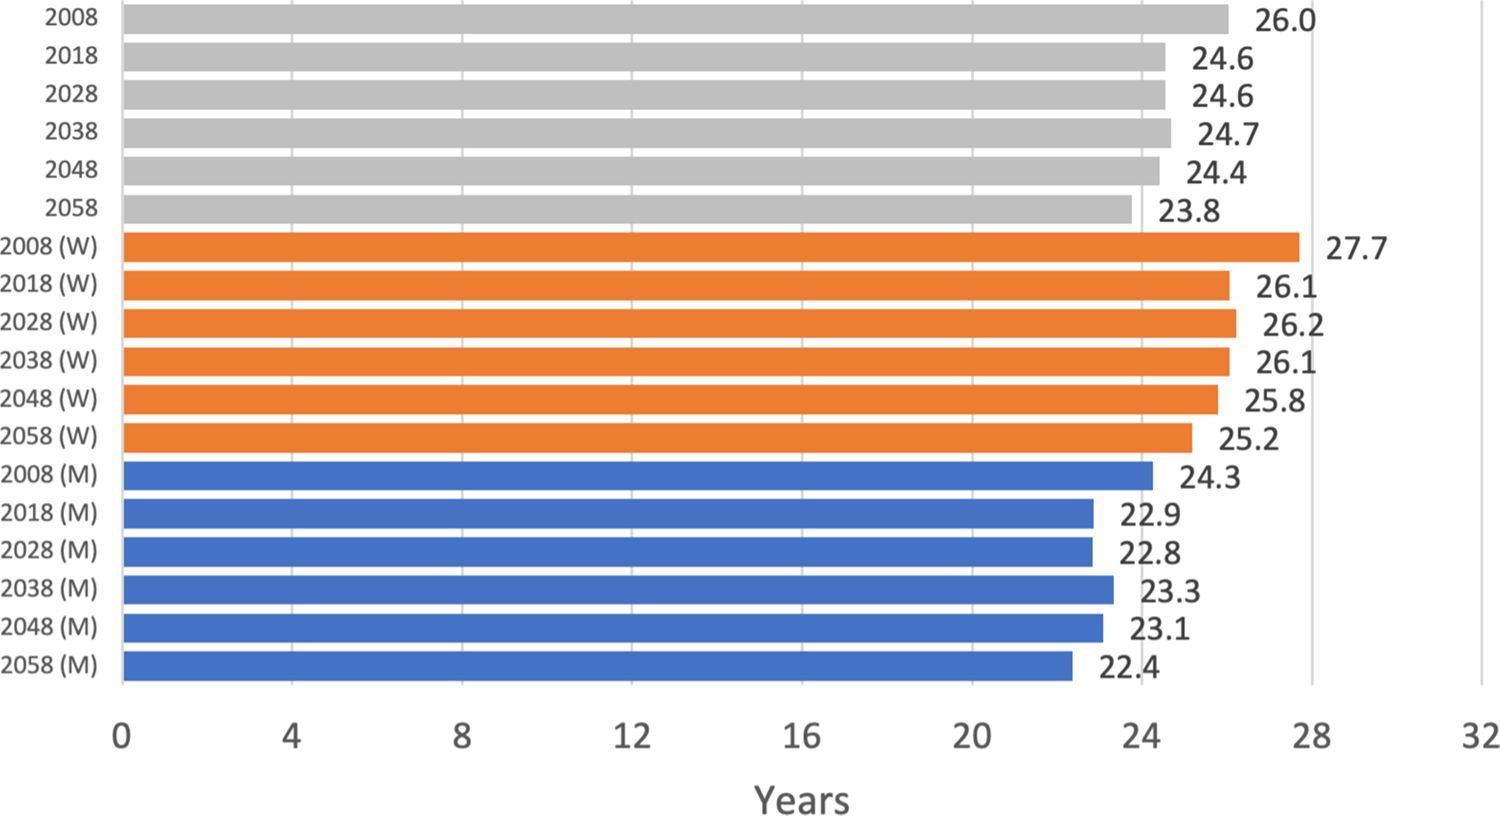
Partition of the life course for simulated retirees in 2008–2058, years
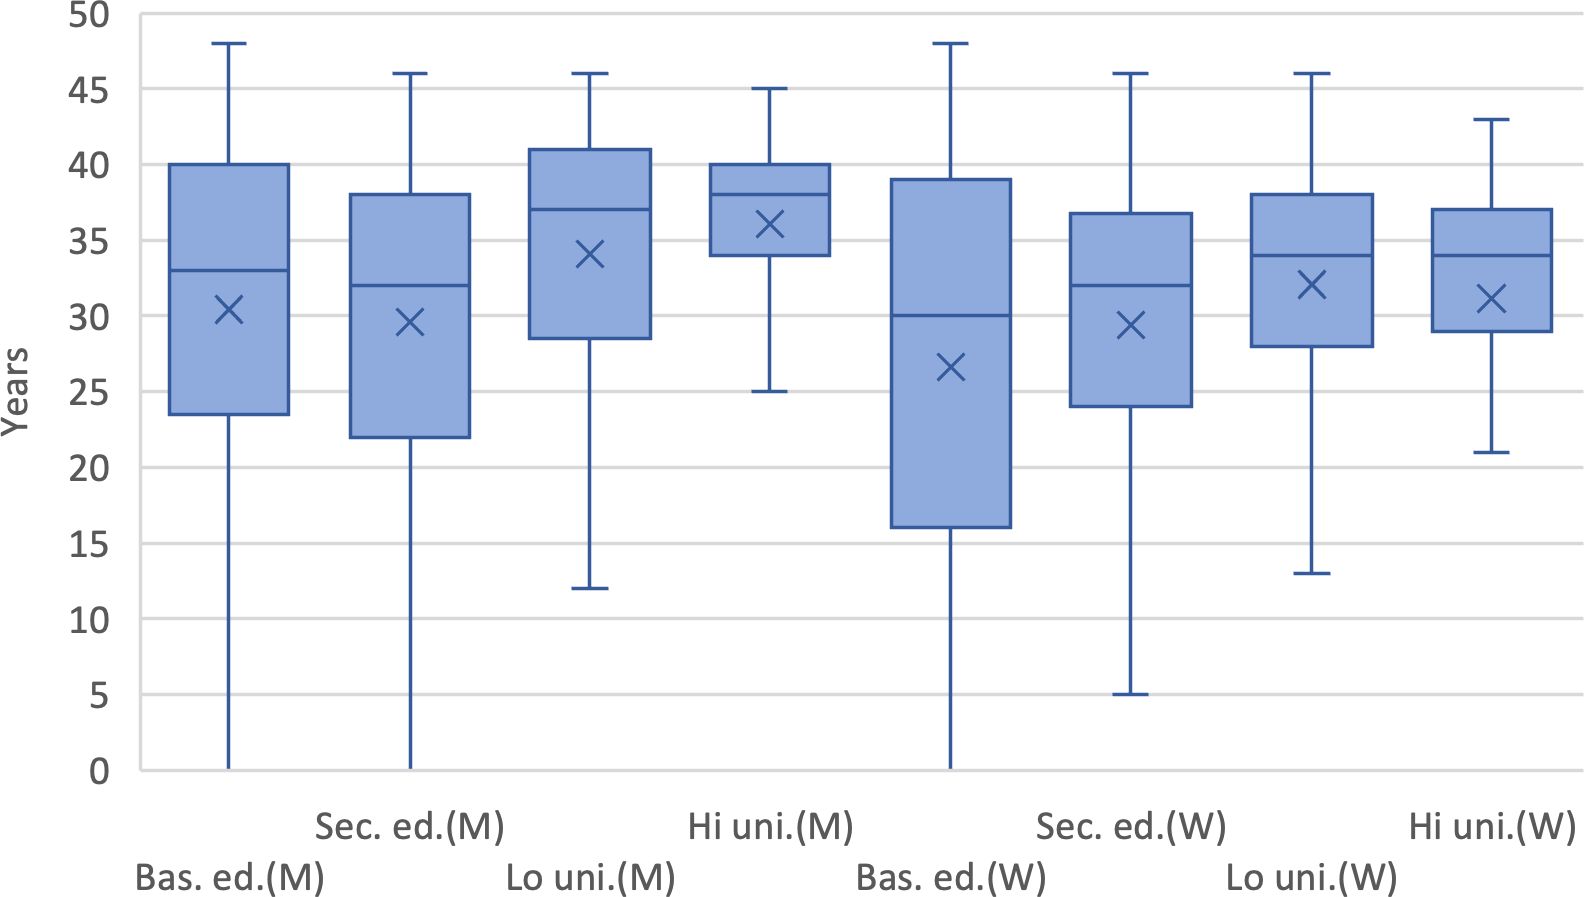
Figure 3

Distribution of the length of working life for retirees in 2018 by level of education and gender (M=men, W=women), years.In box and whisker plot, the box represents 50 per cent of the distribution and whisker ends 95 per cent. Line in the box is median and x is the mean.
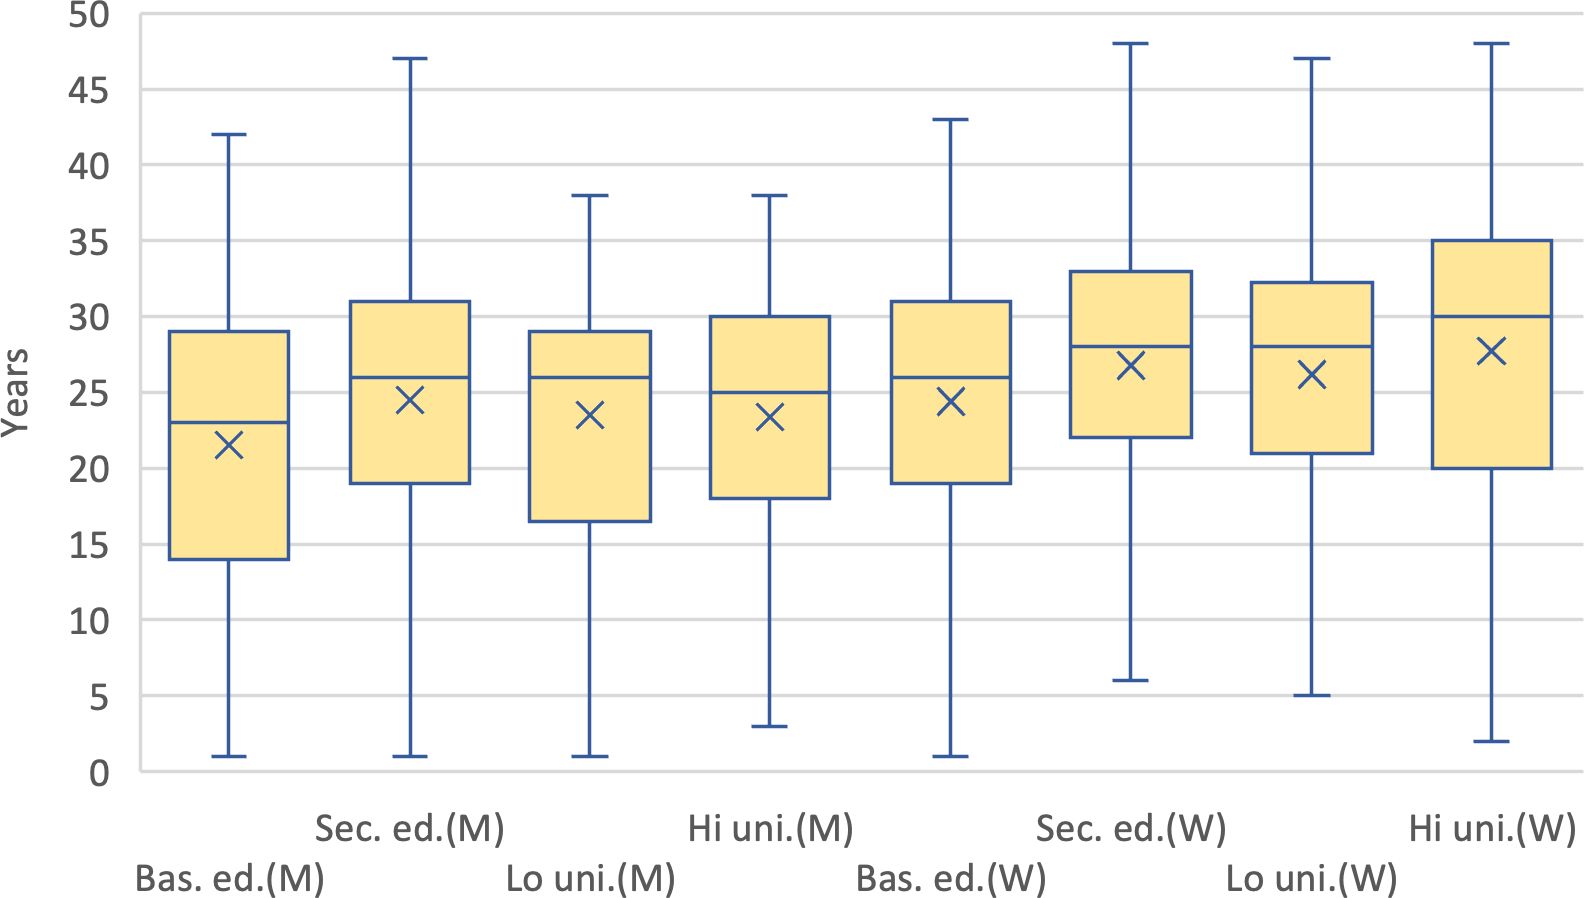
Figure 4

Distribution of the length of (total) retirement for retirees in 2018 by level of education and gender (M=men, W=women), years. In box and whisker plot, the box represents 50 per cent of the distribution and whisker ends 95 per cent. Line in the box is median and x is the mean.
Figure 5
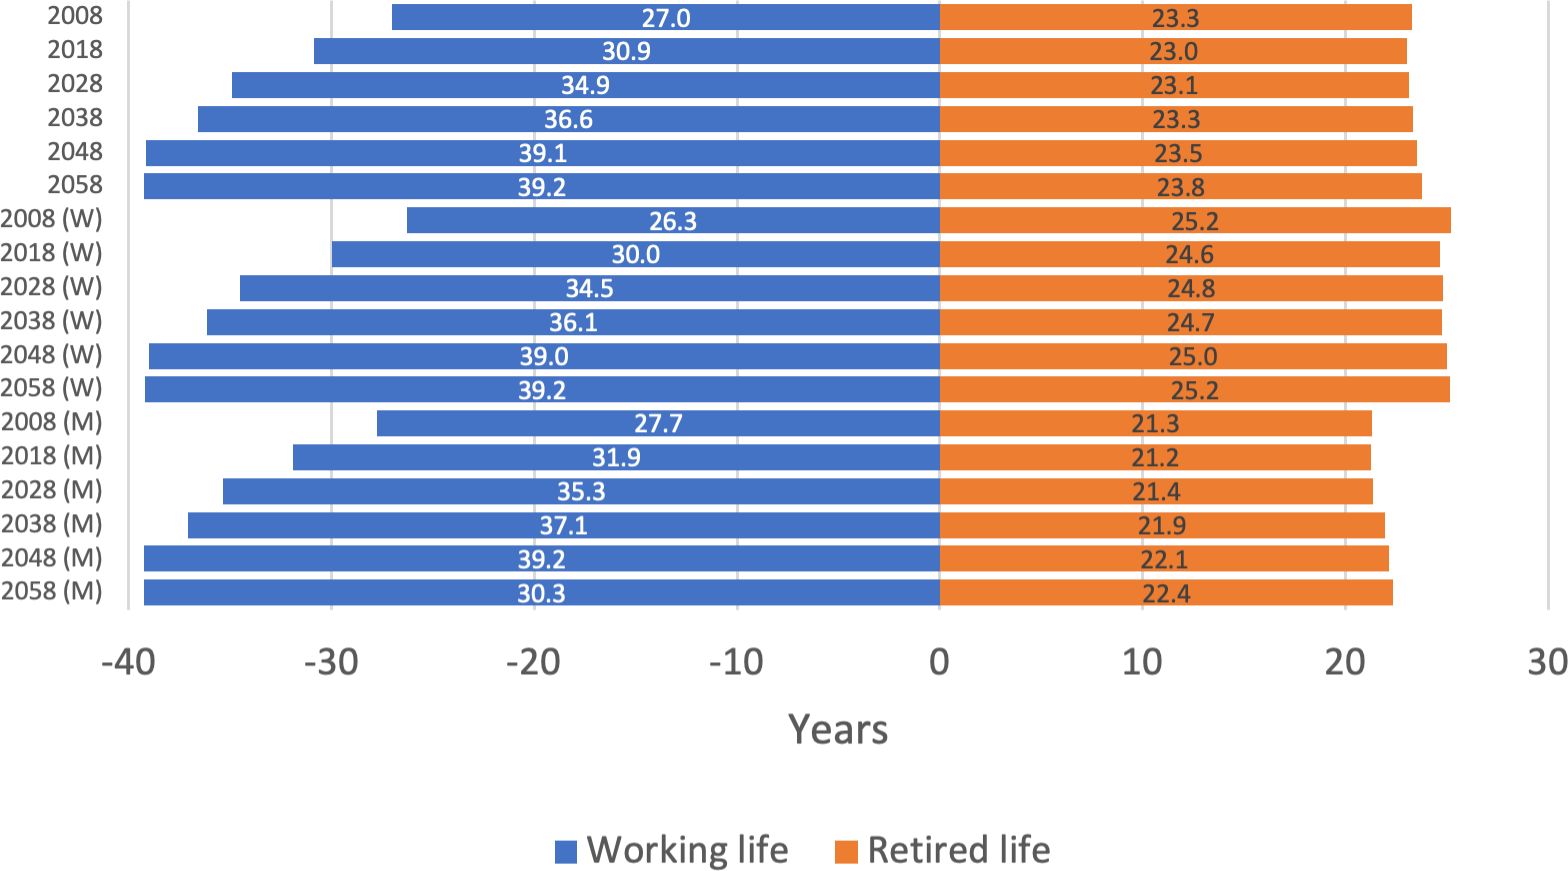
Average duration of retirement (including early retirement) by cohort and gender (M=men, W=women), years
Figure 6

Average duration of retirement (old-age pension) and duration of working life by cohort and gender (M=men, W=women), years
Tables
Table 1
Aggregation rules for life course stages in 1963–2090
| Life course stage | Rules 1963–1979 | Rules 1980–2008 | Contents 1963–2008 | Rules 2009–2090 | Contents 2009–2090 |
|---|---|---|---|---|---|
| Employed | Workdays > 0 | Workdays > 0 | Workdays based on pensionable employment contracts | 1,15,16 | Employed |
| Social security spells | Pension credited benefit days > 0 | Pension credited benefit days > 0orNo workdays and not drawing a pension | Increment for credited periods, including long-term unemployment, sickness and parental benefits | 2,3,4,13,19,20 | Long-term unemployed, on sickness benefit and permanently inactive |
| Employed and retired | NA | Drawing a pension > 0 and workdays > 0 | Workdays and on part-time pension or on disability pension | 5,10,11 | Employed and on partial disability pension or on partial old-age pension |
| Retired | NA | Drawing pension > 0 | Old-age pension, disability pensions, early old-age pension, unemployment pension and farmers’ special pension | 6,7,8,9,17,18,21,22 | Old-age pension, disability pensions, partial old-age pension and years-of-service pension |
| Old-age retired | NA | Drawing a pension > 0 | Old-age pension | 8,21 | Old-age pension |
| Early retired | NA | Drawing a pension > 0 | Retired excl. old-age pension | 6,7,9,17,18,22 | Retired excl. old-age pension |
| <18 yrs. | Adolescence (in compulsory education) | ||||
| NA | Not classified above |
-
Notes: Drawing a pension in one’s own right at 31 Dec. Workdays and employment cover both private and public sector employed and self-employed. Rules for 2009–2090 are based on ELSI model states, see Salonen (2020).
Table 2
Summary of indicators
| Duration of working life |
|---|
| Expectation based approach Based on a sample from microdata (LFS) Focus on labour force participation (employed or unemployed) Regularly updated The expected duration of working life for retirees in 2019 is 39 years |
| Duration of retirement |
| Expectation based approach Based on a sample from microdata (LFS) Fixed years available, retirees in 2018 The expected duration for retirees in 2018 is 22 years |
| Partition of the life course |
| Extended microsimulation approach Distributional measures of individual variation Based on total population including sub-populations Coherent individual life course stages Focus on pension accrual Early retirement and old-age retirement The average duration of retirement for the retirees in 2018 is 23 (old-age retired) or 24.6 (inc. early retirement) years The average duration of the duration of working life for the retirees in 2018 is 30.9 years |
Table 3
Distribution of the ratio (length of (total) retirement/length of working life) for retirees in 2008–2058
| Year | P10% | P25% | P50% | Mean | P75% | P90% |
|---|---|---|---|---|---|---|
| 2008 | 0.40 | 0.64 | 0.93 | 1.38 | 1.35 | 2.33 |
| 2018 | 0.31 | 0.55 | 0.78 | 1.08 | 1.06 | 1.65 |
| 2028 | 0.31 | 0.51 | 0.70 | 0.88 | 0.91 | 1.33 |
| 2038 | 0.33 | 0.51 | 0.67 | 0.80 | 0.86 | 1.19 |
| 2048 | 0.34 | 0.49 | 0.63 | 0.69 | 0.78 | 1.00 |
| 2058 | 0.35 | 0.49 | 0.61 | 0.65 | 0.76 | 0.91 |
Data and code availability
The data used in the study is from ELSI-microsimulation model. The policy regarding ELSI is; Proprietary, with executable not available. No specific software code has been developed for this study.
Download links
A two-part list of links to download the article, or parts of the article, in various formats.