A Spatially-explicit Microsimulation Analysis of a Proposed Sugar Tax in the Australian Capital Territory
- Statistical Consulting Unit, Australia
- Research School of Population Health, Australia
- Centre for Social Research and Methods, Australia
Abstract
This study aimed to estimate the spatially explicit impact of a 20% proposed tax on sugar sweetened beverage (SSB) consumption across small areas within the Australian Capital Territory (ACT). The study is important in the context of informing ongoing debate around a proposal to introduce a 20% tax on the sugar content of SSBs. A microsimulation analysis was used to estimate current expenditure on SSBs and the impact of a tax at a small area level across the ACT. Population data from the Census was used to weight survey data from the Household Expenditure Survey. A microsimulation model was then applied to the data to estimate current expenditure on SSBs, and the tax impact of a 20% sugar tax on SSBs. The impact of a sugar tax falls unequally across regions of the ACT with the tax impact representing a higher proportion of income for areas with lower socioeconomic advantage. The current expenditure ($/household/annum) averaged around $300 and the tax impact of the proposed sugar tax as a percentage of income averaged around 0.12%/household/annum. The unequal distribution of tax impact estimated by the model suggests that coupling the tax with targeted exercise and nutrition programs as well as systemic change will both be required to reduce inequalities and increase the likelihood of positive health outcomes around overweight and obesity and related conditions.
1. Introduction
In Australia, the Australian Institute of Health and Welfare (2019) has reported that an estimated 1.2 million adults self-reported as having diabetes in 2017-18, and that for every four diagnoses there is one undiagnosed case of diabetes. At the same time, the Australian Bureau of Statistics (2018) found that two thirds of Australian adults were overweight or obese, and almost one quarter of children aged 5-17 years were overweight or obese. Socioeconomic disadvantage is also associated with higher obesity and diabetes prevalence (Everson et al., 2002), cardio-vascular disease (Close et al., 2014) and cancer (Tervonen et al., 2017).
Excess sugar consumption can lead to overweight and obesity, in turn leading to heart disease, diabetes, and certain cancers (Schwimmer et al., 2019). Much of the excess sugar consumption derives from the consumption of sugar-sweetened beverages (SSBs). Examples of SSBs include Coke, Pepsi, Red Bull, Fanta, Sprite, Dr Pepper, and many others. A typical SSB contains 10 teaspoons of sugar per 375 ml can (Varsamis et al., 2017) and on average Australians consume 100 litres of SSBs per annum.
This nexus of evidence-based relationships between consumption of excess sugar, especially through SSBs, and health conditions such as obesity and diabetes, has led many countries to consider using a simple financial lever to achieve the desired population health outcomes of lower sugar consumption leading to lower rates of ill health. To curb excess consumption of unhealthy food, many countries have imposed taxes on specific food items such as soft drinks and sweets in an effort to increase economic dividend and improve health (Mytton et al., 2012; Cabrera Escobar et al., 2013). Typically this tax adds 20% to the price of a sugary drink, sometimes with a lower amount of say 10% depending on the amount of sugar in the drink.
A sugar tax has been shown to provide short to medium term weight decreases (Lal et al., 2017), positive impacts on the health and heath care budget (Veerman et al., 2016) and gains in productivity (Nomaguchi et al., 2017). Long-term health benefits such as reduction in obesity are also possible (Bes-Rastrollo et al., 2016), most likely in conjunction with other strategies. In the United States, Kim (2018) uses a tax microsimulation model similar to this paper. He combines it with estimates of the effect of income inequality on mortality in order to conclude that redistribution of taxes predicts large reductions in the total number of annual deaths among Americans. A recent systematic review has shown that a tax on SSB can deliver population weight benefits that are greater for lower socio-economic groups (Backholer et al., 2016).
Griffith et al. (2019) find that in their systematic review, all studies that investigate the effect of a sugar tax on prices found that the tax led to increased prices. Furthermore, most studies found that the tax also led to decreased purchases. These effects were not found to be uniform across population characteristics, including socio-economic status. In other words, in some studies, purchases fell most among high SES, in others, purchases fell most among low SES.
More recently, the World Bank (2020) have reported that over 40 countries have implemented SSB taxes. Evidence from these countries suggests that taxation is an effective policy lever with which to discourage high SSB consumption. Modelling also suggests that in the longer term, such taxes have the potential to improve population health in terms of reducing obesity and diet-related non-communicable diseases.
Despite this differential impact of a sugar tax across socio-economic strata and hence across physical regions in a country, there has been limited spatially explicit microsimulation of the impact of a sugar tax in Australia. An analysis at a high spatial resolution would offer an opportunity for redistribution of the revenue gained through tax targeted to these communities to support healthy eating programs, exercise interventions and easy access to low-cost healthy food options. Microsimulation models perform detailed analysis of specific activities based on the data at an individual level (Tanton, 2013). Microsimulation modelling is often used to evaluate the effect of proposed interventions before they are implemented in the real world, and are mainly used to simulate government programs, demographic and economic changes for current policies or alternative scenarios. They allow detailed assessment of policy changes on individuals or groups of individuals or even the whole population. This paper builds on traditional economic microsimulation analyses (e.g. Tanton et al., 2011) by adding a geographical aspect.
The analysis uses output from the Australian National University’s PolicyMod microsimulation model (Taylor, 2018). PolicyMod is a microsimulation model of the Australian Tax and Transfer system developed by the Centre for Social Research and Methods at the Australian National University: see https://csrm.cass.anu.edu.au/research/policymod for further information. PolicyMod is capable of modelling most components of the Australian personal income taxation and transfer system including existing and alternative policy settings.
The aim of this paper is to provide a spatially explicit model for the analysis of national policies at the small-area level. In particular, the paper shows how microsimulation modelling can be employed to shed light on the local impacts of major national policy changes such as a sugar tax. With a focus on the Australian Capital Territory (ACT), we estimate the impact of a proposed SSB tax on overall tax paid by ACT residents at a small-area level. We also examine the differences in impact according to area-level socio-economic disadvantage.
2. Methods
The data we assembled to answer this question consisted of the ABS Household Expenditure Survey (HES) of 2015, and the Census of 2016. Expenditure categories in the HES that we use comprise soft drinks, energy drinks, sports drinks and iced tea. Census variables that we use are shown in Table 1. The algorithm adjusts the household weights in the HES based on various Census benchmarks. These adjusted weights are used to calculate total expenditure on SSBs from the HES, total expenditure per person, and total expenditure per person under a 20% tax on sugar in SSBs. Calculations are performed at Statistical Area Level 2 (SA2), which divide Australia into medium-sized areas that represent a community, such as a suburb, that interacts both socially and economically. Table 2 gives the context of a summary of descriptive statistics for ACT households from HES, showing the distribution of households, population, SSB spending and total income by various ranges of weekly income and % of SSB expenditure. The table shows that households with a higher proportion of spending on SSBs tend to have lower average incomes.
Benchmarking categories from Census.
| Variable | Categories |
|---|---|
| Age | 15-34, 35-54, 55+ |
| Sex | m/f |
| Labour force status | Employed/not working |
| Education status | Higher degree/diploma/year 12 or less |
| Mortgage payments per month | Up to $1,200 $1,200 up to $1,800 $1,800 up to $2,600 Over $2,600 |
| Rent payments per week | Up to $175 $175 up to $300 $300 up to $400 Over $400 |
| Household income per week | Low income (up to $650 per week) Middle income ($650 to $1,000 per week) Upper middle income ($1,000 to $2,500 per week) High income (over $2,500 per week) |
| Occupation group | Professionals, tradespersons & labourers, admin and service workers |
| Family type | Couple with children, couple without children, single parent, lone person |
| People in household | 1 to 5 |
-
Source: Authors.
Descriptive summary of the Household Expenditure Data for the ACT.
| Type | Households | Population | SSB exp ($m) | Total income ($b) | % SBD exp per household | Ave Income |
|---|---|---|---|---|---|---|
| Total | 156,917 | 407,650 | $119.8 | $19.716 | 0.61% | $125,650 |
| Weekly income | ||||||
| -$1000 | 8.3% | 3.9% | 3.0% | 2.3% | 0.79% | $35,270 |
| $1000-$1250 | 9.9% | 6.4% | 3.6% | 4.7% | 0.47% | $59,310 |
| $1250-$1500 | 6.5% | 3.6% | 2.2% | 3.8% | 0.35% | $72,841 |
| $1500-$1750 | 8.0% | 5.7% | 4.2% | 5.5% | 0.46% | $85,655 |
| $1750-$2000 | 10.9% | 9.8% | 8.2% | 8.4% | 0.59% | $97,109 |
| $2000-$2250 | 7.8% | 7.7% | 6.3% | 6.9% | 0.55% | $111,023 |
| $2250-$2500 | 8.5% | 8.0% | 6.6% | 8.3% | 0.48% | $122,504 |
| $2500-$2750 | 5.6% | 7.2% | 4.1% | 6.1% | 0.41% | $136,750 |
| $2750-$3250 | 13.2% | 17.5% | 21.0% | 16.2% | 0.79% | $154,832 |
| $3250-$4000 | 9.0% | 11.6% | 8.5% | 13.6% | 0.38% | $190,134 |
| $4000-$7000 | 12.3% | 18.5% | 32.2% | 24.2% | 0.81% | $246,934 |
| % of weekly income spent on SSB | ||||||
| 0.0% | 25.7% | 21.3% | 0.0% | 22.1% | 0.00% | $107,831 |
| 0.00%-0.1% | 17.6% | 18.8% | 5.0% | 22.2% | 0.17% | $158,108 |
| 0.10%-0.2% | 13.9% | 15.5% | 10.6% | 15.2% | 0.51% | $137,689 |
| 0.20%-0.3% | 6.8% | 6.8% | 7.4% | 6.9% | 0.79% | $127,291 |
| 0.30%-0.4% | 10.1% | 10.6% | 16.9% | 10.7% | 1.16% | $132,603 |
| 0.40%-0.5% | 5.1% | 7.0% | 12.7% | 5.0% | 1.88% | $120,939 |
| 0.50%-0.8% | 12.3% | 13.6% | 29.8% | 12.6% | 1.73% | $129,389 |
| 0.75%-1.0% | 4.8% | 3.7% | 8.8% | 3.6% | 1.77% | $95,015 |
| 1.00%-4.0% | 3.6% | 2.8% | 8.8% | 1.7% | 3.70% | $60,276 |
-
Source: ABS Catalogue 6530.0 - Household Expenditure Survey, Australia: 2015-16, November 2017.
The process for reweighting HES weights is as follows. For each SA2 region, the household weight for each HES record is adjusted, based on the eight benchmark categories above and the two characteristics of the HES person record (Table 1), so that the sum of adjusted household weights over the HES sample matches the total population of the SA2 (according to the most recent census). The adjustment is done using the generalised regression method (Bell, 2000). The result is a static, spatially reweighted microsimulation model. Persons aged 0 – 15 years are accounted for indirectly, in the benchmarks via the family type and number of people in the household. The age, sex and labour force benchmarks are combined to create a single variable with 12 categories, and 0 – 15 year olds do not have a labour force status. Occasionally the reweighting algorithm cannot converge using all eight benchmarks, for example when the SA2 has properties that are significantly different from the “average”, such as no low rent or mortgage payments in a wealthy suburb or only a small number of large family units in an inner-city area. In this case one of the benchmarks is dropped and the process re-run until convergence is reached. Most SA2s, however, converge on the first attempt, which gives the best estimate of SA2 weight. For each SA2, the new adjusted weights are used to calculate total expenditure in sugary drinks (which is a HES variable), the total expenditure per person in the SA2 and also the scenario when expenditure is 20% higher due to the imposition of a sugary drinks tax.
To validate the estimates from the model, we have used the approach of Tanton et al. (2011), referring back to the ABS expenditure data (HES) in this context, and making a comparison between the aggregated model estimates and total ACT expenditure on SSBs from HES. Specifically, using the observations in the 2015-16 HES (reweighted to the ACT population from the 2015-16 Census and inflated to 2016 to match the small area estimation in this paper), we estimate SSB expenditure for the ACT to be $119.8 million. Using the available HES household replicate weights from HES, we calculate a 95% confidence range for SSB expenditure of $83.2 million to $156.3 million.
Based on the 95 most populous SA2s in the ACT (out of 110), our model estimates total annual expenditure on sugary drinks to be $107.4 million. The remaining 15 SA2s had populations under 50 at the time of the HES and are omitted from the model estimation process.
Our estimate of expenditure from the microsimulation model, $107.4 million, is within the 95% confidence interval, confirming that the estimate is well within the range of values that could be expected from the HES. The estimate is also 89% of the size of the HES estimate. Taken together, this evidence suggests that the model results are validated for the outcomes under consideration in this framework.
3. Results
Figure 1 shows the spatial distribution by SA2 of current SSB expenditure, and the spatial distribution of the modelled tax impact under the 20% tax. Blues and greens are lower expenditure, and reds and yellows are higher expenditure. We can see the higher expenditure, and higher impact, in the outer suburbs of Canberra to the north and south. These estimates are not sensitive to the choice of reweights, nor to the choice of benchmarks (results not shown).
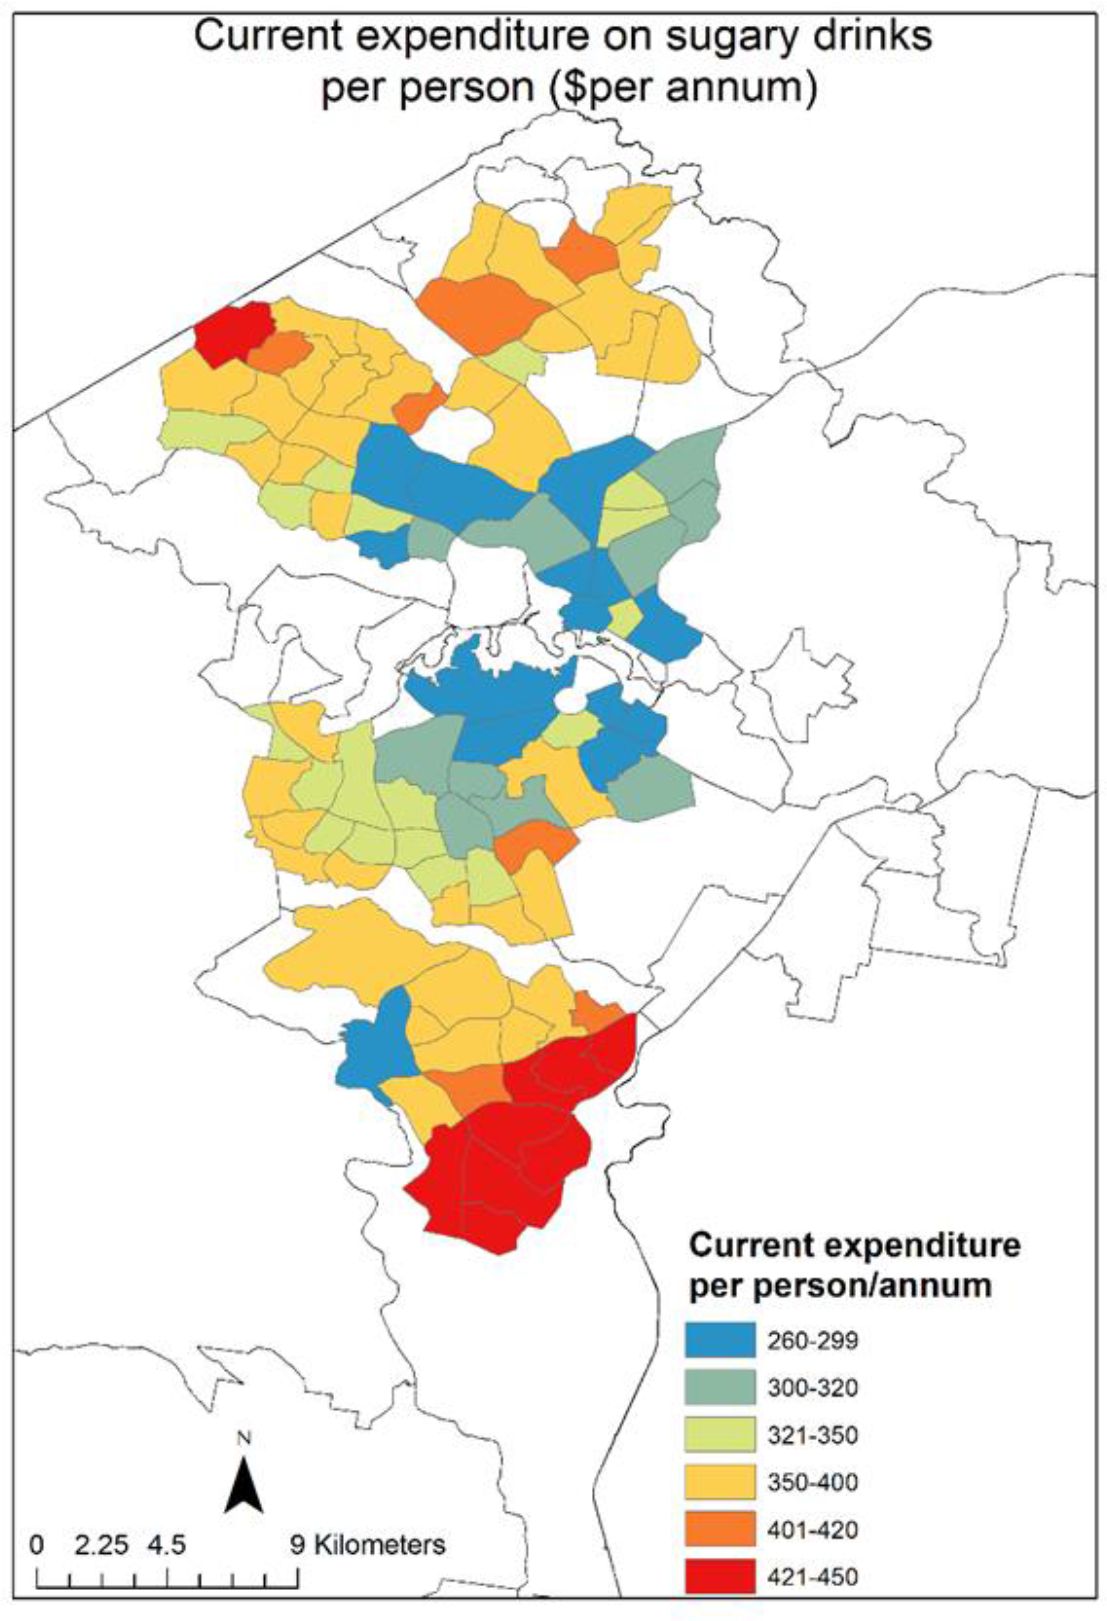

Expenditure on SSBs by SA2 in the ACT: current expenditure ($/person/annum). Source: Authors.
The current annual expenditure on SSBs in ACT SA2s ranges from $250 to $450 and the impact of a 20% SSB tax as a proportion of income is estimated to range from 0.066% to 0.168% (Figure 2). The relationship between the current expenditure as a percentage of income, the modelled tax impact, and the ABS index of relative advantage and disadvantage (IRSAD) is shown in Figure 2. IRSAD summarises information about economic and social conditions allowing for disadvantage and lack of advantage to both be included. As IRSAD increases, expenditure as a percentage of income decreases in a moderately linear fashion (R2 = 0.6443) from about 0.9% of income in the most disadvantaged SA2s to 0.3% of income in the least disadvantaged SA2s. Similarly as IRSAD increases, the impact of the tax as a percentage of income decreases from 0.9% of income in the most disadvantaged SA2s to 0.3% of income in the least disadvantaged SA2s. The correlation between was -√0.6443 = -0.8027. This correlation means that lower socioeconomic advantage relates to a higher proportion of income spent on SSBs.

Current expenditure on SSBs by SA2 in the ACT % income /annum) by relative socio-economic advantage and disadvantage (IRSAD). Source: Index of Relative Socio-economic Advantage and Disadvantage from ABS 2033.0.55.00 – Census of Population and Housing: Socio-Economic Indexes for Areas (SEIFA), Australia, 2016. SSB Tax impact from authors.
Figure 3 concentrates on the top 20 and the bottom 20 SA2s in terms of current expenditure, estimated tax paid and estimated new expenditure. The difference between the top twenty and the bottom twenty SA2s in terms of annual tax impact is around $25 per person.
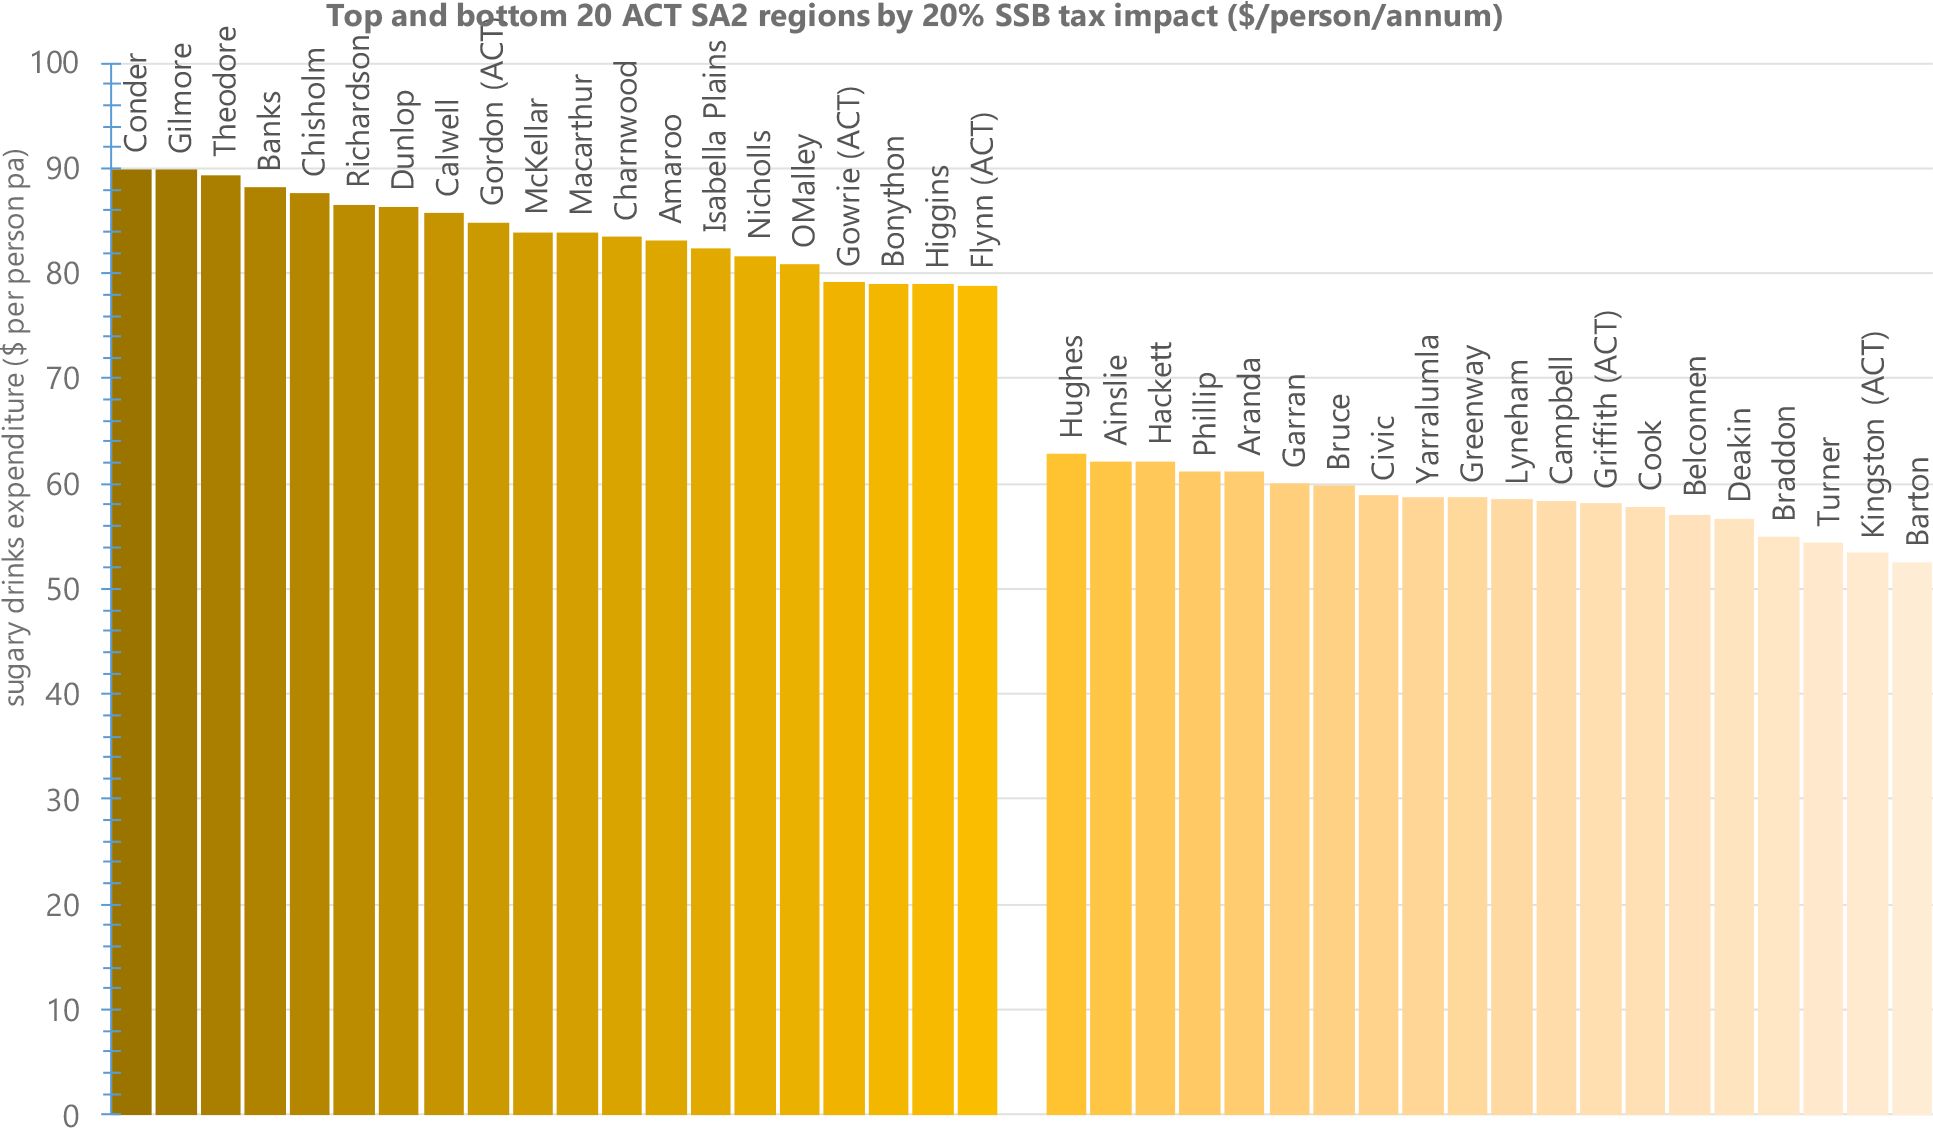

Top and bottom 20 ACT SA2 regions by estimated SSB 20% tax impact ($/person/annum). Source: Authors.
4. Discussion
Spatially explicit microsimulation modelling is a useful way to project the local impacts of national taxation policies. A 20% sugar tax on SSBs in Australia is estimated to raise an extra $80 per person in the highest consumption SA2’s in the ACT. However, the impact of the tax will likely be disproportionately felt in the suburbs that are socio-economically disadvantaged. Previous studies in Australia have estimated modest reductions in BMI and substantial reductions in health care expenditure (Veerman et al., 2016), particularly in the most disadvantaged areas (Lal et al., 2017). Some studies e.g. Colchero et al. (2016) show that middle and low SES households had larger decreases in consumption than high SES households, after the introduction of a sugar tax in Mexico. Hence the health benefits of a sugar tax may be felt more strongly in the lower income households.
Figures 1–3 present a useful description of the initial impact of a sugar tax, the extension of which can be hypothesised using behavioural results from previous research. A tax on SSBs provides an incentive for people to opt for a cheaper drink, and thereby pay less tax. If such a drink happens to have less sugar, then positive health outcomes flow as discussed above. Furthermore the same tax encourages companies to reduce the sugar content of drinks in order that their products fall into lower tax brackets (Buckton et al., 2019). The combined effect of outcomes like these is that income is freed up for people in the lower quintiles of income distributions (Lal et al., 2017; Backholer et al., 2016).
A strength of this analysis is the small-area visualisation of the impact of the tax on SSBs, as well as current expenditure. Small-area estimations are particularly significant for policymakers for whom targeting the right populations for maximal impact is likely to be important.
Limitations of this analysis are grouped around the nature and scope of the model. Firstly, the model is static and does not include response to the implementation of a sugar tax over time. The health benefits of such a tax are therefore not part of the outputs of this model. Direct and concurrent knowledge of elasticities and the extent of product substitution in the face of a sugar tax are not available as Australia has not yet introduced such a tax. Estimates could be obtained from other research but are out of scope of this regional socio-economic model. Secondly, the reweighting method used in the modelling provides a synthetic estimate that calculates variation between SA2s based on differences in a range of benchmarks in the census such as income and household type (see Table 1). The modelling does not specifically model or include area level effects. Thirdly, this paper has also not compared the tax effectiveness of non-spatial approaches to changes in purchasing power such lowering of the personal income tax of low-income earners, nor any impact at the household level rather than the individual.
These limitations represent a springboard for future methodological advances. For example, future research along these lines could model elasticity (i.e. a reduction in expenditure due to increased price) to identify potential reduction in disease burden in most vulnerable areas. Models of the extent of product substitution as price of SSBs rise could also be undertaken. Measures of uncertainty around the estimated expenditure and tax impact would also provide a stronger interpretation of the results given here. Similar to Veerman et al. (2016), we modelled the impact of a valoric tax. Other mechanisms that include a tax on the quantity of sugar may have differential impacts on health (Sharma et al., 2014) and socio-economically disadvantaged groups. Microsimulation is a population level approach and the original weighs in the HES are probabilistic. The ABS supplies a range of alternative weights, and future research could investigate the effect of different weighting schemes on estimates.
Our findings that a tax on SSBs is likely to disproportionally impact the most socio-economically disadvantaged groups in the ACT is similar to other Australian research (Lal et al., 2017). Extension of this modelling to the whole of Australia and with a focus on specific demographics e.g. Indigenous Australians, would provide further evidence for the development of targeted and relevant health promotion activities. Both economic and social factors are an important part of the evidence base. The pricing of healthy food in remote communities is related to transport and storage costs and has been studied by Ferguson et al. (2018). The social determinants of consumption of SSBs in Indigenous communities have also been recently identified (Thurber et al., 2014; Thurber et al., 2020). Detailed analysis of differential impacts by socio-economic status and demographics should be the focus of future study. Policymakers could also note that when the notion of a sugar tax returns to stronger public debate, spatial effects should not be ignored.
5. Conclusion
There are few studies in Australia that report the modelled impact of a sugar tax. The current study is the first Australian study to report results of the likely impacts of an SSB tax at a high spatial resolution, including by small-area socio-economic disadvantage. A tax on SSBs has been promoted as an effective tool to reduce the burden of diseases attributable to sugary drink consumption and associated healthcare costs. However, the financial impact is likely to vary spatially, with a disproportionate impact on low-income populations. This impact however is not all negative, as low-income populations are also a group likely to benefit from lower sugar consumption.
References
- 1
- 2
-
3
The impact of a tax on sugar-sweetened beverages according to socio-economic position: a systematic review of the evidencePublic Health Nutrition 19 :3070–3084.https://doi.org/10.1017/S136898001600104X
-
4
Paper Prepared for ABS Methodology Advisory Committee [Online]Weighting and standard error estimation for ABS household surveys, Paper Prepared for ABS Methodology Advisory Committee [Online].
-
5
Impact of sugars and sugar taxation on body weight control: A comprehensive literature reviewObesity (Silver Spring, Md.) 24 :1410–1426.https://doi.org/10.1002/oby.21535
-
6
A discourse network analysis of UK newspaper coverage of the “sugar tax” debate before and after the announcement of the Soft Drinks Industry LevyBMC Public Health 19 :490.https://doi.org/10.1186/s12889-019-6799-9
-
7
Evidence that a tax on sugar sweetened beverages reduces the obesity rate: a meta-analysisBMC Public Health 13 :1072.https://doi.org/10.1186/1471-2458-13-1072
-
8
Socioeconomic status and heart failure in SydneyHeart, Lung & Circulation 23 :320–324.https://doi.org/10.1016/j.hlc.2013.10.056
-
9
Beverage purchases from stores in Mexico under the excise tax on sugar sweetened beverages: observational studyBMJ 352 :h6704.https://doi.org/10.1136/bmj.h6704
-
10
Epidemiologic evidence for the relation between socioeconomic status and depression, obesity, and diabetesJournal of Psychosomatic Research 53 :891–895.https://doi.org/10.1016/s0022-3999(02)00303-3
-
11
Health-Promoting Food Pricing Policies and Decision-Making in Very Remote Aboriginal and Torres Strait Islander Community Stores in AustraliaInternational Journal of Environmental Research and Public Health 15 :E2908.https://doi.org/10.3390/ijerph15122908
-
12
IFS Briefing Note BN255The evidence on the effects of soft drink taxes, IFS Briefing Note BN255, London, Institute of Fiscal Studies.
-
13
Projected impacts of federal tax policy proposals on mortality burden in the United States: A microsimulation analysisPreventive Medicine 111 :272–279.https://doi.org/10.1016/j.ypmed.2017.10.021
-
14
Modelled health benefits of a sugar-sweetened beverage tax across different socioeconomic groups in Australia: A cost-effectiveness and equity analysisPLoS Medicine 14 :e1002326.https://doi.org/10.1371/journal.pmed.1002326
-
15
Taxing unhealthy food and drinks to improve healthBMJ 344 :bmj.e2931.https://doi.org/10.1136/bmj.e2931
-
16
The impact on productivity of a hypothetical tax on sugar-sweetened beveragesHealth Policy (Amsterdam, Netherlands) 121 :715–725.https://doi.org/10.1016/j.healthpol.2017.04.001
-
17
Effect of a Low Free Sugar Diet vs Usual Diet on Nonalcoholic Fatty Liver Disease in Adolescent Boys: A Randomized Clinical TrialJAMA 321 :256–265.https://doi.org/10.1001/jama.2018.20579
-
18
The effects of taxing sugar-sweetened beverages across different income groupsHealth Economics 23 :1159–1184.https://doi.org/10.1002/hec.3070
-
19
A Review of Spatial Microsimulation MethodsInternational Journal of Microsimulation 7 :4–25.https://doi.org/10.34196/ijm.00092
-
20
Small area estimation using a reweighting algorithmJournal of the Royal Statistical Society 174 :931–951.https://doi.org/10.1111/j.1467-985X.2011.00690.x
-
21
CSRM & SRC Methods Paper 1 [Online]Model of the Australian tax and transfer system: A flexible open-source approach to tax-transfer modelling, CSRM & SRC Methods Paper 1 [Online], Canberra, Australian National University.
-
22
Cancer survival disparities worsening by socio-economic disadvantage over the last 3 decades in new South Wales, AustraliaBMC Public Health 17 :691.https://doi.org/10.1186/s12889-017-4692-y
-
23
Social determinants of sugar-sweetened beverage consumption in the Longitudinal Study of Indigenous ChildrenFamily Matters 95 :51.
-
24
Sugar-sweetened beverage consumption among Indigenous Australian children aged 0-3 years and association with sociodemographic, life circumstances and health factorsPublic Health Nutrition 23 :295–308.https://doi.org/10.1017/S1368980019001812
-
25
The sugar content of soft drinks in Australia, Europe and the United StatesThe Medical Journal of Australia 206 :454–455.https://doi.org/10.5694/mja16.01316
-
26
The Impact of a Tax on Sugar-Sweetened Beverages on Health and Health Care Costs: A Modelling StudyPloS One 11 :e0151460.https://doi.org/10.1371/journal.pone.0151460
-
27
Taxes on Sugar-Sweetened Beverages: International Evidence and ExperiencesWashington: World Bank Group.https://doi.org/10.1596/33969
Article and author information
Author details
Funding
This research was funded by an Australian National University Research School of Social Sciences Cross-College grant.
Acknowledgements
The authors thank Research Associate Cukkoo Joseph who undertook the initial analysis of the data.
Publication history
- Version of Record published: December 31, 2021 (version 1)
Copyright
© 2021, Richardson et al.
This article is distributed under the terms of the Creative Commons Attribution License, which permits unrestricted use and redistribution provided that the original author and source are credited.