A Spatially-explicit Microsimulation Analysis of a Proposed Sugar Tax in the Australian Capital Territory
- Statistical Consulting Unit, Australia
- Research School of Population Health, Australia
- Centre for Social Research and Methods, Australia
Cite this article
as: A. Richardson, A. Lal, B. Phillips, R. Webster; 2021; A Spatially-explicit Microsimulation Analysis of a Proposed Sugar Tax in the Australian Capital Territory; International Journal of Microsimulation; 14(3); 76-84.
doi: 10.34196/ijm.00242
Figures
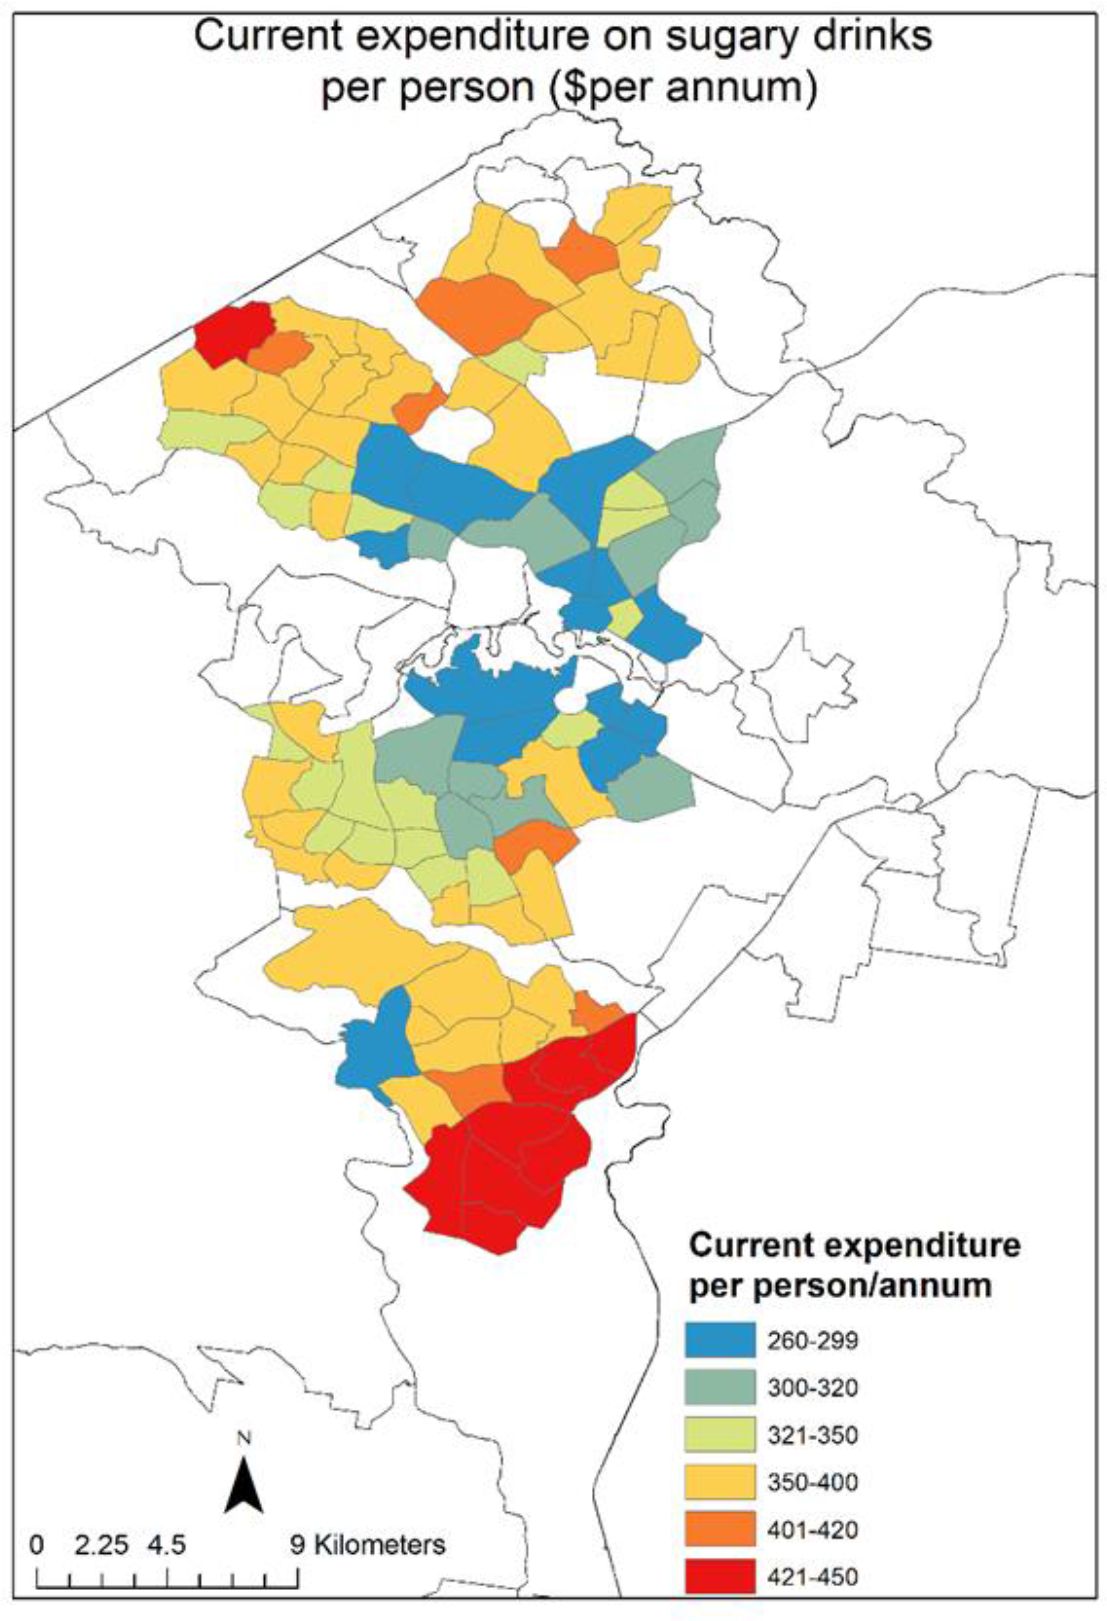
Figure 1

Expenditure on SSBs by SA2 in the ACT: current expenditure ($/person/annum). Source: Authors.
Figure 2

Current expenditure on SSBs by SA2 in the ACT % income /annum) by relative socio-economic advantage and disadvantage (IRSAD). Source: Index of Relative Socio-economic Advantage and Disadvantage from ABS 2033.0.55.00 – Census of Population and Housing: Socio-Economic Indexes for Areas (SEIFA), Australia, 2016. SSB Tax impact from authors.
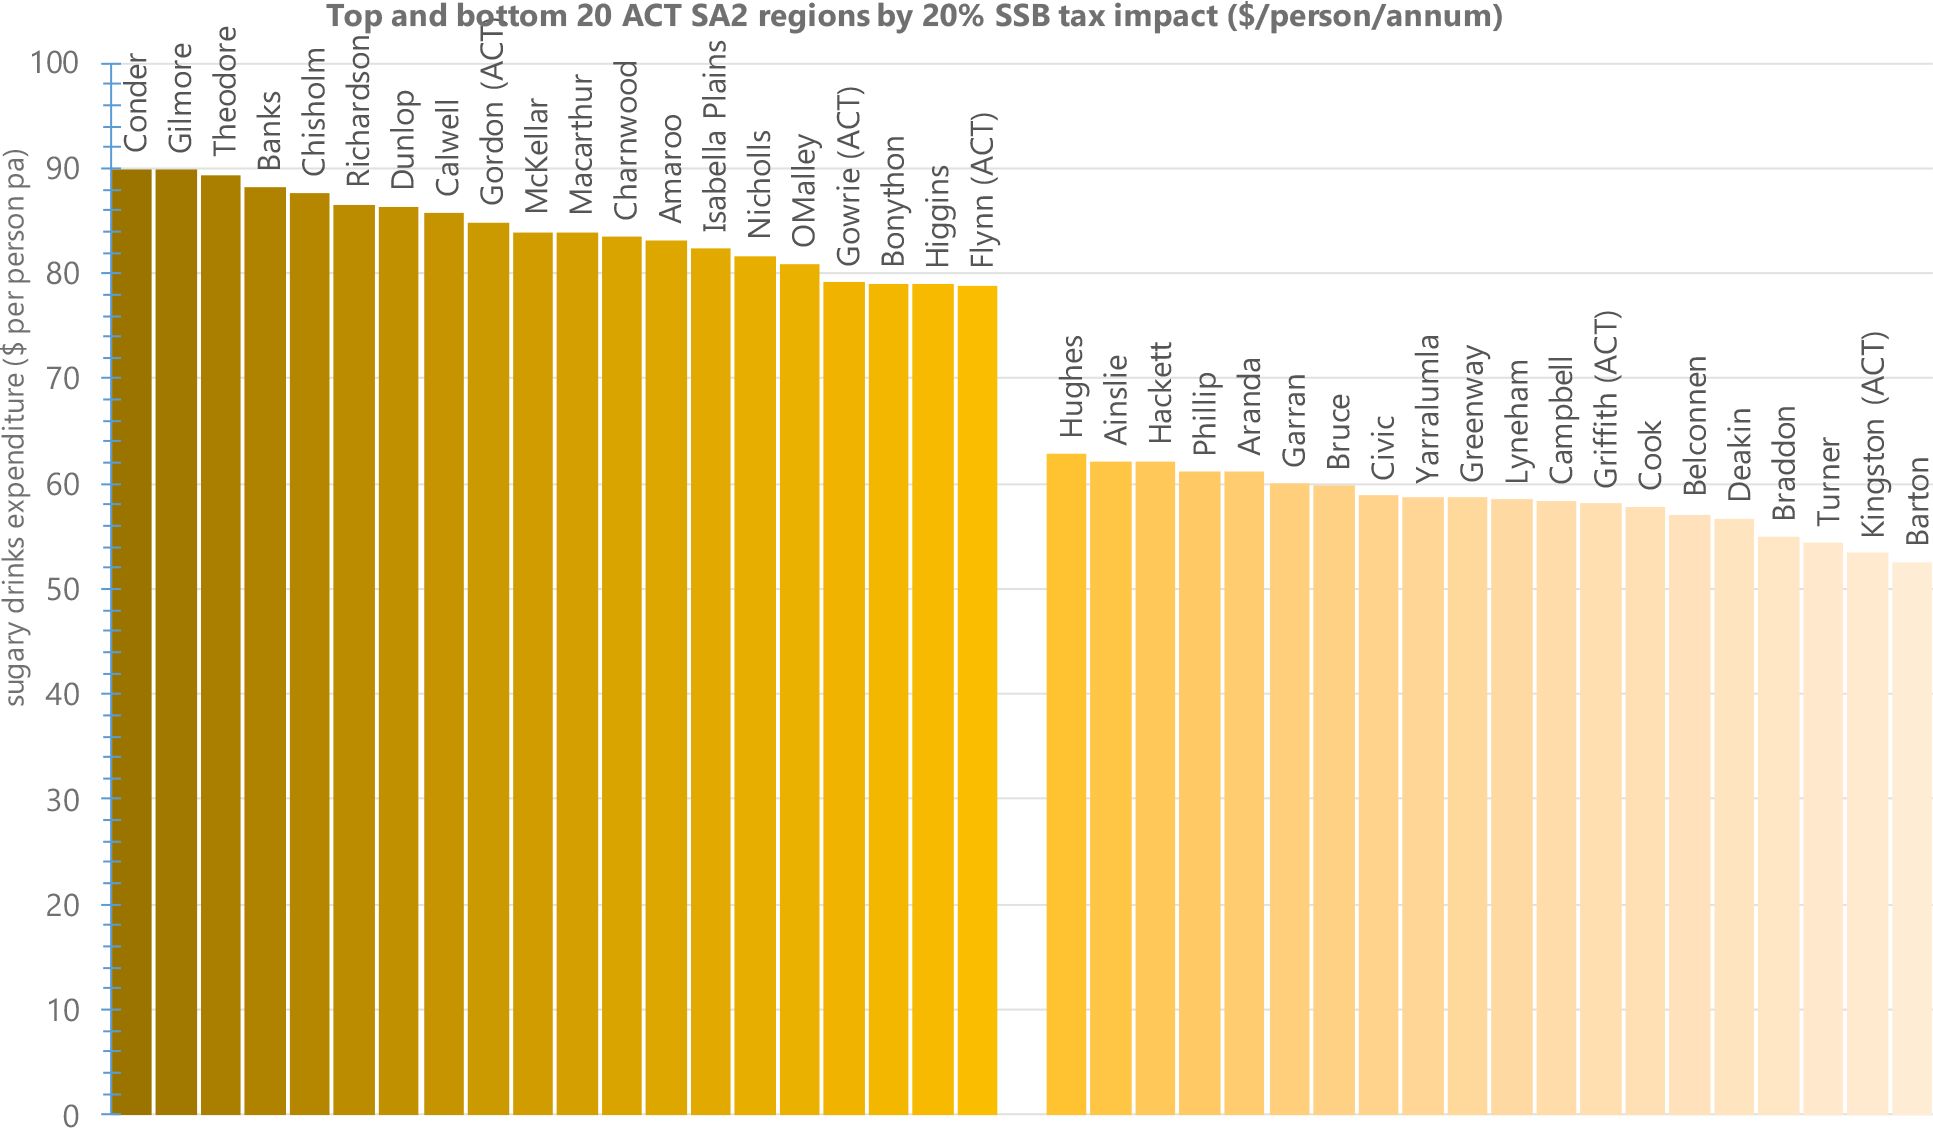
Figure 3

Top and bottom 20 ACT SA2 regions by estimated SSB 20% tax impact ($/person/annum). Source: Authors.
Tables
Table 1
Benchmarking categories from Census.
| Variable | Categories |
|---|---|
| Age | 15-34, 35-54, 55+ |
| Sex | m/f |
| Labour force status | Employed/not working |
| Education status | Higher degree/diploma/year 12 or less |
| Mortgage payments per month | Up to $1,200 $1,200 up to $1,800 $1,800 up to $2,600 Over $2,600 |
| Rent payments per week | Up to $175 $175 up to $300 $300 up to $400 Over $400 |
| Household income per week | Low income (up to $650 per week) Middle income ($650 to $1,000 per week) Upper middle income ($1,000 to $2,500 per week) High income (over $2,500 per week) |
| Occupation group | Professionals, tradespersons & labourers, admin and service workers |
| Family type | Couple with children, couple without children, single parent, lone person |
| People in household | 1 to 5 |
-
Source: Authors.
Table 2
Descriptive summary of the Household Expenditure Data for the ACT.
| Type | Households | Population | SSB exp ($m) | Total income ($b) | % SBD exp per household | Ave Income |
|---|---|---|---|---|---|---|
| Total | 156,917 | 407,650 | $119.8 | $19.716 | 0.61% | $125,650 |
| Weekly income | ||||||
| -$1000 | 8.3% | 3.9% | 3.0% | 2.3% | 0.79% | $35,270 |
| $1000-$1250 | 9.9% | 6.4% | 3.6% | 4.7% | 0.47% | $59,310 |
| $1250-$1500 | 6.5% | 3.6% | 2.2% | 3.8% | 0.35% | $72,841 |
| $1500-$1750 | 8.0% | 5.7% | 4.2% | 5.5% | 0.46% | $85,655 |
| $1750-$2000 | 10.9% | 9.8% | 8.2% | 8.4% | 0.59% | $97,109 |
| $2000-$2250 | 7.8% | 7.7% | 6.3% | 6.9% | 0.55% | $111,023 |
| $2250-$2500 | 8.5% | 8.0% | 6.6% | 8.3% | 0.48% | $122,504 |
| $2500-$2750 | 5.6% | 7.2% | 4.1% | 6.1% | 0.41% | $136,750 |
| $2750-$3250 | 13.2% | 17.5% | 21.0% | 16.2% | 0.79% | $154,832 |
| $3250-$4000 | 9.0% | 11.6% | 8.5% | 13.6% | 0.38% | $190,134 |
| $4000-$7000 | 12.3% | 18.5% | 32.2% | 24.2% | 0.81% | $246,934 |
| % of weekly income spent on SSB | ||||||
| 0.0% | 25.7% | 21.3% | 0.0% | 22.1% | 0.00% | $107,831 |
| 0.00%-0.1% | 17.6% | 18.8% | 5.0% | 22.2% | 0.17% | $158,108 |
| 0.10%-0.2% | 13.9% | 15.5% | 10.6% | 15.2% | 0.51% | $137,689 |
| 0.20%-0.3% | 6.8% | 6.8% | 7.4% | 6.9% | 0.79% | $127,291 |
| 0.30%-0.4% | 10.1% | 10.6% | 16.9% | 10.7% | 1.16% | $132,603 |
| 0.40%-0.5% | 5.1% | 7.0% | 12.7% | 5.0% | 1.88% | $120,939 |
| 0.50%-0.8% | 12.3% | 13.6% | 29.8% | 12.6% | 1.73% | $129,389 |
| 0.75%-1.0% | 4.8% | 3.7% | 8.8% | 3.6% | 1.77% | $95,015 |
| 1.00%-4.0% | 3.6% | 2.8% | 8.8% | 1.7% | 3.70% | $60,276 |
-
Source: ABS Catalogue 6530.0 - Household Expenditure Survey, Australia: 2015-16, November 2017.
Data and code availability
The data is available for scientific research only upon registration with the Australian Bureau of Statistics. The code for the model is proprietary with executable not available. We commit to preserving data and code for a period of no less than five years following publication of the manuscript, and to providing reasonable assistance to requests for clarification and replication.
Download links
A two-part list of links to download the article, or parts of the article, in various formats.