Investigating the Incidence of Value Added Tax on Households Income: New Evidence from Italy
- Ministry of Economy and Finance, Department of Finance, Italy
Cite this article
as: C. Cirillo, L. Imperioli, M. Manzo; 2021; Investigating the Incidence of Value Added Tax on Households Income: New Evidence from Italy; International Journal of Microsimulation; 14(3); 85-118.
doi: 10.34196/ijm.00243
Figures
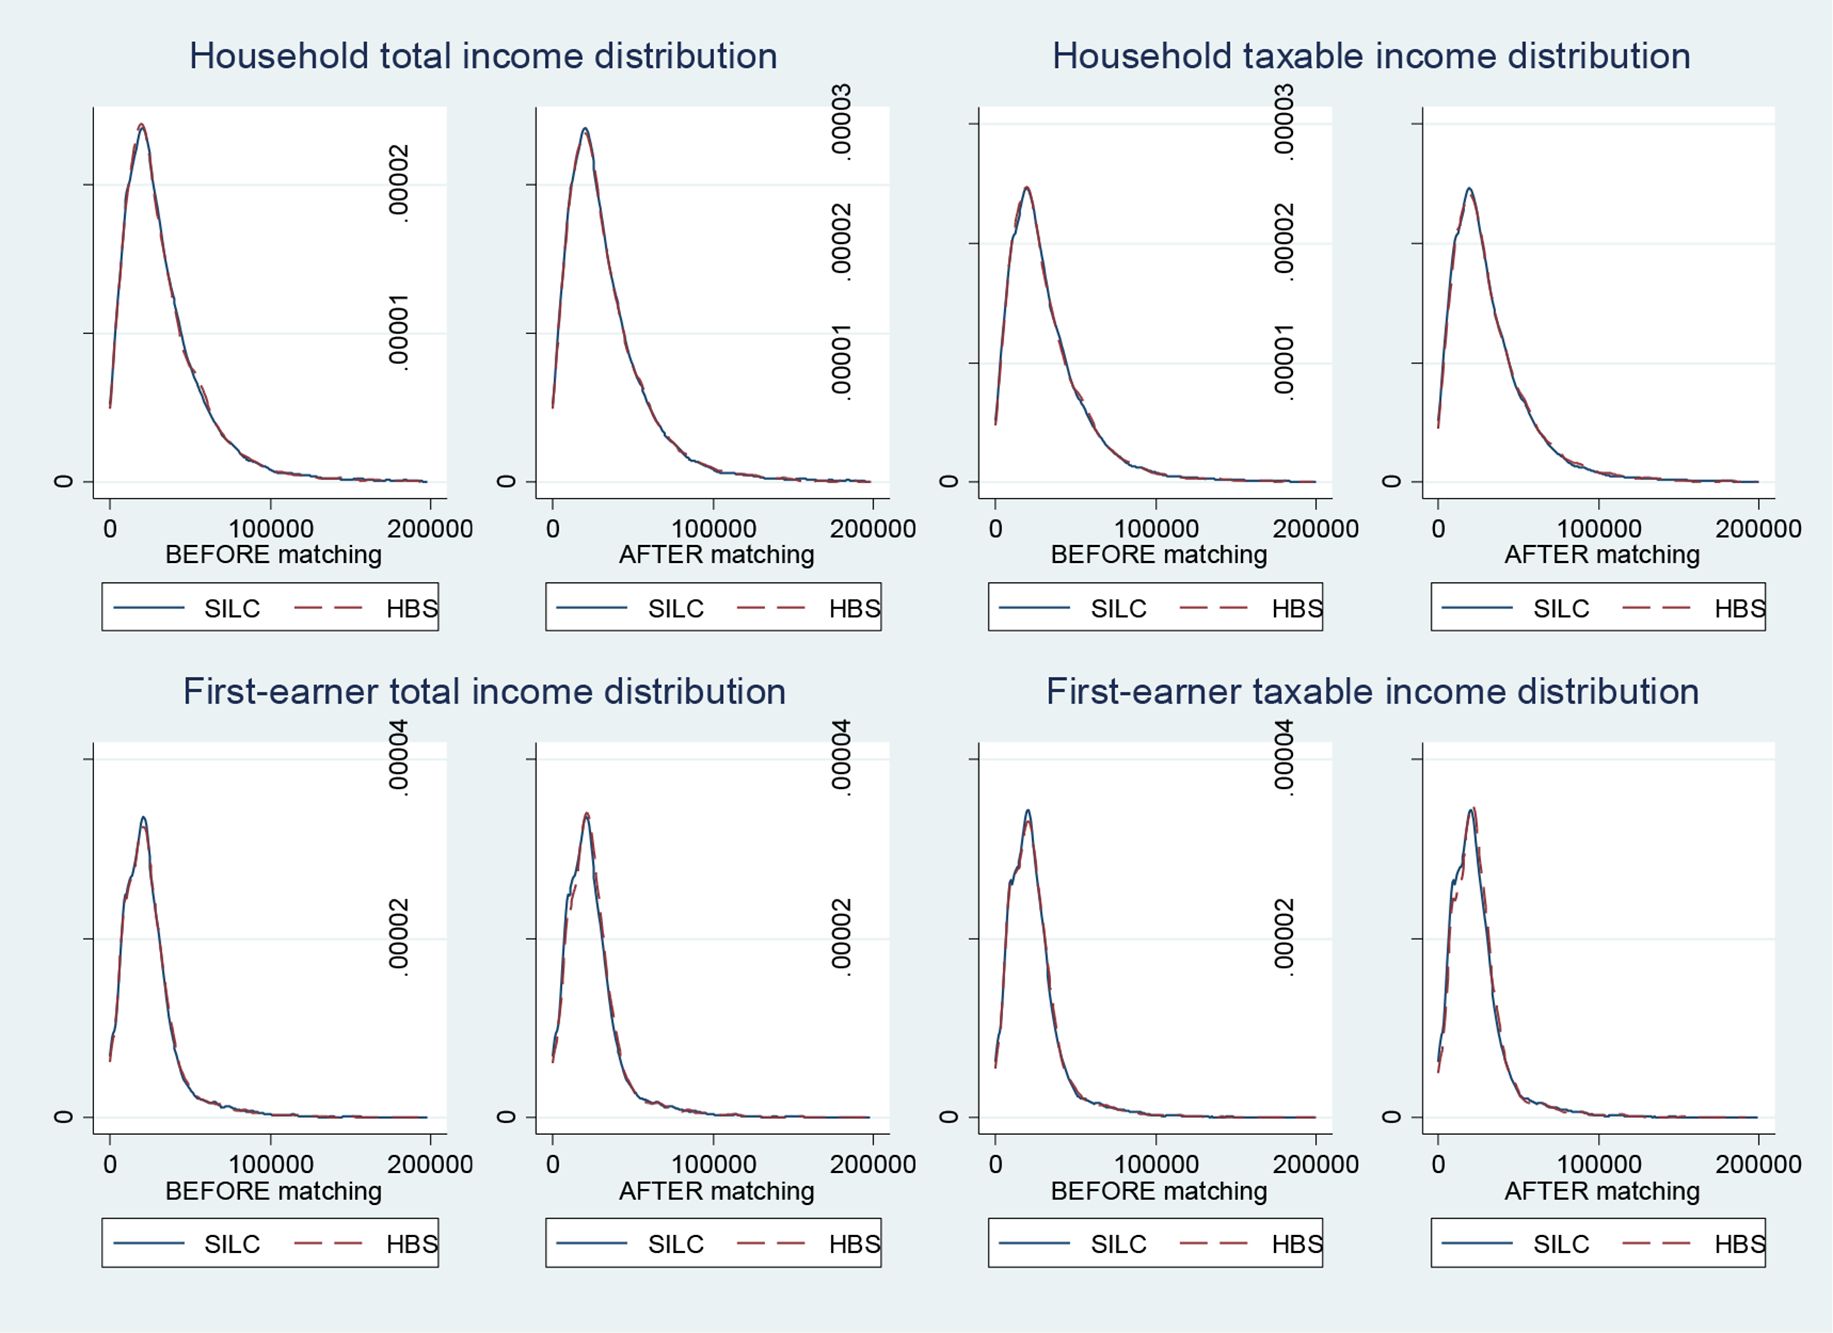
Figure 1

Tax Register Income Distribution Before and After Matching. Source: Authors elaboration based on Istat, 2018a Istat (2018a) and HBS 2017 data. Note: For graphical purposes, figures report the Kernel density distribution for income values below 200,000 Euros.
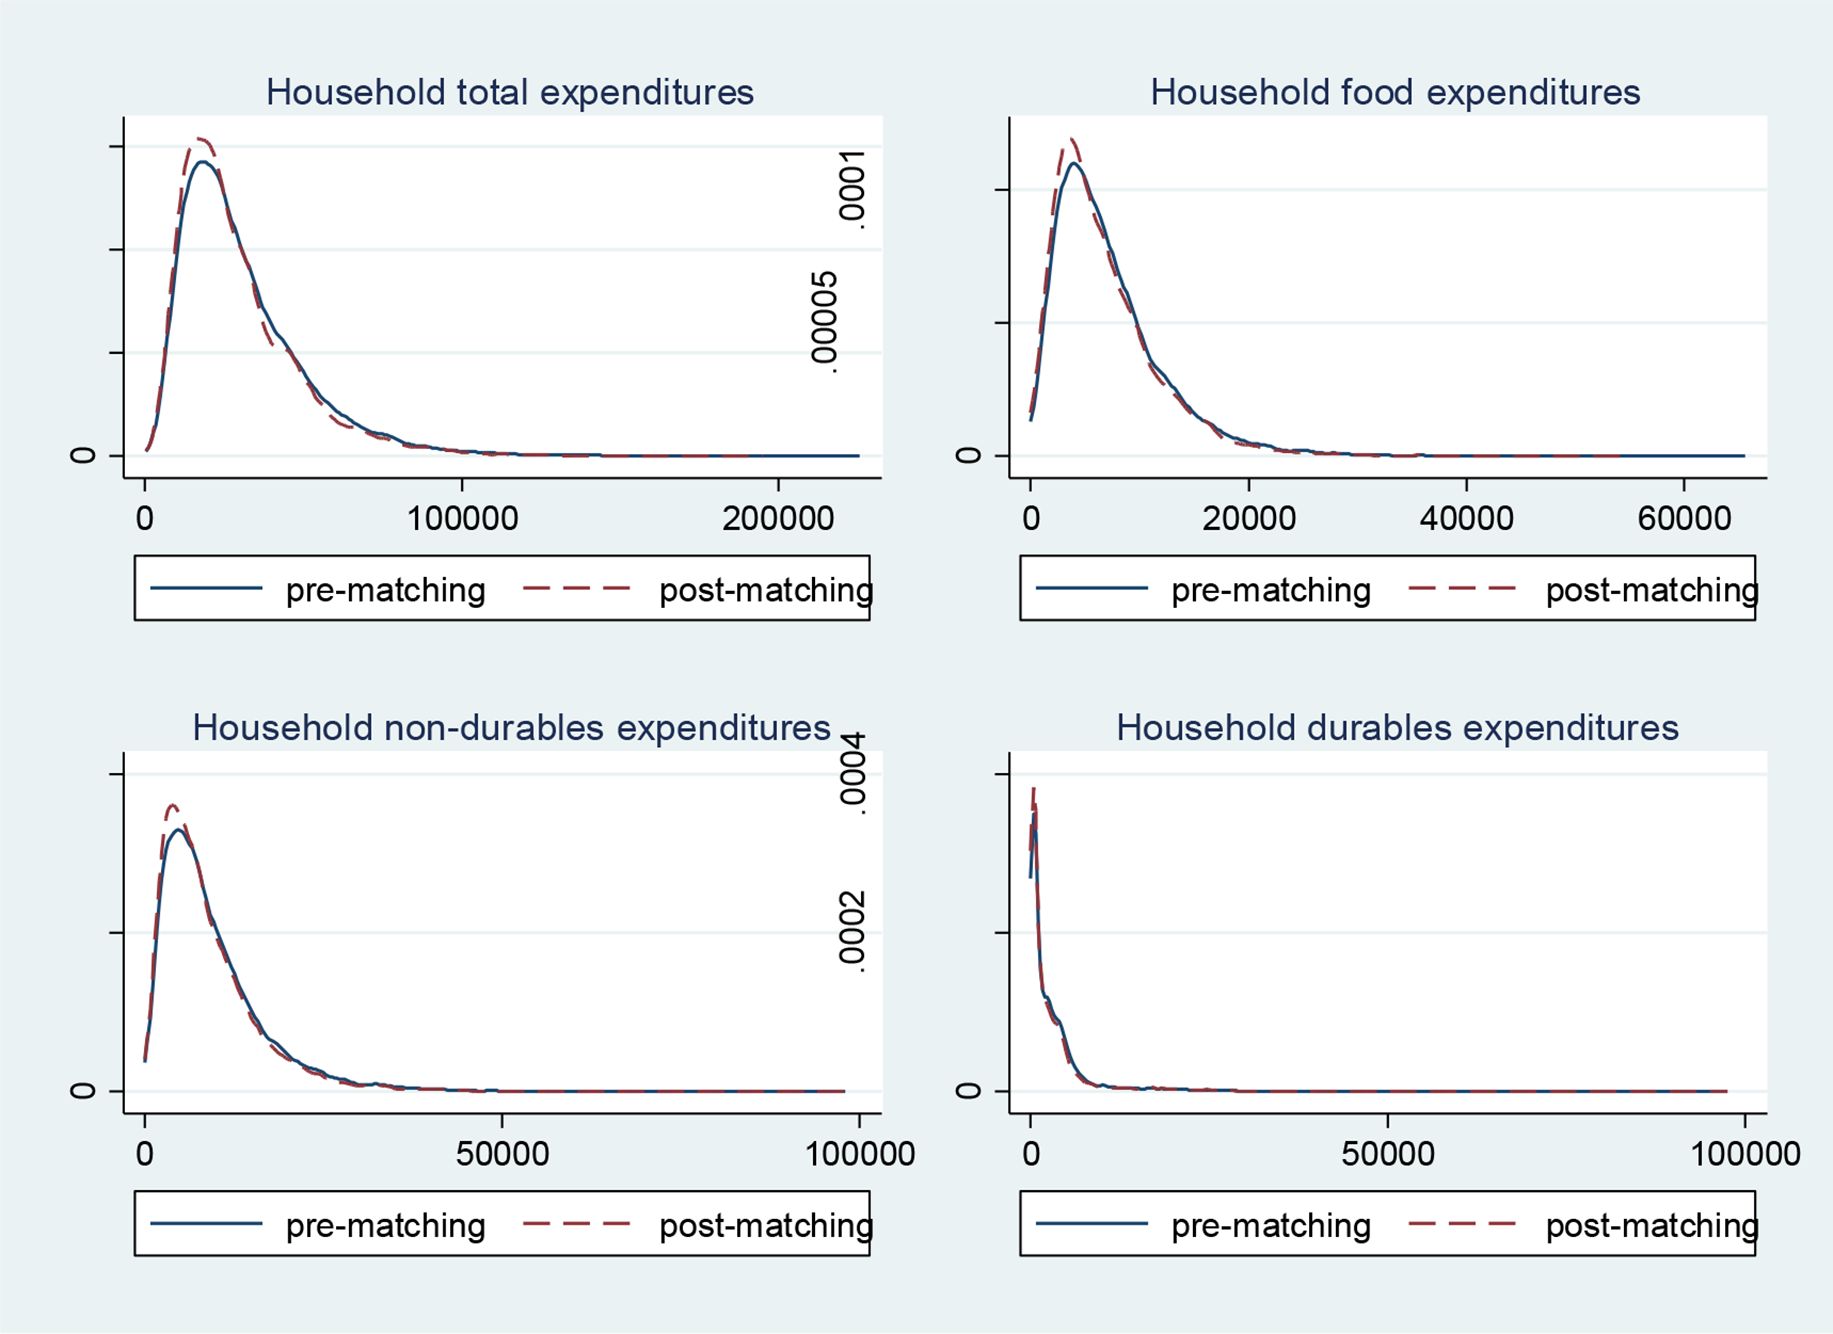
Figure 2

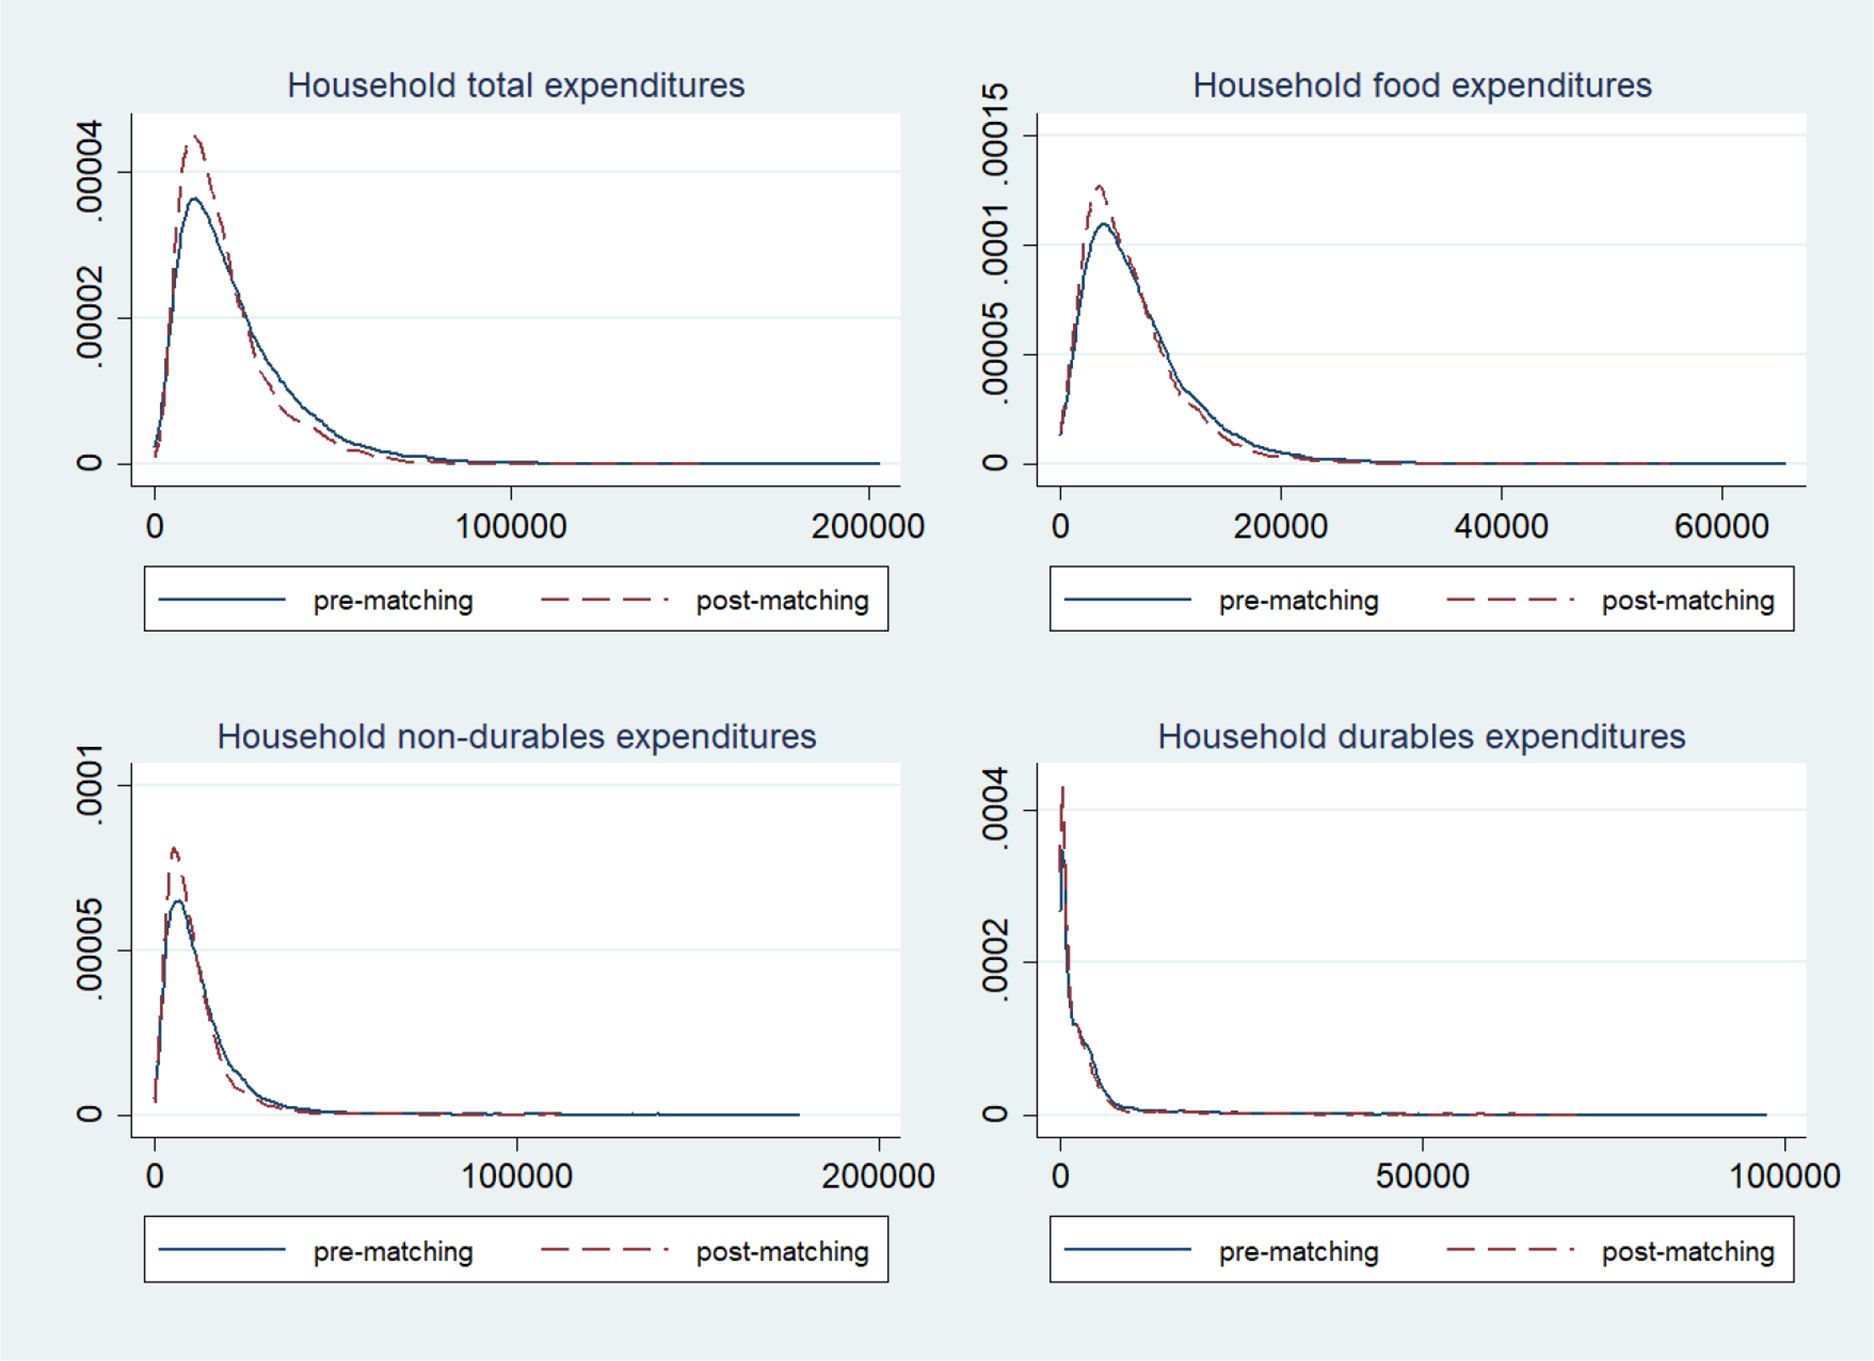
HBS Households Expenditures Distribution Before and After Matching. Source: Authors elaboration based on HBS 2017 data. Note: Graphs report the Kernel density distribution of expenditures.
Figure 3
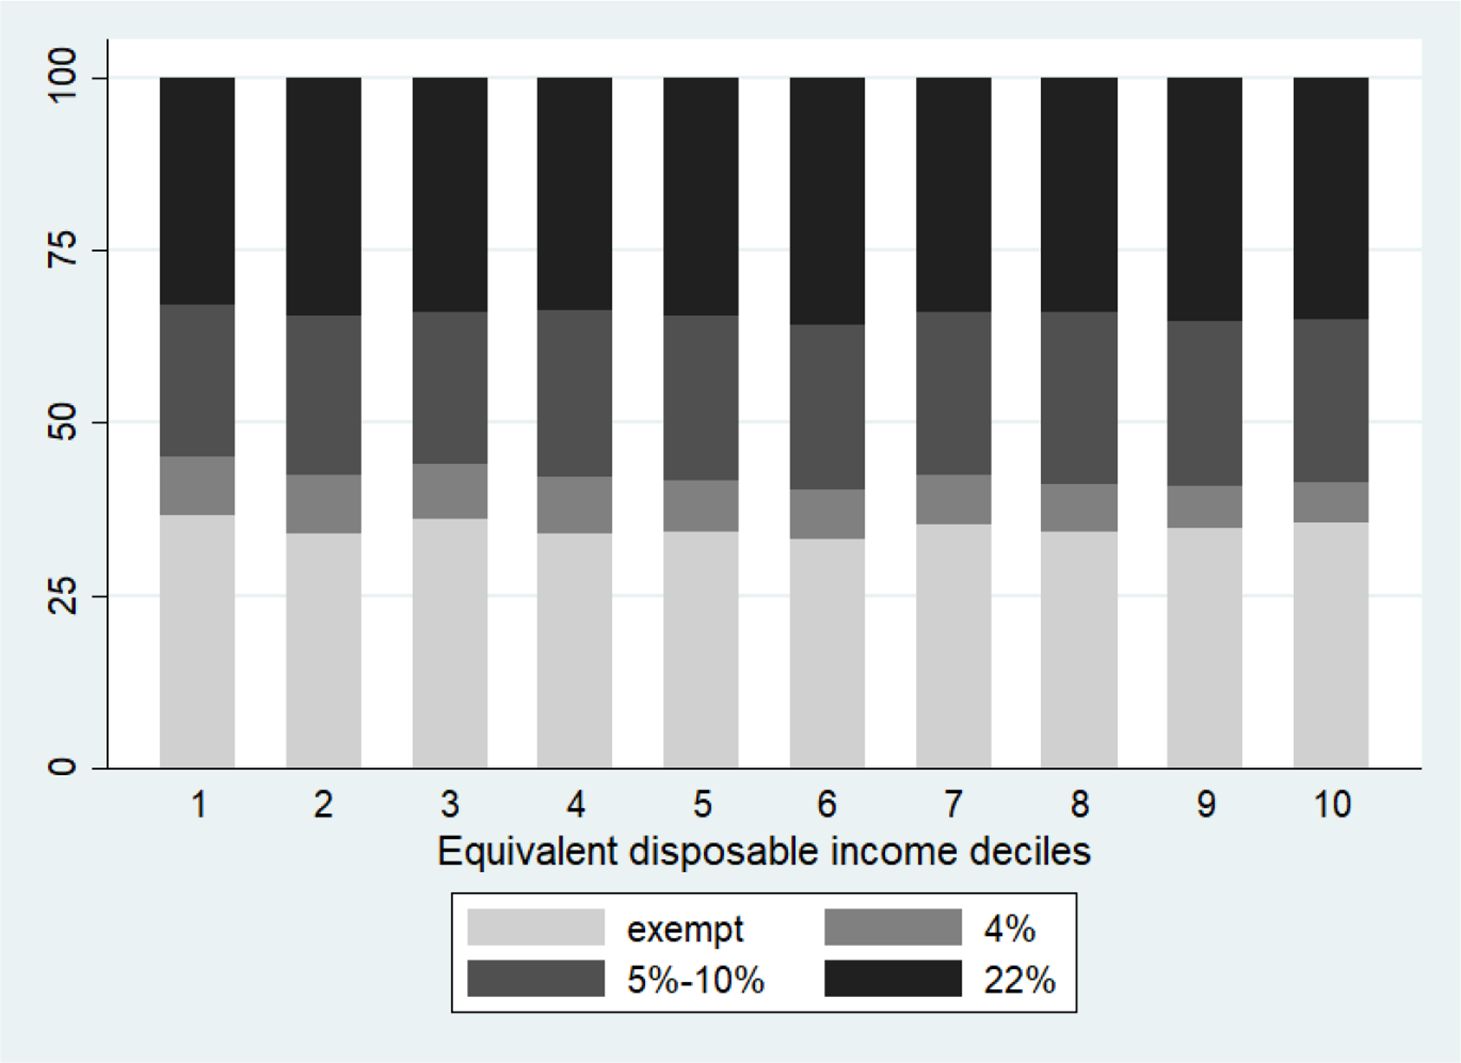
Net Consumption, by Households Income Deciles and VAT rates. Source: Authors elaboration.
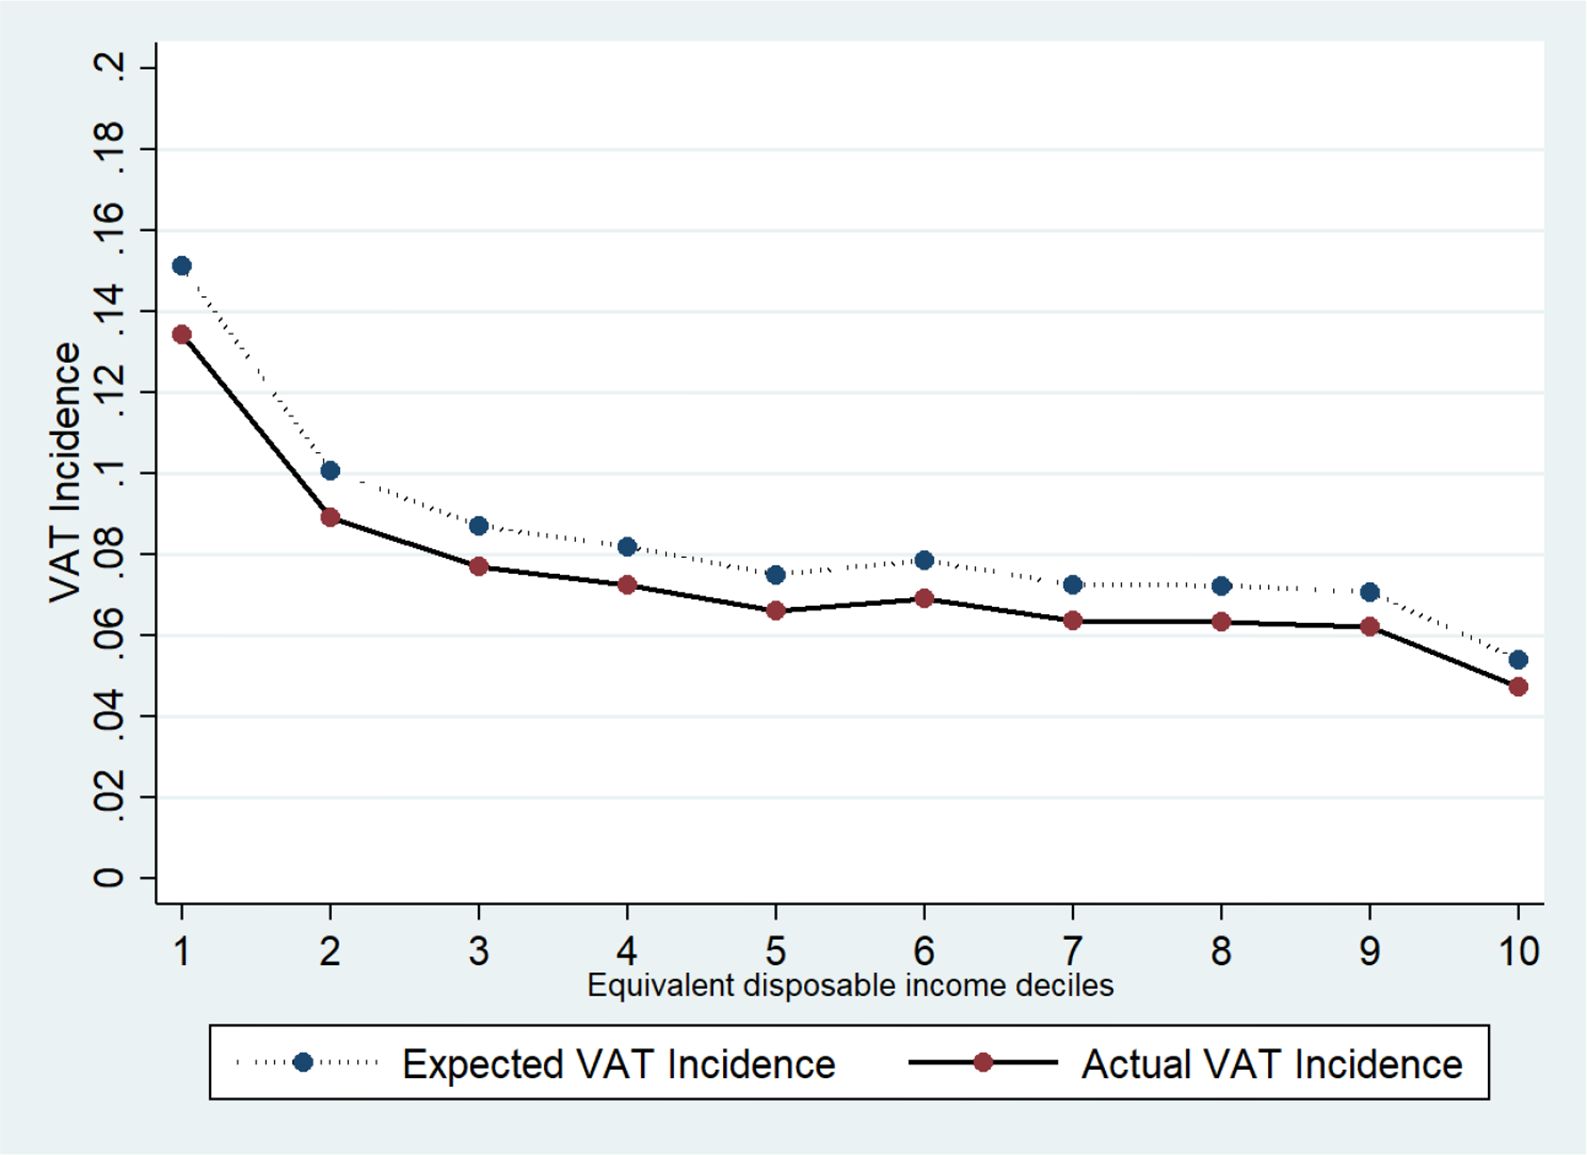
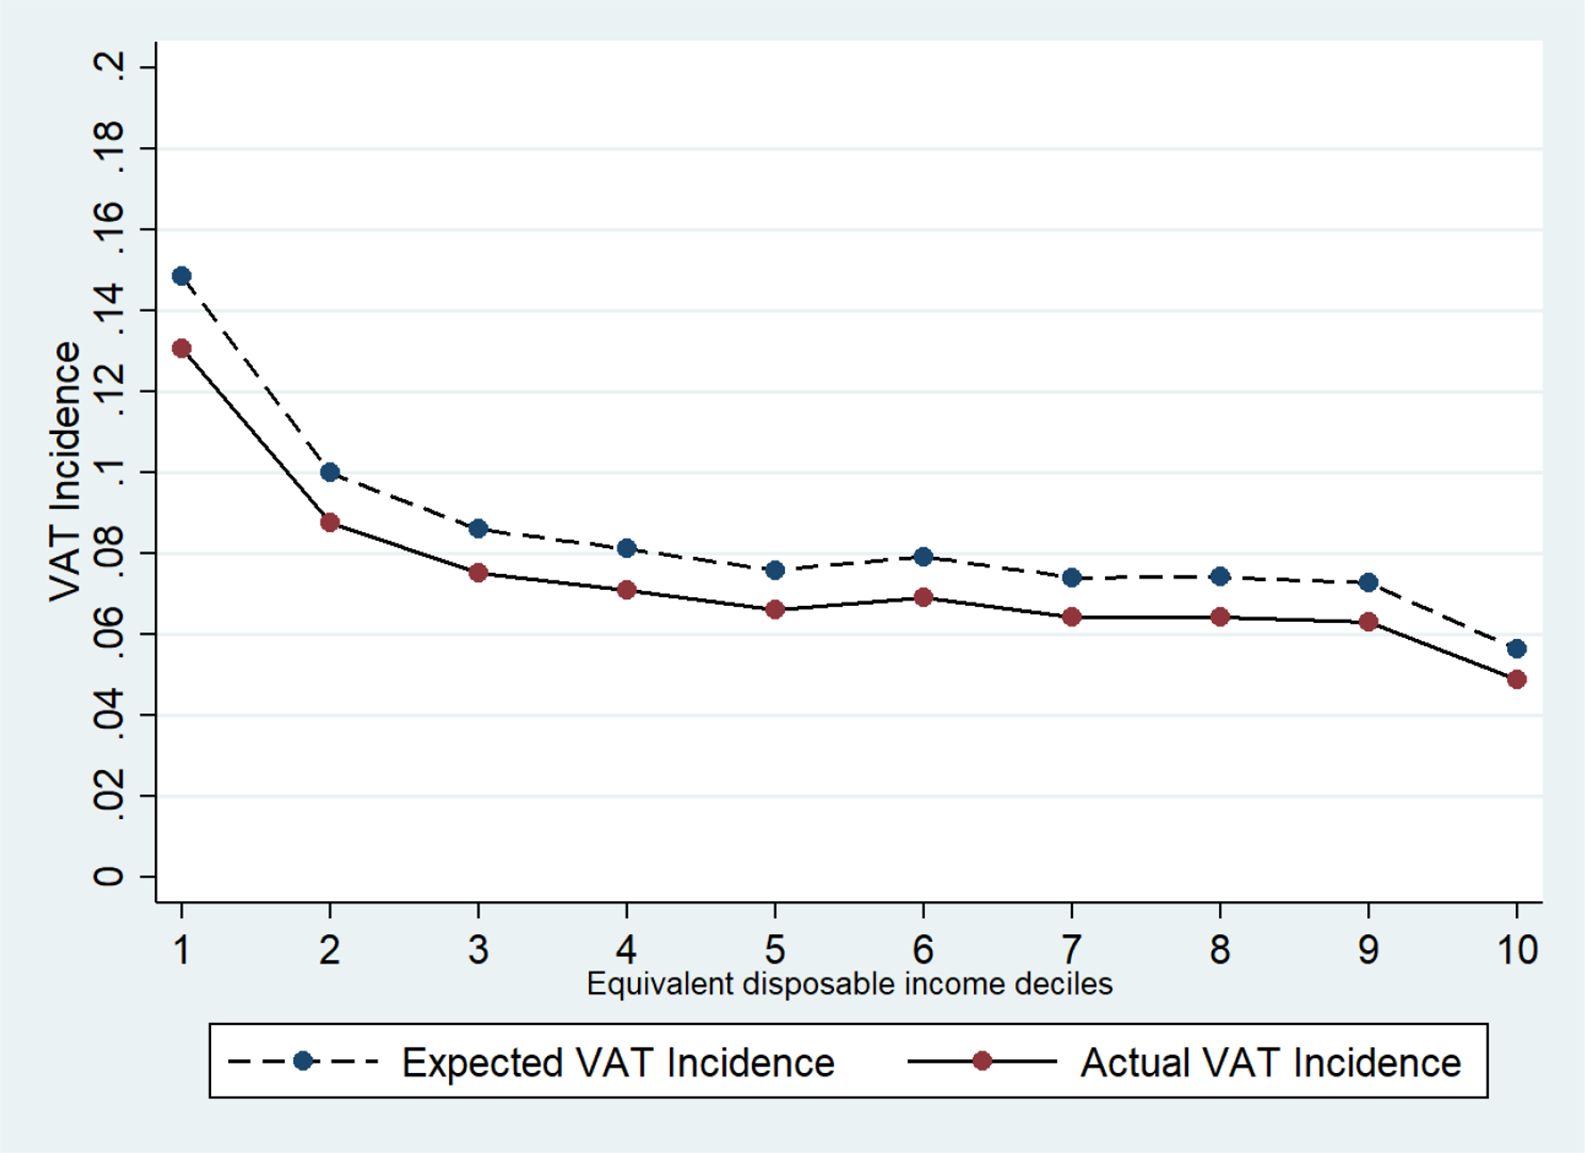
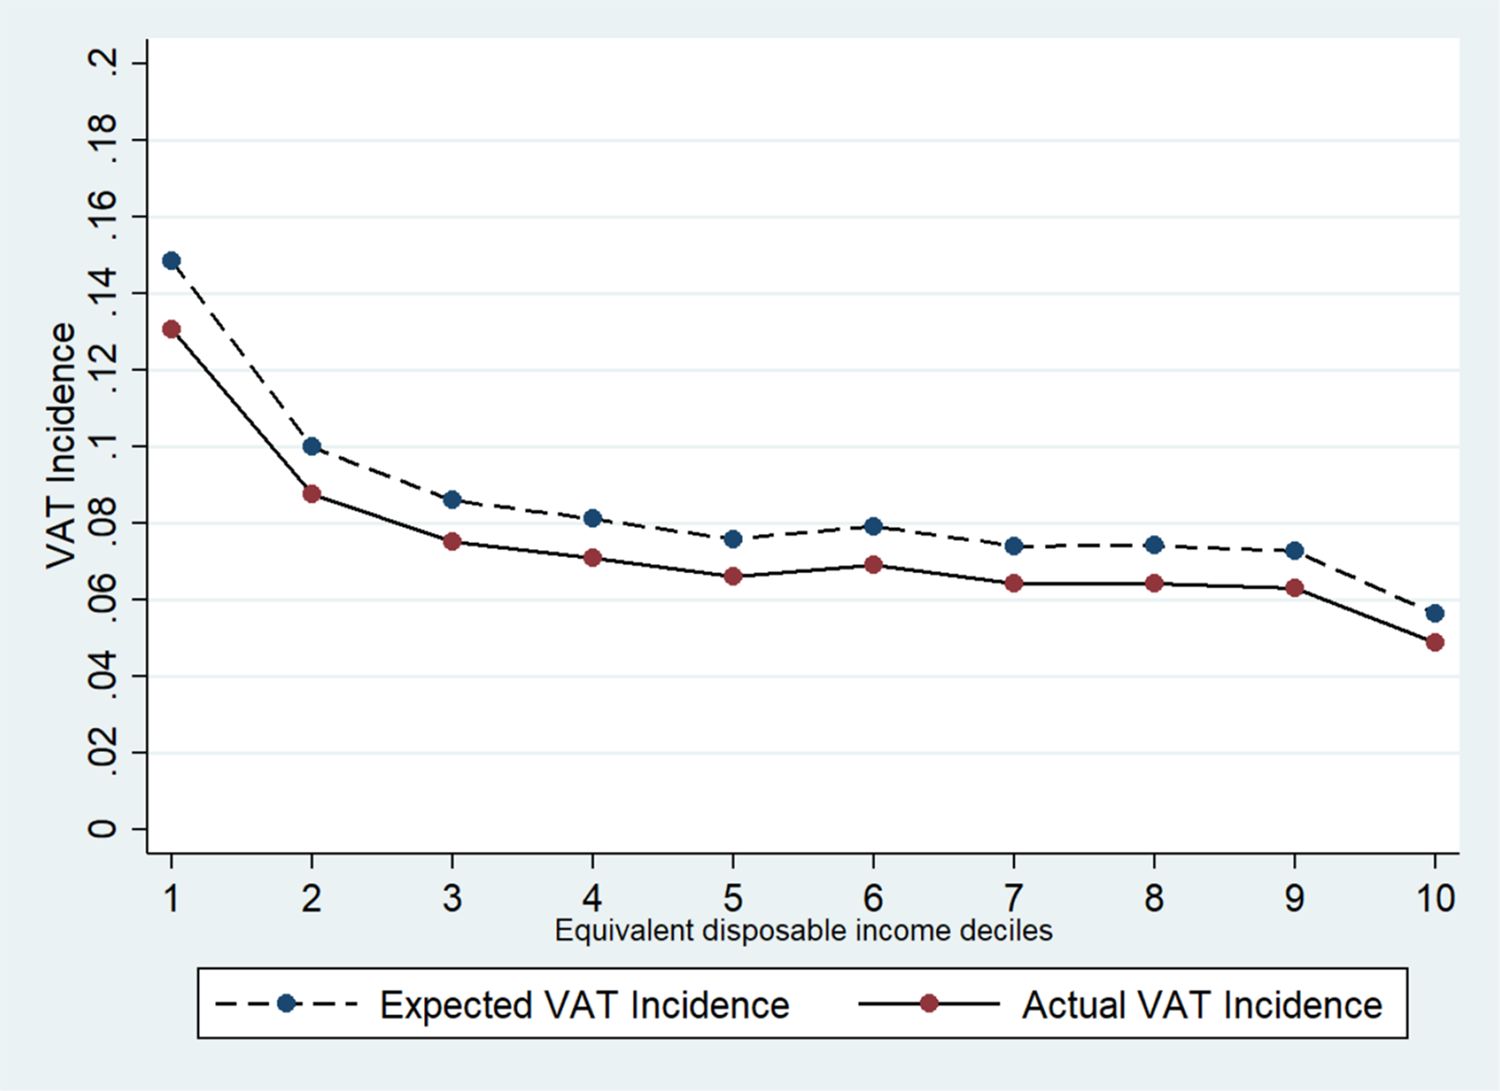
Figure 4

VAT Incidence on Households Disposable Income, by Income Deciles. Source: Authors elaboration.
Figure 5
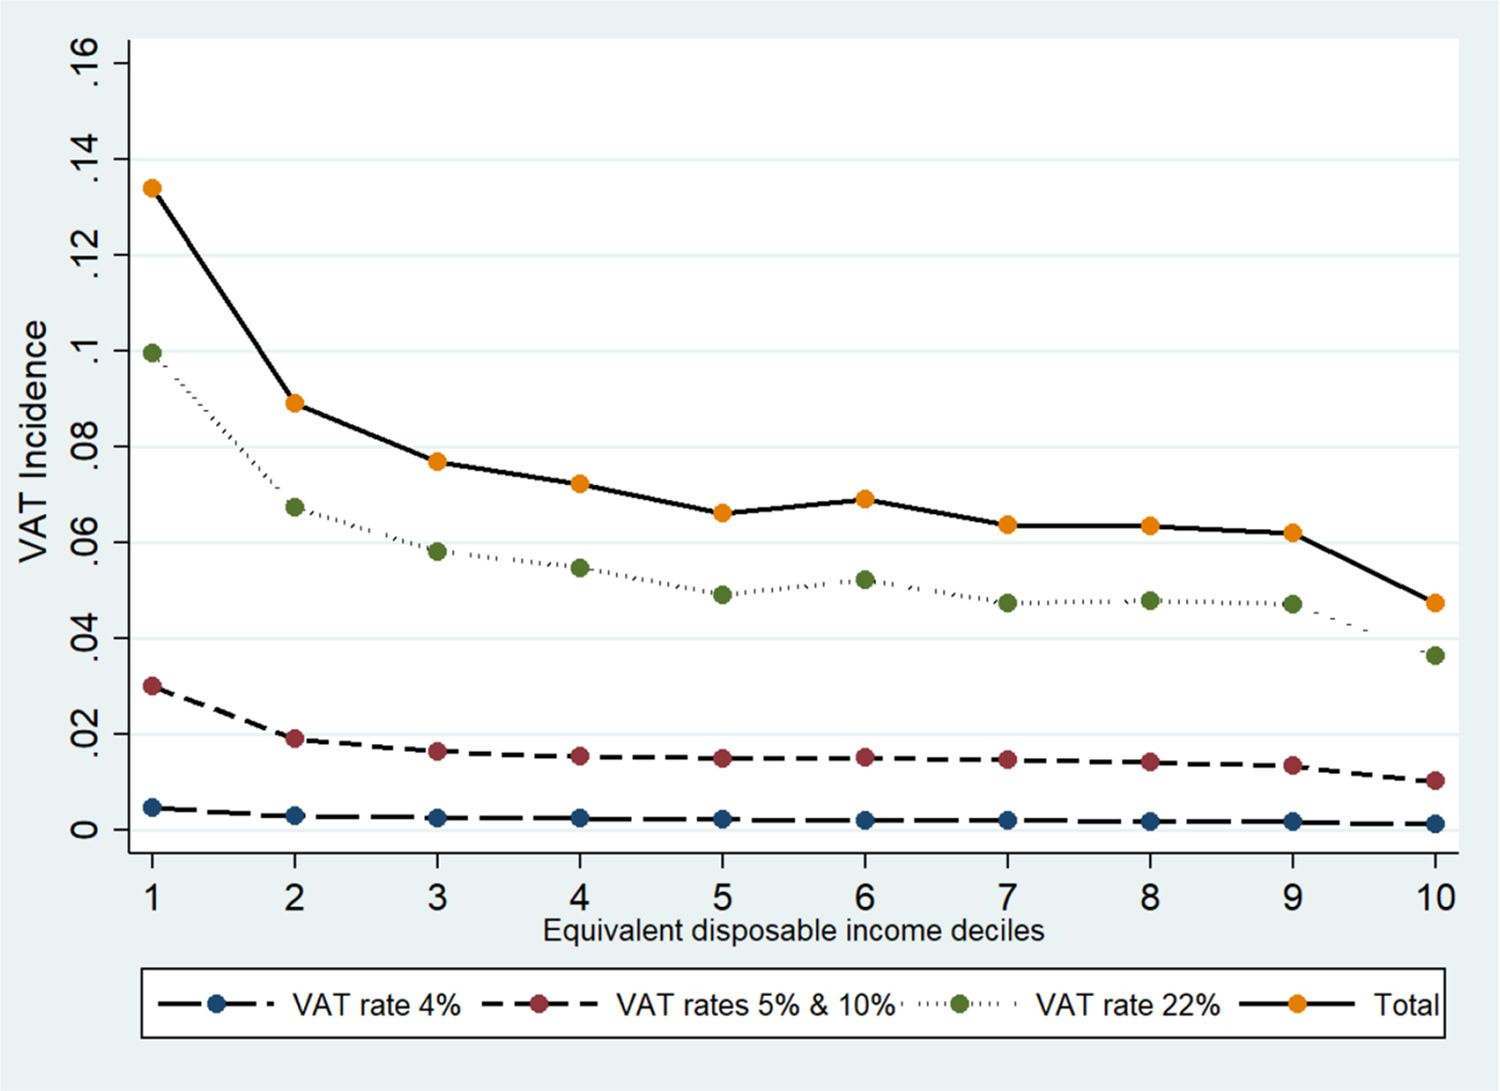
Actual VAT Incidence on Households Income, by Income Deciles and VAT Rates. Source: Authors elaboration.
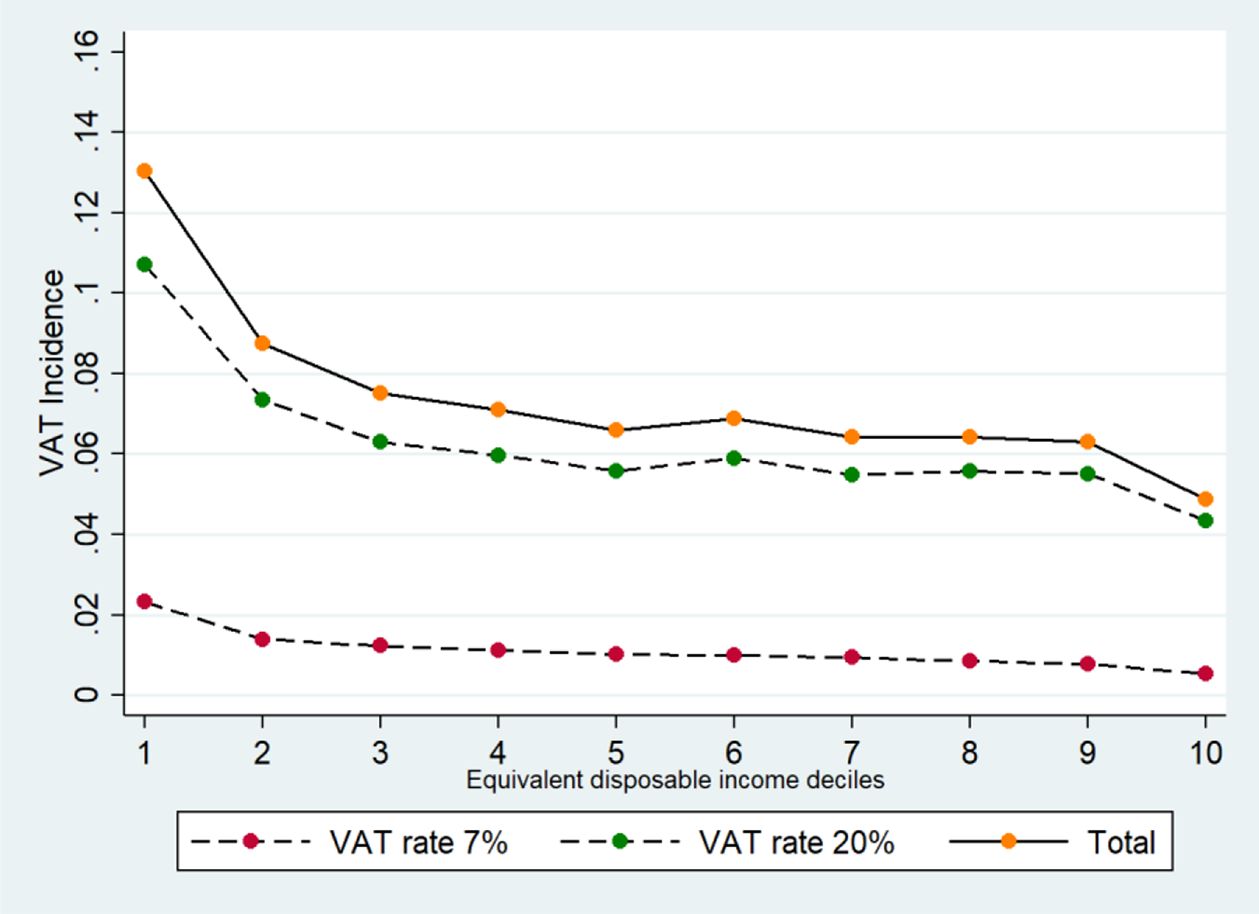
Figure 6
VAT Incidence on Households Income at simulation rates. Source: Authors elaboration. Note: VAT simulation rates are 7% and 20%.
Figure 7
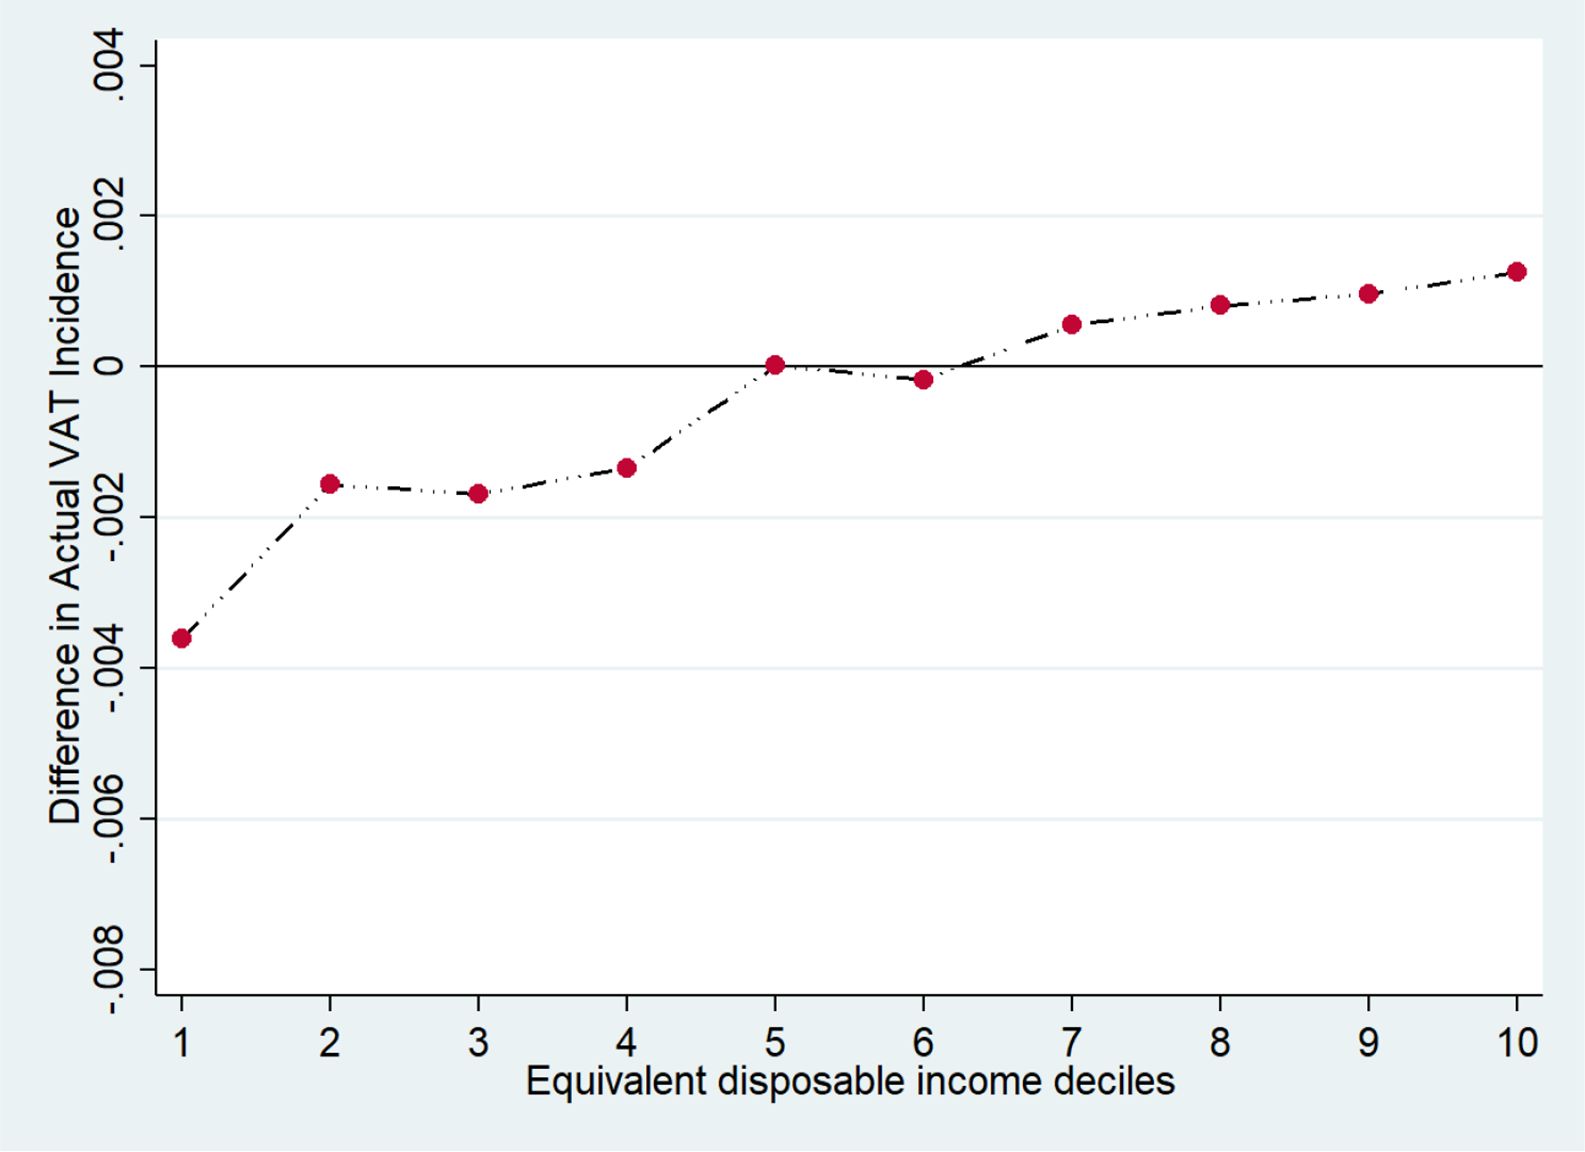

VAT Incidence difference between current legislation and simulation rates. Source: Authors elaboration.
Figure A1

HBS Households Expenditures Distribution before and after a Matching based on estimated consumption using SHIW. Source: Authors elaboration.
Figure A2

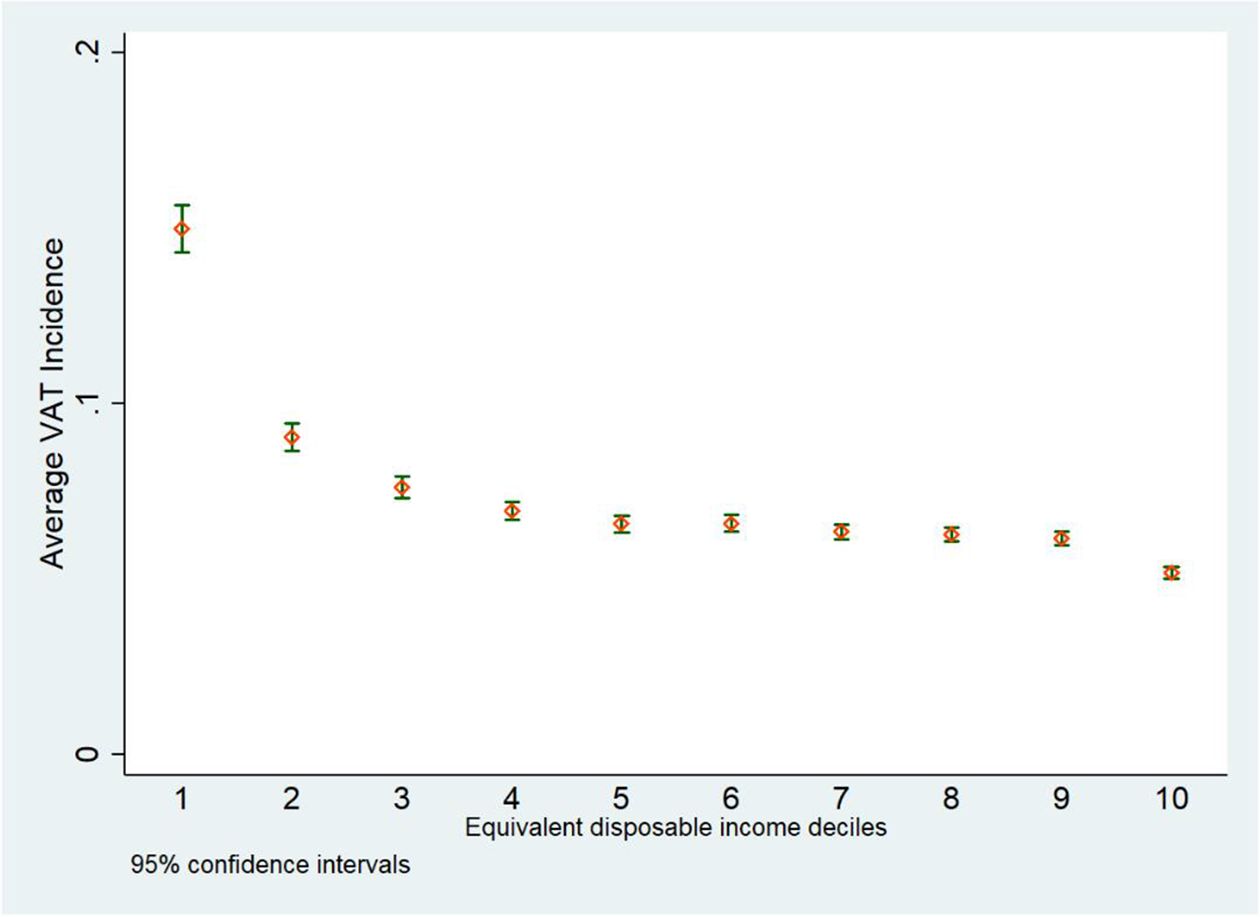
Actual VAT Incidence on Households Disposable Income, by Income Deciles. Source: Authors elaboration. Note: The graph shows the average VAT incidence within each households income decile and the corresponding confidence intervals.
Figure A4
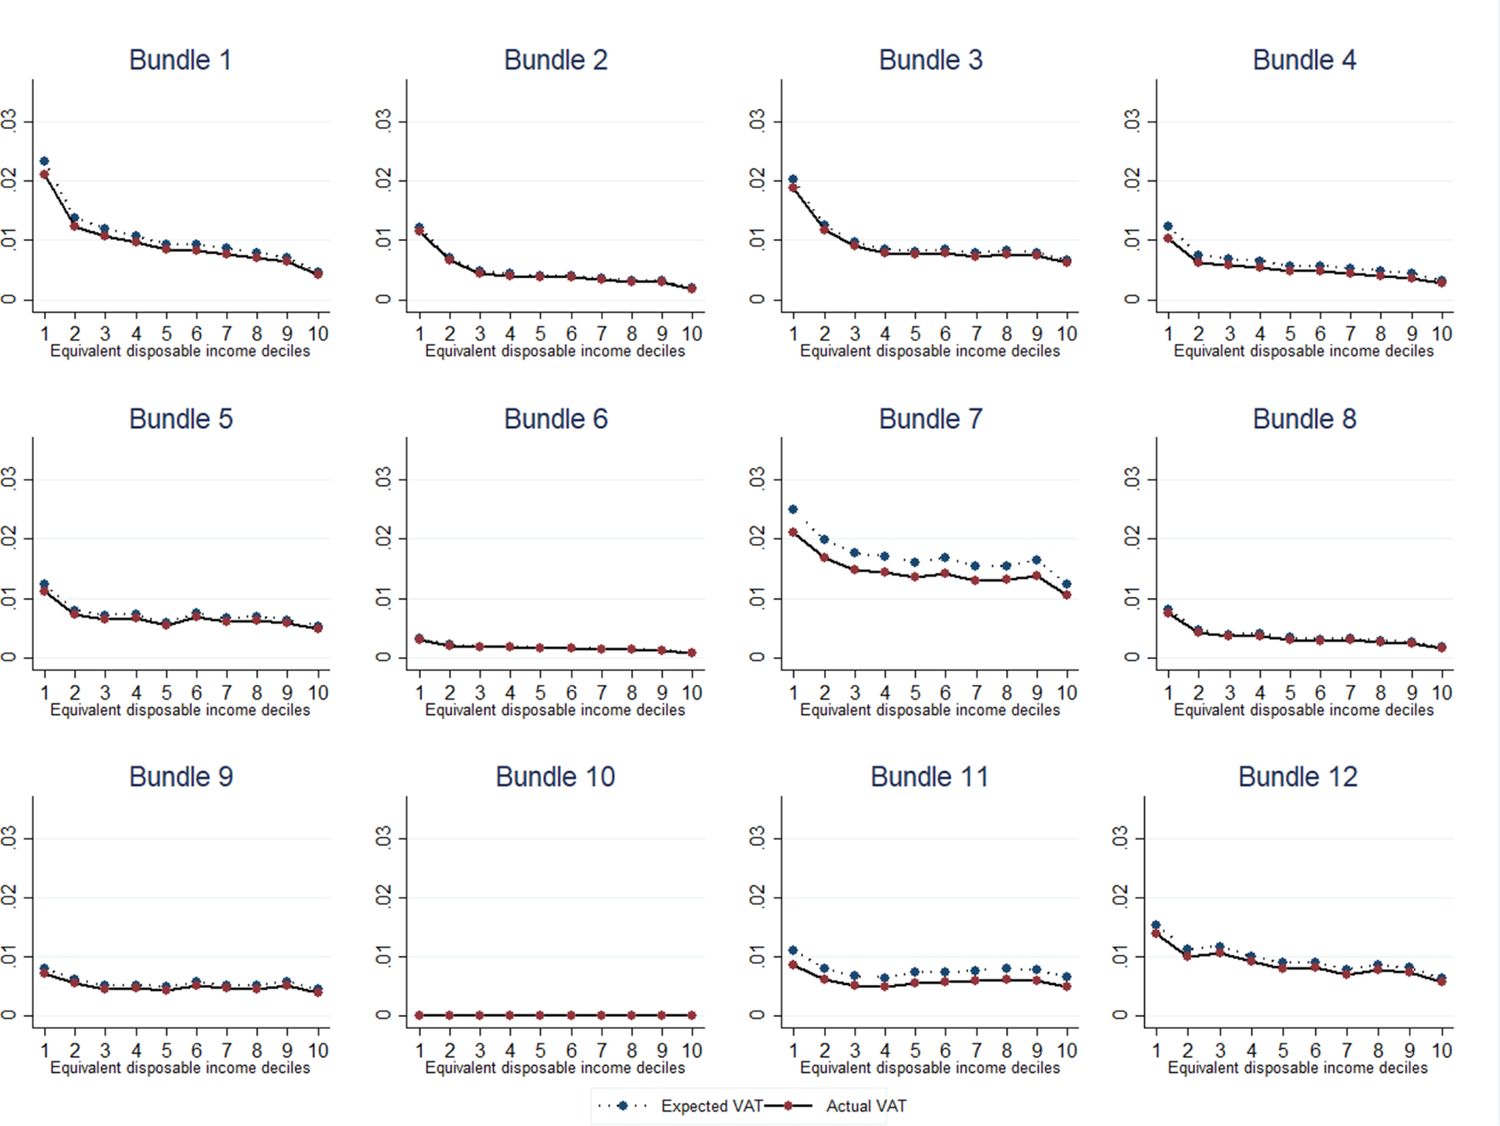
Actual and Expected VAT Incidence, by Bundle. Source: Authors elaboration. Note: The bundles refer, respectively, to: 1-Food and Non-Alcoholic Beverages; 2-Alcoholic Beverages and Tobacco; 3-Clothing and Footwear; 4-Housing, Water, Gas, Electricity and Other Fuels; 5-Furnishings, Household Equipment and Routine Maintenance Of The House; 6-Health; 7-Transport; 8-Communications; 9-Recreation and Culture; 10-Education; 11-Restaurants and Hotels; 12-Miscellaneous Goods and Services.
Figure B4

=Consumption Composition, by Bundle and Income Deciles. Source: Authors elaboration. Note: The bundles refer, respectively, to: 1-Food and Non-Alcoholic Beverages; 2-Alcoholic Beverages and Tobacco; 3-Clothing and Footwear; 4-Housing, Water, Gas, Electricity and Other Fuels; 5-Furnishings, Household Equipment and Routine Maintenance Of The House; 6-Health; 7-Transport; 8-Communications; 9-Recreation and Culture; 10-Education; 11-Restaurants and Hotels; 12-Miscellaneous Goods and Services.
Figure A5
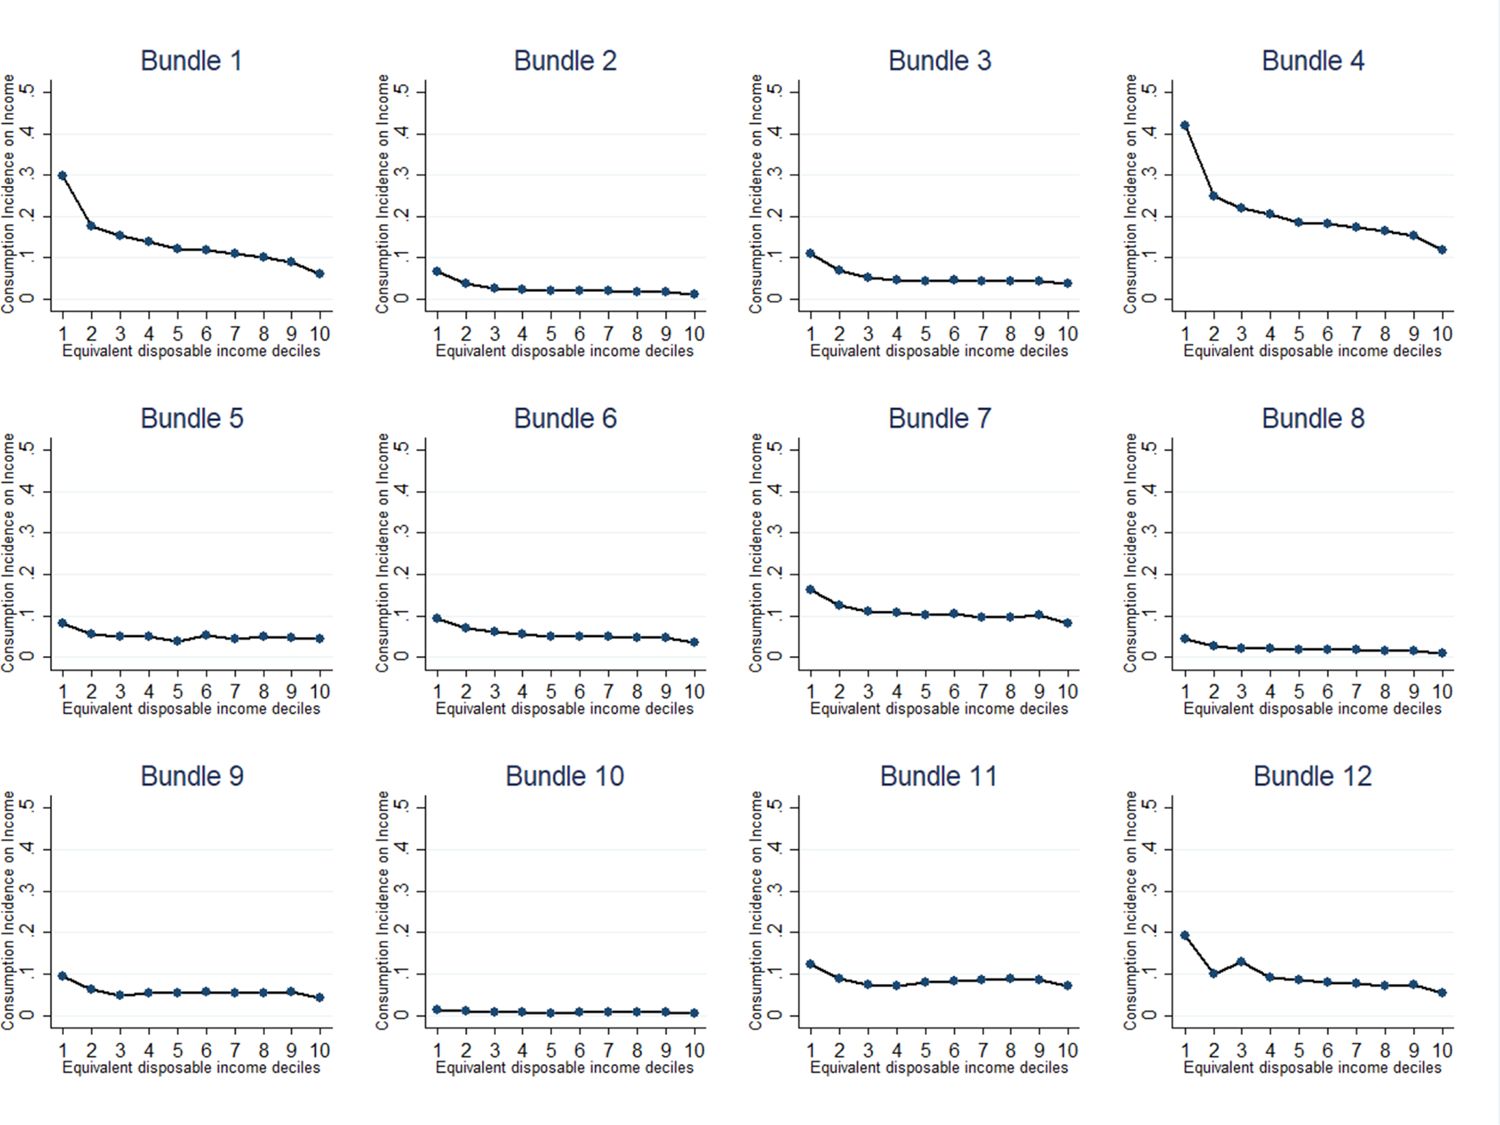
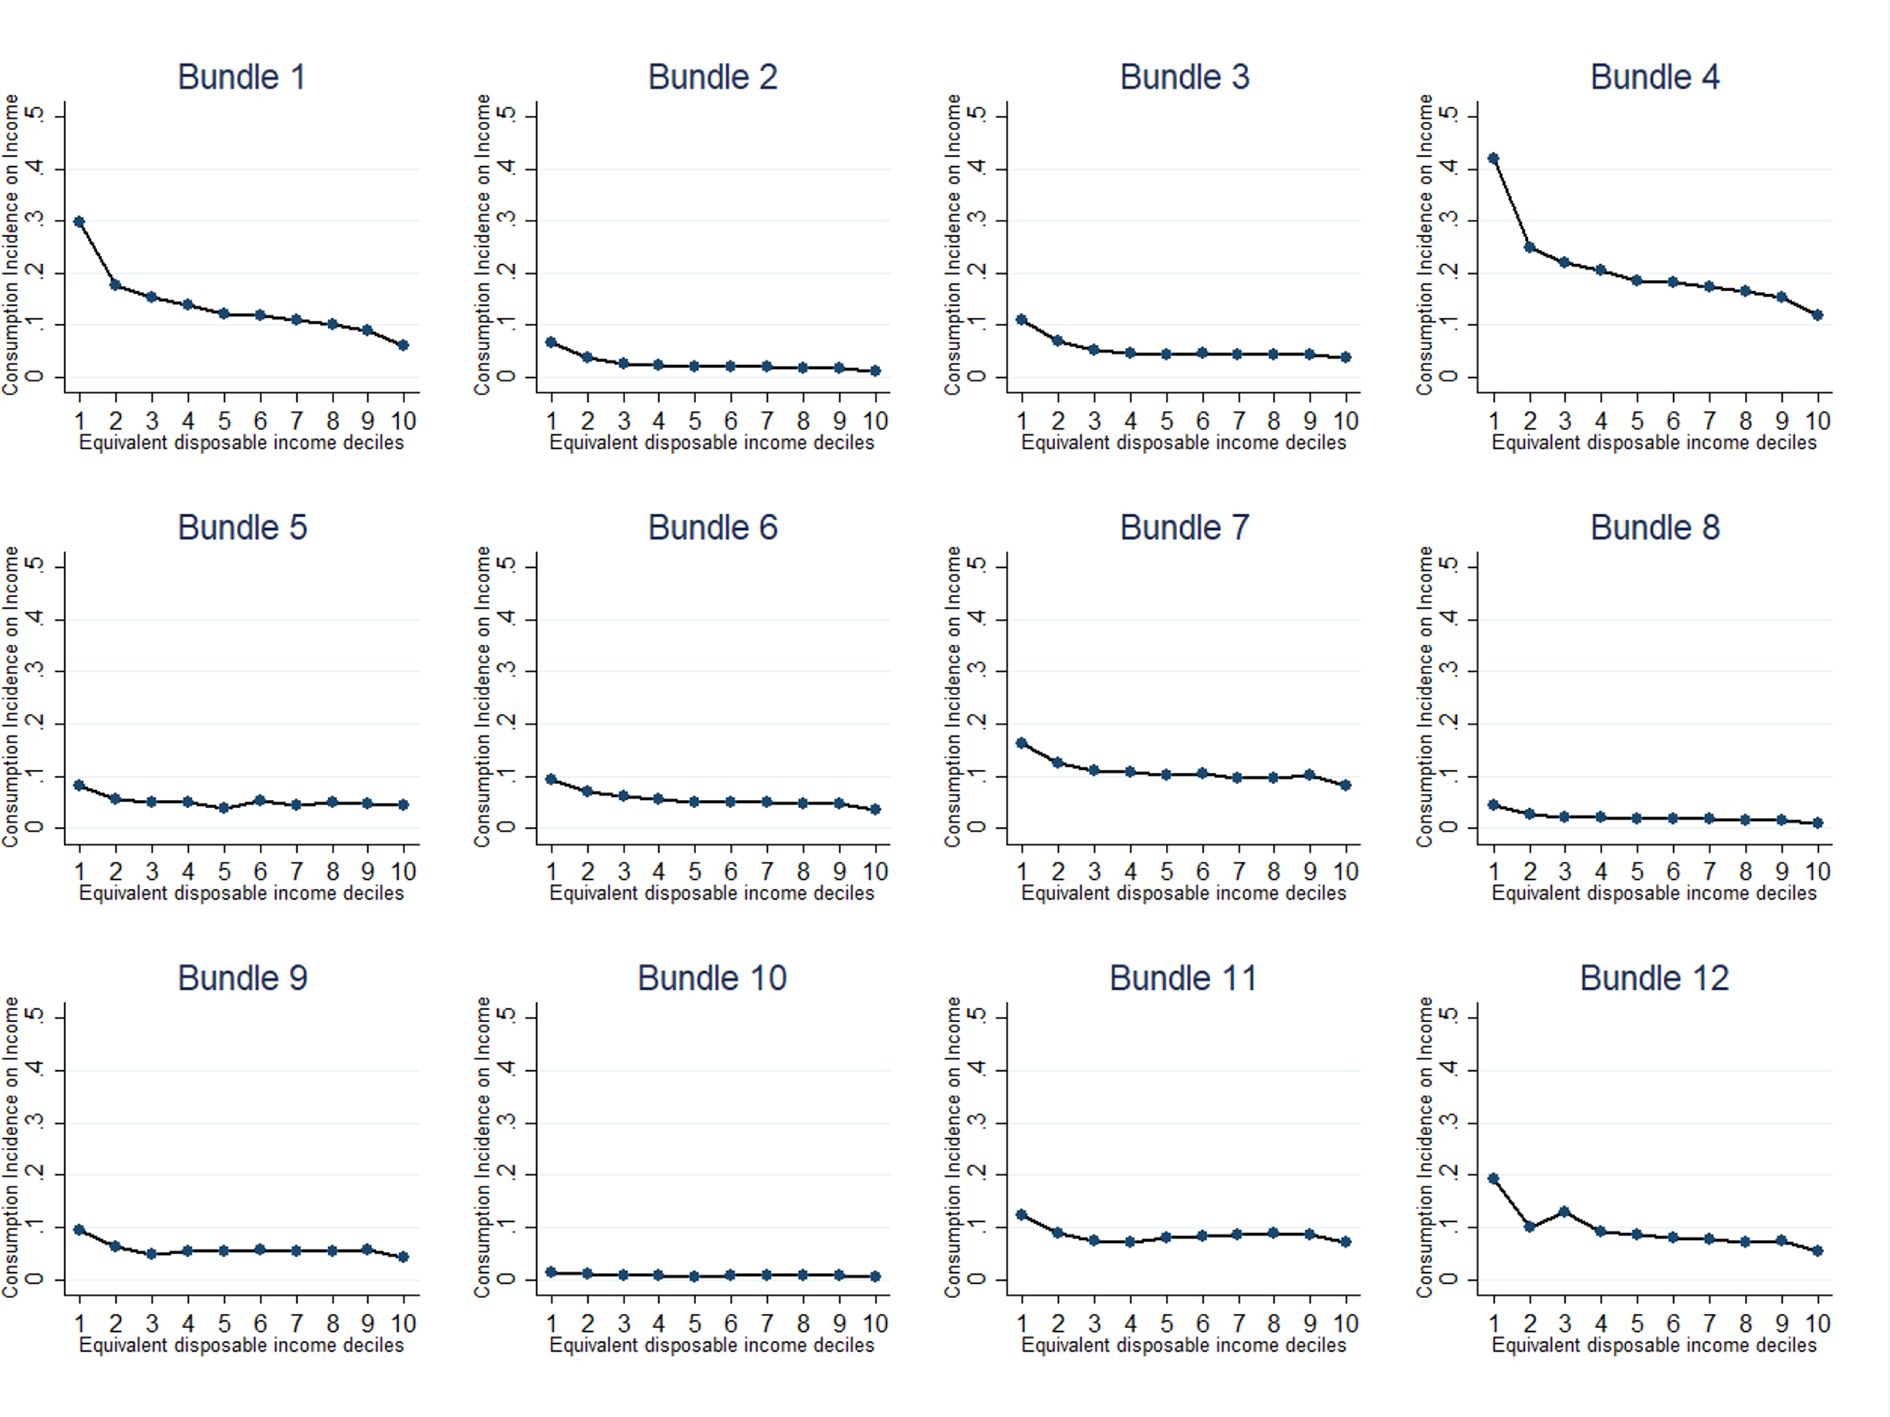
Consumption Incidence on Income, by Bundle. Source: Authors elaboration. Note: The bundles refer, respectively, to: 1-Food and Non-Alcoholic Beverages; 2-Alcoholic Beverages and Tobacco; 3-Clothing and Footwear; 4-Housing, Water, Gas, Electricity and Other Fuels; 5-Furnishings, Household Equipment and Routine Maintenance Of The House; 6-Health; 7-Transport; 8-Communications; 9-Recreation and Culture; 10-Education; 11-Restaurants and Hotels; 12-Miscellaneous Goods and Services.
Figure A6
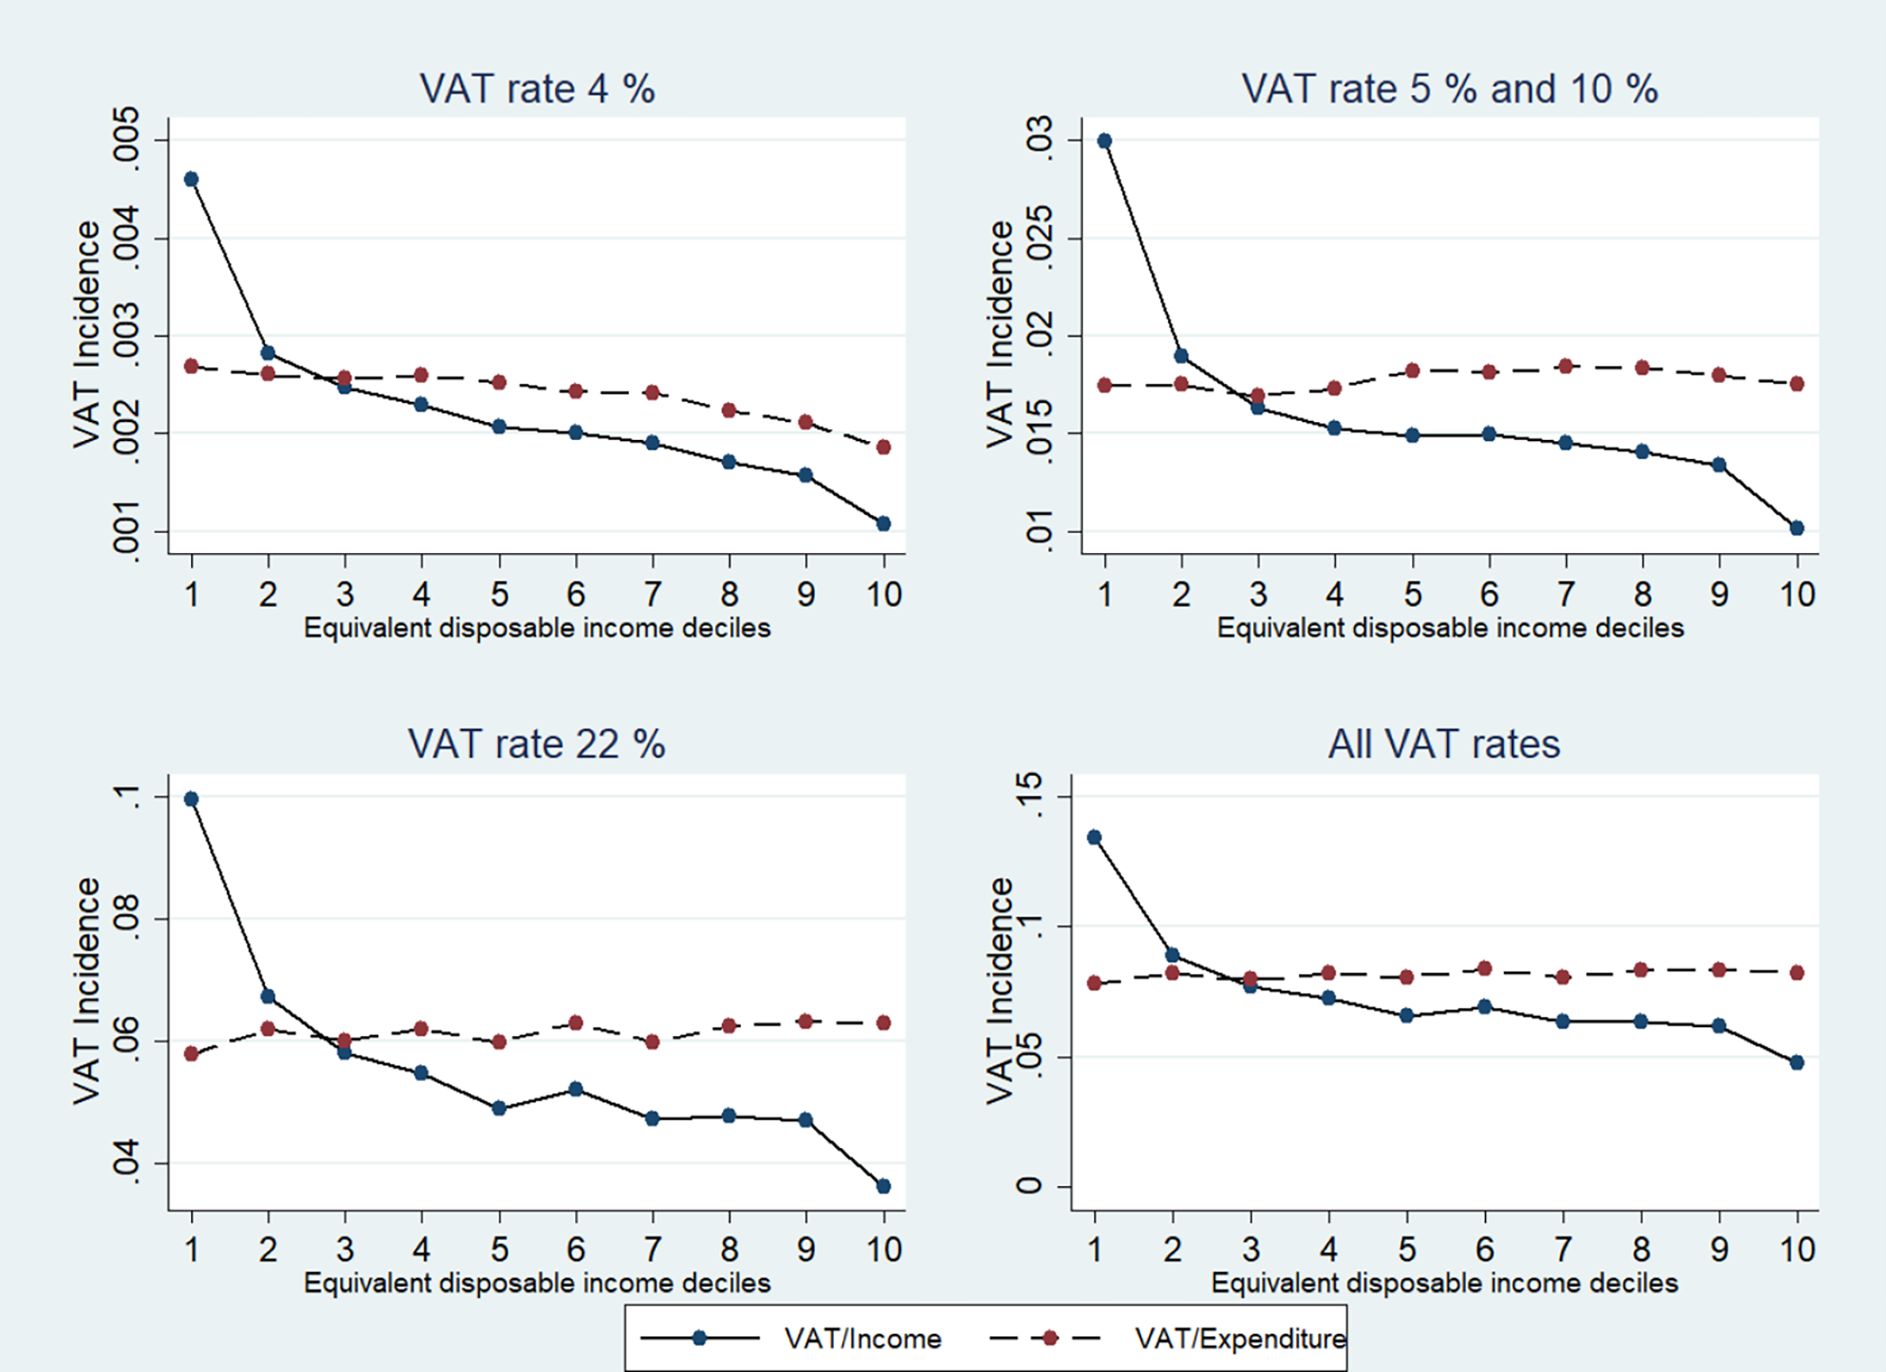

VAT Incidence on Income and Expenditure, by VAT Rates and Income Deciles. Source: Authors elaboration.
Figure A8

Actual VAT Incidence on Households Income at Simulation Rates, by VAT Rates. Source: Authors elaboration.
Figure B8
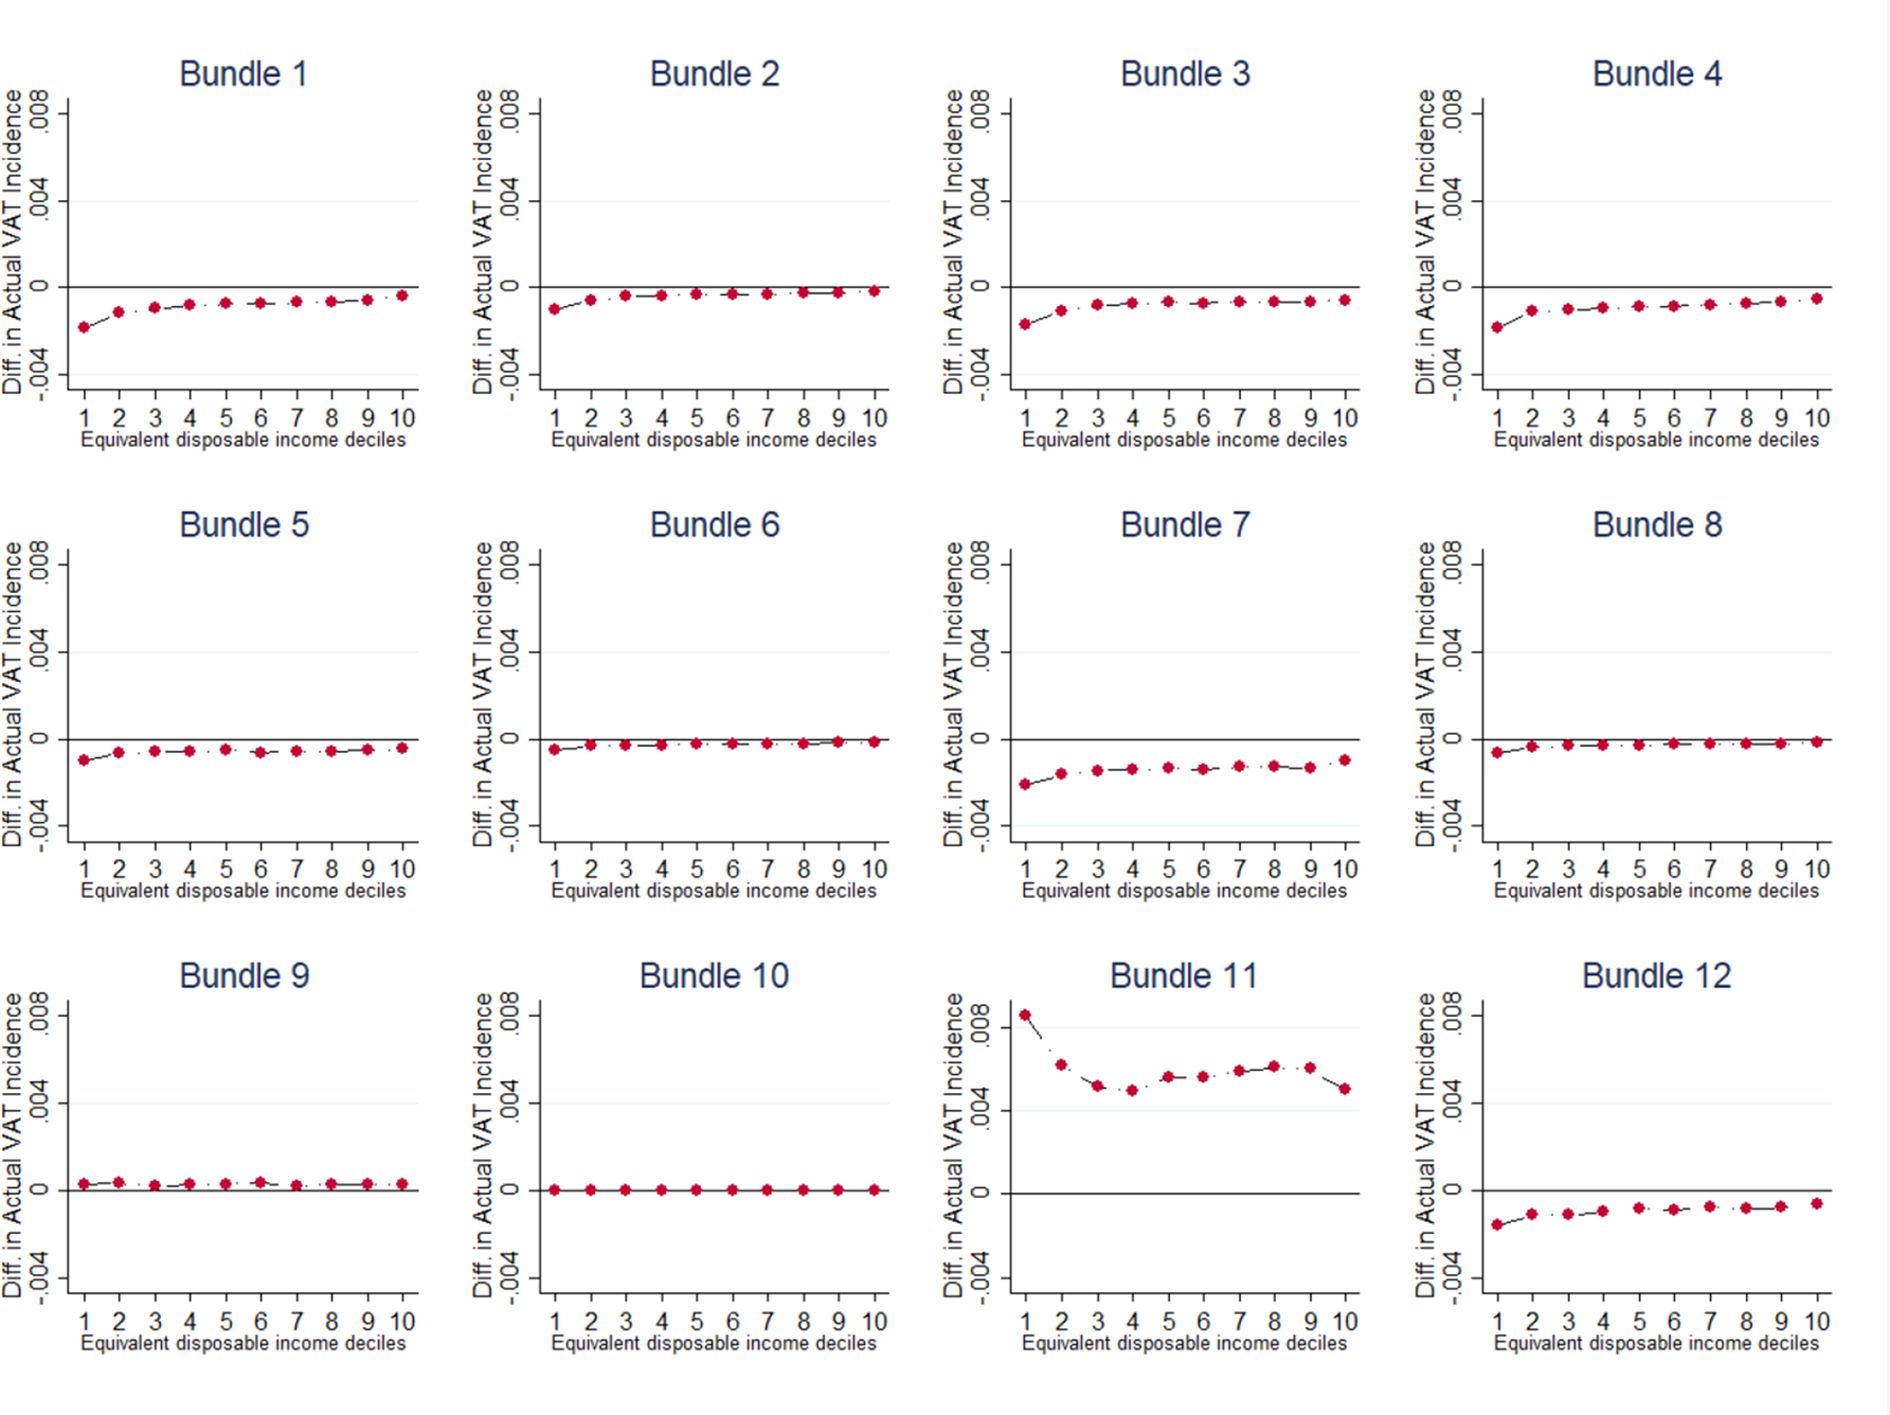
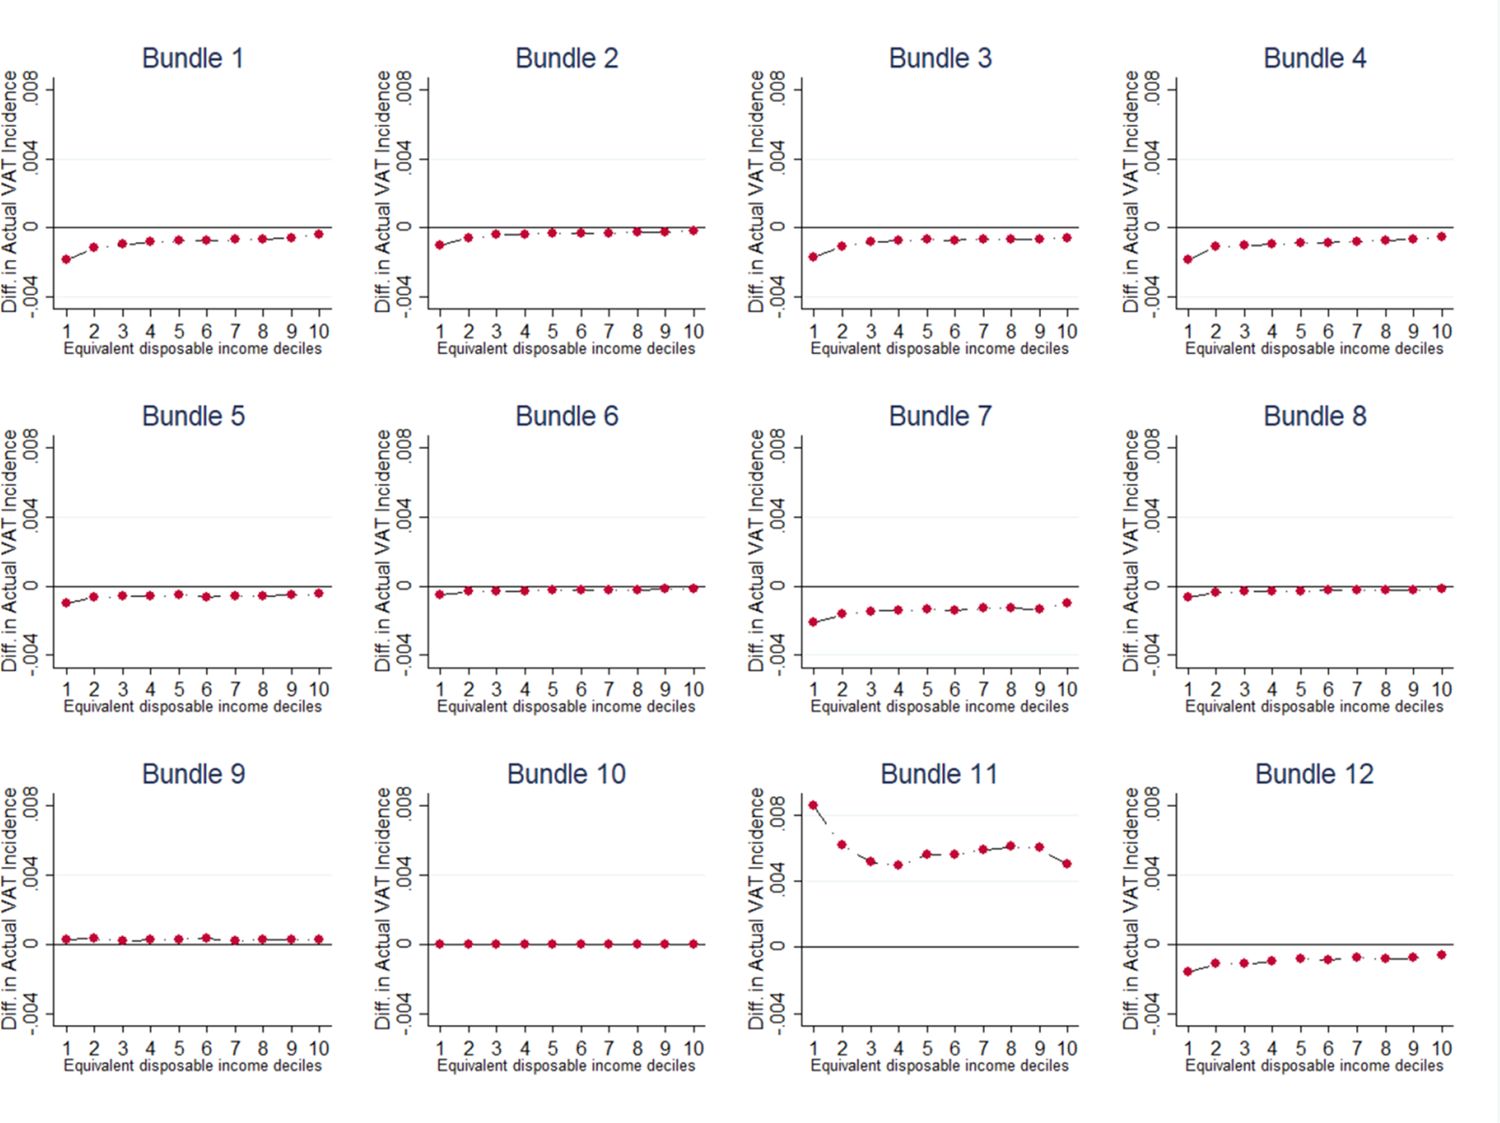
VAT Incidence Difference between Simulation and Current Legislation Rates, by Bundle. Source: Authors elaboration. Note: The bundles refer, respectively, to: 1-Food and Non-Alcoholic Beverages; 2-Alcoholic Beverages and Tobacco; 3-Clothing and Footwear; 4-Housing, Water, Gas, Electricity and Other Fuels; 5-Furnishings, Household Equipment and Routine Maintenance Of The House; 6-Health; 7-Transport; 8-Communications; 9-Recreation and Culture; 10-Education; 11-Restaurants and Hotels; 12-Miscellaneous Goods and Services.
Tables
Table 1
Review of Existing Studies on Italian Datasets Integration
| Authors and Year | Data Sources | ||||
|---|---|---|---|---|---|
| HBS | SILC | SHIW | ISTATMultipurpose | Tax Register | |
| Sisto (2006) | • | • | |||
| Pisano and Tedeschi (2014) | • | • | |||
| Curci and Savegnano (2019) | • | • | |||
| De Vincenti and Pollastri (2004) | • | • | • | ||
| Cifaldi and Neri (2013) | • | • | |||
| Taddei (2012) | • | • | • | ||
| Maitino et al. (2013) | • | • | • | ||
| Giarda et al. (2015) | • | • | • | ||
| Baldini et al. (2015) | • | • | • | ||
| Cammeraat and Crivelli (2020) | • | • | • | ||
| Donatiello et al. (2014) | • | • | |||
| Centro Studi Confindustria (2019) | • | • | |||
| VATSIM-DF (II) | • | • | • |
-
Source: Authors elaboration.
Table 2
Comparison between SILC and HBS Samples before Matching
| Mean in SILC | Mean in HBS | p-value for difference | 95% C.I. | ||
|---|---|---|---|---|---|
| Tax Register household total income | 31,474.26 | 31,375.21 | 0.795 | -648.206 | 846.317 |
| Tax Register household taxable income | 30,584.36 | 30,553.10 | 0.930 | -668.825 | 731.349 |
| Tax Register first-earner total income | 23,972.73 | 24,195.20 | 0.479 | -837.955 | 393.008 |
| Tax Register first-earner taxable income | 23,158.80 | 23,285.98 | 0.673 | -717.342 | 462.993 |
| Tax Register household land and buildings income | 1,641.48 | 1,592.43 | 0.463 | -81.94 | 180.034 |
| Tax Register other household income | 3,260.84 | 3,365.34 | 0.649 | -554.238 | 345.246 |
| First-earner age | 59.49 | 59.02 | 0.006 | 0.136 | 0.798 |
| First-earner sex | 0.59 | 0.60 | 0.002 | -0.026 | -0.006 |
| Household size | 2.16 | 2.32 | 0.000 | -0.186 | -0.137 |
| Number of children | 0.26 | 0.32 | 0.000 | -0.077 | -0.05 |
| First-earner occupation | |||||
| Employed | 0.52 | 0.49 | 0.000 | 0.032 | 0.032 |
| Unemployed | 0.03 | 0.05 | 0.000 | -0.03 | -0.022 |
| Homemaker | 0.04 | 0.08 | 0.000 | -0.041 | -0.032 |
| Retired | 0.38 | 0.36 | 0.000 | 0.017 | 0.036 |
| Student, unable to work or other | 0.03 | 0.02 | 0.000 | 0.012 | 0.019 |
| First-earner education level | |||||
| None | 0.04 | 0.04 | 0.002 | -0.01 | -0.002 |
| Primary education | 0.17 | 0.18 | 0.072 | -0.015 | 0.001 |
| Lower secondary education | 0.27 | 0.28 | 0.423 | -0.013 | 0.005 |
| Vocational education (2-3 years) | 0.07 | 0.08 | 0.326 | -0.008 | 0.003 |
| Upper secondary education | 0.29 | 0.27 | 0.000 | 0.013 | 0.031 |
| University bachelor’s degree | 0.13 | 0.14 | 0.000 | -0.024 | -0.01 |
| Post graduate education | 0.03 | 0.01 | 0.000 | 0.012 | 0.017 |
| Type of Family | |||||
| Single | 0.37 | 0.31 | 0.000 | 0.055 | 0.074 |
| Couple with no children | 0.21 | 0.24 | 0.000 | -0.038 | -0.021 |
| Couple with 1 child | 0.16 | 0.17 | 0.016 | -0.017 | -0.002 |
| Couple with 2 or more children | 0.12 | 0.17 | 0.000 | -0.063 | -0.049 |
| Other | 0.14 | 0.11 | 0.000 | 0.023 | 0.036 |
-
Source: Authors elaboration.
-
Notes: sample weights are not used for estimations.
Table 3
Comparison between SILC and HBS Samples after Matching
| Mean in SILC | Mean in HBS | p-value for difference | 95% C.I. | ||
|---|---|---|---|---|---|
| Tax Register household total income | 31,474.26 | 30,638.12 | 0.075 | -83.54 | 1,755.83 |
| Tax Register household taxable income | 30,584.36 | 30,178.54 | 0.360 | -463.892 | 1,275.54 |
| Tax Register first-earner total income | 23,972.73 | 23,783.18 | 0.595 | -508.693 | 887.787 |
| Tax Register first-earner taxable income | 23,158.80 | 23,201.90 | 0.900 | -717.76 | 631.569 |
| Tax Register household land and buildings income | 1,641.48 | 1,033.65 | 0.000 | 483.753 | 731.91 |
| Tax Register other household income | 3,260.84 | 1,501.07 | 0.000 | 1,363.42 | 2,156.12 |
| First-earner age | 59.49 | 60.67 | 0.000 | -1.672 | -0.676 |
| First-earner sex | 0.59 | 0.62 | 0.000 | -0.05 | -0.02 |
| Household size | 2.16 | 2.01 | 0.000 | 0.123 | 0.187 |
| Number of children | 0.26 | 0.22 | 0.000 | 0.029 | 0.059 |
| First-earner occupation | |||||
| Employed | 0.52 | 0.48 | 0.000 | 0.048 | 0.048 |
| Unemployed | 0.03 | 0.02 | 0.020 | 0.001 | 0.008 |
| Homemaker | 0.04 | 0.03 | 0.017 | 0.001 | 0.01 |
| Retired | 0.38 | 0.45 | 0.000 | -0.076 | -0.046 |
| Student, unable to work or other | 0.03 | 0.02 | 0.000 | 0.015 | 0.023 |
| First-earner education level | |||||
| None | 0.04 | 0.03 | 0.002 | 0.003 | 0.012 |
| Primary education | 0.17 | 0.20 | 0.000 | -0.043 | -0.018 |
| Lower secondary education | 0.27 | 0.29 | 0.009 | -0.032 | -0.004 |
| Vocational education (2-3 years) | 0.07 | 0.05 | 0.000 | 0.014 | 0.026 |
| Upper secondary education | 0.29 | 0.31 | 0.085 | -0.027 | 0.002 |
| University bachelor’s degree | 0.13 | 0.11 | 0.000 | 0.007 | 0.024 |
| Post graduate education | 0.03 | 0.01 | 0.000 | 0.015 | 0.021 |
| Type of Family | |||||
| Single | 0.37 | 0.41 | 0.000 | -0.058 | -0.027 |
| Couple with no children | 0.21 | 0.26 | 0.000 | -0.058 | -0.032 |
| Couple with 1 child | 0.16 | 0.15 | 0.012 | 0.003 | 0.023 |
| Couple with 2 or more children | 0.12 | 0.11 | 0.270 | -0.004 | 0.013 |
| Other | 0.14 | 0.07 | 0.000 | 0.063 | 0.077 |
-
Source: Authors elaboration.
-
Notes: sample weights are not used for estimations.
Table 4
Comparison between SILC and HBS Samples after Matching, by Income Deciles
| Average Household Total Income(Tax Register Data) | p-value for difference | 95% C.I. | |||
|---|---|---|---|---|---|
| SILC | HBS | ||||
| Decile 1 | 109.84 | 97.09 | 0.362 | -14.690 | 40.191 |
| Decile 2 | 6,123.82 | 6,100.1 | 0.853 | -227.601 | 275.042 |
| Decile 3 | 12,119.33 | 12,100.75 | 0.808 | -227.601 | 275.042 |
| Decile 4 | 17,048.14 | 17,003.47 | 0.479 | -79.197 | 168.543 |
| Decile 5 | 21,418.1 | 21,422.48 | 0.944 | -127.396 | 118.644 |
| Decile 6 | 26,253.72 | 26,184.46 | 0.337 | -72.261 | 210.775 |
| Decile 7 | 32,128.57 | 32,141.58 | 0.886 | -191.308 | 165.297 |
| Decile 8 | 40,270.44 | 40,385.72 | 0.382 | -373.659 | 143.105 |
| Decile 9 | 52,844.87 | 52,972.46 | 0.561 | -557.837 | 302.661 |
| Decile 10 | 100,286.9 | 92,542.72 | 0.000 | 3642.137 | 11,846.200 |
-
Source: Authors elaboration.
Table 5
Expected VAT, VAT Gap and Actual VAT, by VAT Rate
| VAT rate | Expected VAT | VAT Gap | Actual VAT |
|---|---|---|---|
| 4% | 2,909,905,600 | 307,970,616 | 2,601,934,984 |
| 5% | 114,201,667 | 17,058,621 | 97,143,046 |
| 10% | 23,543,919,955 | 3,817,302,226 | 19,726,617,733 |
| 22% | 76,787,961,011 | 8,186,778,456 | 68,601,182,579 |
| Total | 103,355,988,233 | 12,329,109,919 | 91,026,878,342 |
-
Source: Authors elaboration.
Table A1
Comparison between SILC and HBS Samples after a Matching based on SHIW
| Mean in SILC | Mean in HBS | p-value for difference | |
|---|---|---|---|
| Total consumption | 19,738.43 | 19,589.20 | 0.437 |
| First-earner age | 59.49 | 59.14 | 0.149 |
| First-earner sex | 0.59 | 0.63 | 0.000 |
| Household size | 2.16 | 2.12 | 0.011 |
| Number of children | 0.26 | 0.27 | 0.498 |
| First-earner occupation | |||
| Employed | 0.52 | 0.52 | 0.285 |
| Unemployed | 0.03 | 0.03 | 0.871 |
| Homemaker | 0.04 | 0.04 | 0.263 |
| Retired | 0.38 | 0.38 | 0.914 |
| Student, unable to work or other | 0.03 | 0.03 | 0.026 |
| First-earner education level | |||
| None | 0.04 | 0.03 | 0.098 |
| Primary education | 0.17 | 0.17 | 0.695 |
| Lower secondary education | 0.27 | 0.29 | 0.024 |
| Vocational education (2-3 years) | 0.07 | 0.07 | 0.243 |
| Upper secondary education | 0.29 | 0.30 | 0.350 |
| University bachelor’s degree | 0.13 | 0.12 | 0.237 |
| Post graduate education | 0.03 | 0.02 | 0.037 |
| Type of Family | |||
| Single | 0.37 | 0.43 | 0.000 |
| Couple with no children | 0.21 | 0.23 | 0.057 |
| Couple with 1 child | 0.16 | 0.16 | 1.000 |
| Couple with 2 or more children | 0.25 | 0.18 | 0.000 |
| Other | 0.00 | 0.00 | 0.000 |
Table B1
Comparison between SILC and HBS samples after an alternative matching procedure based on estimated consumption relying on the SHIW dataset
| Tax Register variables not used in this matching procedure | Mean in SILC | Mean in HBS | p-value for difference |
|---|---|---|---|
| Tax Register household total income | 31,474.26 | 30,324.65 | 0.013 |
| Tax Register household taxable income | 30,584.36 | 29,429.39 | 0.008 |
| Tax Register first-earner total income | 1,641.48 | 1,397.99 | 0.001 |
| Tax Register first-earner taxable income | 3,260.84 | 3,057.20 | 0.424 |
| Tax Register household land and buildings income | 23,972.73 | 24,133.68 | 0.666 |
| Tax Register other household income | 23,158.80 | 23,220.48 | 0.863 |
-
Note: We computed total consumption in SILC by relying on SHIW estimates.
Table A3
Expected and Actual VAT Incidence, by Equivalent Disposable Income Deciles
| Equivalent disposable income deciles | Total Disposable Income | Expected VAT | Actual VAT | Expected VAT Incidence on Income (%) | Actual VAT Incidence on Income (%) |
|---|---|---|---|---|---|
| 1 | 42,656,515,904 | 6,440,205,569 | 5,717,503,164 | 15.1 | 13.4 |
| 2 | 79,589,374,269 | 8,006,812,939 | 7,084,726,118 | 10.1 | 8.9 |
| 3 | 93,403,298,062 | 8,124,126,841 | 7,179,631,781 | 8.7 | 7.7 |
| 4 | 106,856,669,734 | 8,744,791,259 | 7,721,938,519 | 8.2 | 7.2 |
| 5 | 122,544,889,789 | 9,182,400,875 | 8,084,834,747 | 7.5 | 6.6 |
| 6 | 132,819,790,461 | 10,418,560,067 | 9,178,307,726 | 7.8 | 6.9 |
| 7 | 148,735,451,716 | 10,772,263,843 | 9,473,851,362 | 7.2 | 6.4 |
| 8 | 163,114,644,148 | 11,774,392,072 | 10,352,181,184 | 7.2 | 6.3 |
| 9 | 189,448,962,698 | 13,370,000,513 | 11,739,157,681 | 7.1 | 6.2 |
| 10 | 305,787,404,365 | 16,522,434,255 | 14,494,746,061 | 5.4 | 4.7 |
-
Source: Authors elaboration.
Table A7
VAT Simulation Rates
| Bundles | Group of expenditures | VAT rates in current legislation | VAT simulation rates |
|---|---|---|---|
| Food and non-Alcoholic Beverages | Rice, pasta products and couscous | 4%, 10% | 7% |
| Food and non-Alcoholic Beverages | Bread, flours and other cereals | 4% | 7% |
| Food and non-Alcoholic Beverages | Pizza and quiche, other bakery products, breakfast cereals, other cereal products | 10% | 7% |
| Food and non-Alcoholic Beverages | Meat and meat preparations | 10% | 7% |
| Food and non-Alcoholic Beverages | Fresh, chilled or frozen fish. Other preserved or processed fish and seafood-based preparations | 10% | 7% |
| Food and non-Alcoholic Beverages | Fresh, chilled or frozen seafood | 10%, 22% | 7% |
| Food and non-Alcoholic Beverages | Milk and cheese | 4% | 7% |
| Food and non-Alcoholic Beverages | Preserved milk, yoghurt, other milk products | 10% | 7% |
| Food and non-Alcoholic Beverages | Eggs | 10% | 7% |
| Food and non-Alcoholic Beverages | Butter, olive oil, other edible oils | 4% | 7% |
| Food and non-Alcoholic Beverages | Other edible animal fats | 10% | 7% |
| Food and non-Alcoholic Beverages | Fresh, chilled or frozen fruit | 4% | 7% |
| Food and non-Alcoholic Beverages | Dried fruit and nuts | 4%, 10% | 7% |
| Food and non-Alcoholic Beverages | Preserved fruit and fruit-based products | 10%, 22% | 7% |
| Food and non-Alcoholic Beverages | Fresh, chilled or dried vegetables, other preserved or processed vegetables, crisps | 4%, 10% | 7% |
| Food and non-Alcoholic Beverages | Frozen vegetables, potatoes and other tubers and products of tuber vegetables | 4% | 7% |
| Food and non-Alcoholic Beverages | Sugar, jams, marmalades, honey, chocolate, confectionery products, edible ices and ice cream | 10% | 7% |
| Food and non-Alcoholic Beverages | Artificial sugar substitutes | 22% | 20% |
| Food and non-Alcoholic Beverages | Sauces, condiments, baby food, ready-made meals, other food products n.e.c. | 10% | 7% |
| Food and non-Alcoholic Beverages | Salt, spices and culinary herbs | 5%, 10%, 22% | 7% |
| Food and non-Alcoholic Beverages | Coffee and tea | 10%, 22% | 7% |
| Food and non-Alcoholic Beverages | Cocoa and powdered chocolate | 10% | 7% |
| Food and non-Alcoholic Beverages | Mineral waters, soft drinks, fruit and vegetable juices | 22% | 20% |
| Alcoholic Beverages and Tobacco | Spirits and liqueurs | 22% | 20% |
| Alcoholic Beverages and Tobacco | Tobacco | 22% | 20% |
| Clothing and Footwear | Clothing and footwear | 22% | 20% |
| Housing, Water, Gas, Electricity and Other Fuels | Actual rentals paid by tenants for primary and secondary residences | 0%, 10% | 0%, 20% |
| Housing, Water, Gas, Electricity and Other Fuels | Garage rentals and other rentals paid by tenants | 0%, 22% | 0%, 20% |
| Housing, Water, Gas, Electricity and Other Fuels | Imputed rentals of owner-occupiers and other imputed rentals | 0% | 0% |
| Housing, Water, Gas, Electricity and Other Fuels | Materials for the maintenance and repair of the dwelling | 22% | 20% |
| Housing, Water, Gas, Electricity and Other Fuels | Services for the maintenance and repair of the dwelling | 10% | 7% |
| Housing, Water, Gas, Electricity and Other Fuels | Water supply | 10% | 7% |
| Housing, Water, Gas, Electricity and Other Fuels | Refuse and sewage collection | 0% | 0% |
| Housing, Water, Gas, Electricity and Other Fuels | Maintenance charges in multi-occupied buildings | 0%, 10%, 22% | 0%, 7%, 20% |
| Housing, Water, Gas, Electricity and Other Fuels | Security services | 22% | 20% |
| Housing, Water, Gas, Electricity and Other Fuels | Other services related to dwelling | 10%, 22% | 7%, 20% |
| Housing, Water, Gas, Electricity and Other Fuels | Electricity | 10% | 7% |
| Housing, Water, Gas, Electricity and Other Fuels | Natural gas through networks, liquefied hydrocarbons | 10%, 22% | 7%, 20% |
| Housing, Water, Gas, Electricity and Other Fuels | Liquid fuels, solid fuels | 22% | 20% |
| Housing, Water, Gas, Electricity and Other Fuels | Other energy for heating and cooling | 10% | 7% |
| Furnishings, Household Equipment and Routine Household Maintenance | Furniture, furnishings, carpets and floor coverings | 22% | 20% |
| Furnishings, Household Equipment and Routine Household Maintenance | Services of laying of fitted carpets and floor coverings | 10% | 7% |
| Furnishings, Household Equipment and Routine Household Maintenance | Household textiles | 22% | 20% |
| Furnishings, Household Equipment and Routine Household Maintenance | Major and small household appliances | 22% | 20% |
| Furnishings, Household Equipment and Routine Household Maintenance | Glassware, tableware and household utensils | 22% | 20% |
| Furnishings, Household Equipment and Routine Household Maintenance | Domestic services by paid staff | 0% | 0% |
| Furnishings, Household Equipment and Routine Household Maintenance | Other goods and services for routine household maintenance | 22% | 20% |
| Health | Pharmaceutical products | 10%, 22% | 7%, 20% |
| Health | Therapeutic appliances and equipment | 4% | 7% |
| Health | Repair of therapeutic appliances and equipment | 22% | 20% |
| Health | Out-patient and hospital services | 0% | 0% |
| Transport | New motor cars | 4%, 22% | 7%, 20% |
| Transport | Second-hand motor cars | 0%, 4%, 22% | 0%, 7%, 20% |
| Transport | Motor cycles and bicycles | 22% | 20% |
| Transport | Spare parts and accessories for personal transport equipment | 22% | 20% |
| Transport | Fuels and lubricants for personal transport equipment. Maintenance, repair and other services in respect of personal transport equipment | 22% | 20% |
| Transport | Driving lessons, tests, licences and road worthiness tests | 0%, 22% | 0%, 20% |
| Transport | Passenger transport by railway | 0%, 10% | 0%, 7% |
| Transport | Passenger transport by road | 0%, 10% | 0%, 7% |
| Transport | Passenger transport by air | 0%, 10% | 0%, 7% |
| Transport | Passenger transport by sea and inland waterway | 0%, 5%, 10% | 0%, 7% |
| Transport | Combined passenger transport | 0%, 5%, 10% | 0%, 7% |
| Transport | Funicular, cable-car and chair-lift transport | 10% | 7% |
| Transport | Other purchased transport services | 22% | 20% |
| Communication | Postal services | 0%, 22% | 0%, 20% |
| Communication | Telephone and telefax equipment | 22% | 20% |
| Communication | Telephone and telefax services and other information transmission services | 22% | 20% |
| Recreation and Culture | Equipment for the reception, recording and reproduction of sound and picture. Other major durables for recreation and culture | 22% | 20% |
| Recreation and Culture | Games, toys and hobbies. Equipment for sport, camping and open-air recreation | 22% | 20% |
| Recreation and Culture | Plants and flowers | 10% | 20% |
| Recreation and Culture | Garden products. Pets and related products and services | 22% | 20% |
| Recreation and Culture | Recreational and sporting services | 10%, 22% | 20% |
| Recreation and Culture | Cinemas, theatres, concerts | 10% | 20% |
| Recreation and Culture | Museums, libraries, zoological gardens | 0% | 0% |
| Recreation and Culture | Television and radio licence fees, subscriptions | 0%, 4%, 22% | 0%, 7%, 20% |
| Recreation and Culture | Hire of equipment and accessories for culture, photographic services, other cultural services | 22% | 20% |
| Recreation and Culture | Games of chance | 0% | 0% |
| Recreation and Culture | Books | 4% | 7% |
| Recreation and Culture | Binding services and E-book downloads | 22% | 20% |
| Recreation and Culture | Newspapers and periodicals | 4% | 7% |
| Recreation and Culture | Miscellaneous printed matter. Stationery and drawing materials | 22% | 20% |
| Recreation and Culture | Package domestic holidays | 10%, 22% | 20% |
| Recreation and Culture | Package international holidays | 0%, 22% | 0%, 20% |
| Education | Education | 0% | 0% |
| Restaurants and Hotels | Restaurants, cafés and the like | 10% | 20% |
| Restaurants and Hotels | Canteens | 4% | 7% |
| Restaurants and Hotels | Accommodation services | 10% | 20% |
| Miscellaneous Goods and Services | Hairdressing salons and personal grooming establishments. Appliances, articles and products for personal care. Personal effects n.e.c. | 22% | 20% |
| Miscellaneous Goods and Services | Female sanitary towels and babies nappies | 22% | 7% |
| Miscellaneous Goods and Services | Child care services | 0% | 0% |
| Miscellaneous Goods and Services | Retirement homes for elderly persons and residences for disabled persons. Services to maintain people in their private homes | 0%, 4%, 5%, 10%, 22% | 0%, 7%, 20% |
| Miscellaneous Goods and Services | Consuelling | 22% | 20% |
| Miscellaneous Goods and Services | Insurance | 0% | 0% |
| Miscellaneous Goods and Services | Other financial services n.e.c. | 0%, 22% | 0%, 20% |
-
Source: Authors elaboration.
Data and code availability
Data and programs cannot be published in an openly accessible trusted data repository, therefore we commit to preserving data and code for a period of no less than five years following publication of the manuscript, and to providing reasonable assistance to requests for clarification and replication.
Download links
A two-part list of links to download the article, or parts of the article, in various formats.