Comparing Register and Survey Wealth Data
- National Institute of Economic Research, Sweden
- Department of Economics, Sweden
Cite this article
as: F. Johansson-Tormod, A. Klevmarken; 2022; Comparing Register and Survey Wealth Data; International Journal of Microsimulation; 15(1); 43-62.
doi: 10.34196/ijm.00249
Figures
Figure 1
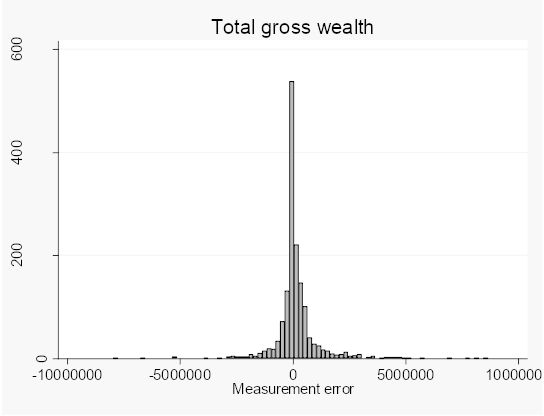
The distribution of the difference between total gross wealth from the SHARE-SE survey and the corresponding register measure from LINDA.
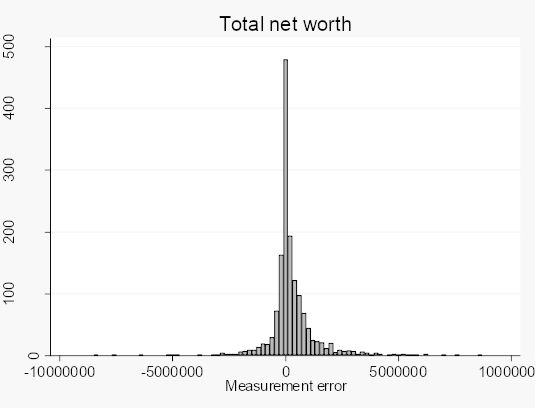
Figure 2

The distribution of the difference between total net worth from the SHARE-SE survey and the corresponding register measure from LINDA.
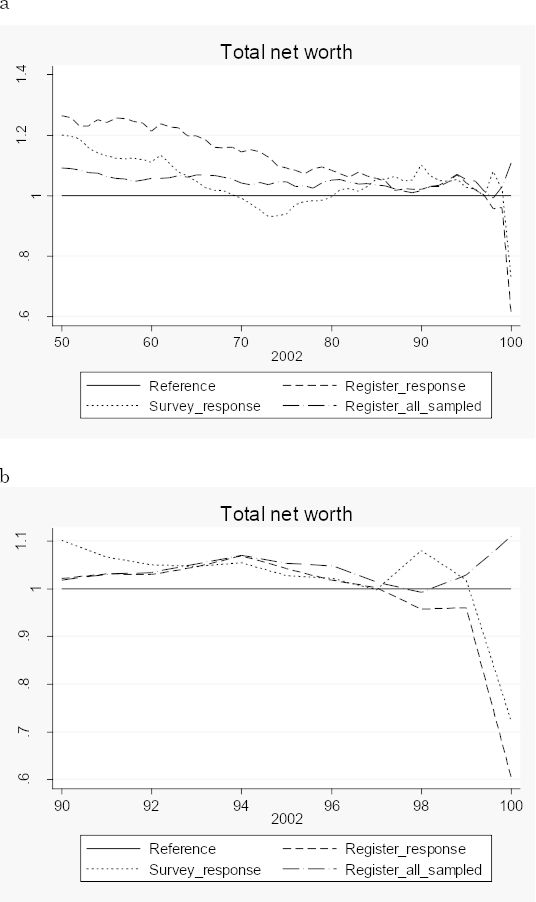
Figure 3

Ratios of total net worth means from the RAND-UU survey to means from LINDA, by total net worth percentiles
Figure 4
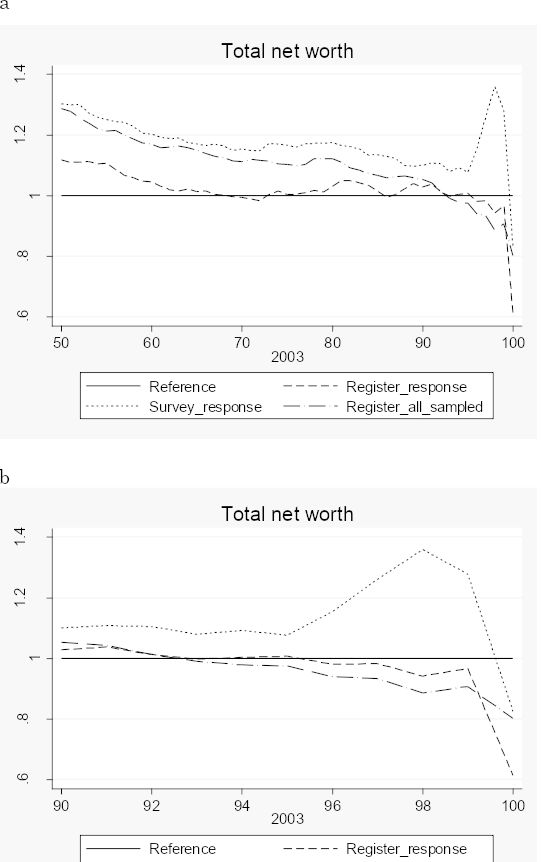
Ratios of total net worth means from the SHARE_SE survey to means from LINDA, by total net worth percentiles
Tables
Table 1
Correspondence between survey questions and register definitions for assets included in total net worth
| Asset | UU-RAND | SHARE_SE | Register |
|---|---|---|---|
| Own home | What is the market value of your home, i.e., what would you get for it if you sold it today? | In your opinion, how much would you receive if you sold your property today? | FFSTEGM: Market value of residential home. FBORMH; Market value of tenant owned apartment. |
| Other real property | What is the market value of your property? Refers to holiday homes or time-share apartments for leisure purposes. | In your opinion, how much would you receive if you sold your property today? Includes secondary homes, holiday homes, other real estate, land or forestry. | FFSTFRM: Market value of holiday home The following variables are only included for SHARE_SE: FFSTHYM: Market value of owned apartment houses. FFSTINM: Market value of owned industrial premises. FFSTJBM: Market value of owned farm property. FFSTEJM: Market value of buildings on farm property. FFSTUM: Market value of real estates abroad. |
| Bank holdings | If you added up the balances of these accounts how much would they amount to? Includes checking account, bank or postal giro account, savings account, capital account or other account, such as an ICA account or OK account. | About how much did you have in bank accounts, transaction accounts or saving accounts? | FKUBANK: The total amount on bank accounts. |
| Bonds | If you had sold these bonds at the end of 2002, how much would you have received for them? Includes Swedish and foreign bonds, national, municipal and business bonds, as well as premiums and savings bonds. | About how much did you have in government or corporate bonds? | FKUPREM: Market value of premium bonds. FKUVPR: Market value of interest-bearing securities. |
| Stocks and shares | If you had sold these stocks how much would you have received from their sale? Includes both Swedish and foreign stocks and both listed and unlisted stocks. | About how much did you have in stocks or shares (listed or unlisted)? | FOTCMV: Market value of stocks on the OTC or O list. FAKTIBMV: Market value of stocks on the A list. FAALMV: Market value of stocks on the lists “nya marknader” and aktietorget.* |
| Mutual funds | If you had sold these funds, how much would you have received for them? Includes stock funds, bond funds or mixed funds | About how much did you have in mutual funds or managed investments accounts? | FRFONMV: Market value of interest funds. FOFOMV: Market value of other funds than interest funds. |
| Total debt | This variable is the sum of the following three survey questions; (i) How much of a loan did you have all together on your dwelling at the end of 2002? (ii) How much did these loans amount to all together on the last day of December 2002? (Refers to weekend homes or time-share apartments for leisure purposes). (iii) How much did your total debt amount to on the last day of December 2002? (The respondents are asked to exclude the debts defined in (i) and (ii) above. | How much did you owe in total? | FKURTA: Is equal to total debt to financial institutions. FKUSKOP: Is equal to issued option contracts (debts) FSKURST: Other debt. |
-
*
The latter two lists include small companies that are not yet qualified for the “official” lists.
Table 2
Descriptive statistics for true and estimated market values by property, sales data 2003
| Variable | Median* | Mean* | Std dev* | Skewness | Kurtosis | N |
|---|---|---|---|---|---|---|
| Own home | ||||||
| Estimate | 962.2 | 1 240.5 | 963.9 | 1.99 | 5.87 | 54.253 |
| True | 942.4 | 1 222.6 | 950.9 | 1.88 | 5.57 | 54.253 |
| Difference | 27.0 | 17.9 | 316.8 | -0.74 | 14.74 | 54.253 |
| Corr(True. Difference) -0.125 (<0.001) | ||||||
| Holiday homes | ||||||
| Estimate | 585.8 | 791.2 | 697.6 | 3.68 | 22.42 | 9.231 |
| True | 553.8 | 792.5 | 757.3 | 3.45 | 19.07 | 9.231 |
| Difference | 32.4 | -1.2 | 350.6 | -1.97 | 25.84 | 9.231 |
| Corr(True. Difference) - 0.395 (<0.001) | ||||||
| Apartment Houses | ||||||
| Estimate | 2.577.3 | 10 932.2 | 31 675.6 | 8.82 | 103.47 | 2.009 |
| True | 2.502.0 | 9 749.4 | 25 229.6 | 7.47 | 76.35 | 2.009 |
| Difference | 133.8 | 1 182.8 | 9 742.6 | 15.25 | 287.69 | 2.009 |
| Corr(True. Difference) 0.553 (<0.001) | ||||||
| Farm property | ||||||
| Estimate | 830.4 | 1 147.8 | 1 140.8 | 2.73 | 11.05 | 3.064 |
| True | 753.1 | 1 081.8 | 1 114.5 | 2.77 | 11.61 | 3.064 |
| Difference | 34.6 | 66.0 | 562.1 | 1.15 | 14.13 | 3.064 |
| Corr(True. Difference) -0.205 (<0.001) | ||||||
-
Note: p-values within parenthesis.
-
*
Expressed in 1.000 SEK.
Table 3
Descriptive statistics for SHARE_SE and corresponding register data
| Variable | Median | Mean | Std Dev | N |
|---|---|---|---|---|
| Own home | ||||
| Survey | 885 981 | 1 166 758 | 1 015 617 | 1,398 |
| Register | 808 750 | 1 022 380 | 922 035 | 1,398 |
| Difference | 42 943 | 144 377 | 771 502 | 1,398 |
| Other real property | ||||
| Survey | 492 212 | 889 140 | 1 513 275 | 645 |
| Register | 327 570 | 711 910 | 1 652 271 | 645 |
| Difference | 98 442 | 177 230 | 1 244 990 | 645 |
| Bank | ||||
| Survey | 49 221 | 130 524 | 224 029 | 1,511 |
| Register | 49 773 | 130 198 | 223 480 | 1,511 |
| Difference | 984 | 326 | 139 202 | 1,511 |
| Bonds | ||||
| Survey | 49 221 | 84 537 | 127 470 | 307 |
| Register | 26 025 | 74 517 | 145 690 | 307 |
| Difference | -166 | 10 020 | 91 416 | 307 |
| Stocks | ||||
| Survey | 49 221 | 191 236 | 344 467 | 685 |
| Register | 34 100 | 153 676 | 382 360 | 685 |
| Difference | 4 384 | 37 560 | 293 909 | 685 |
| Mutual funds | ||||
| Survey | 98 442 | 181 519 | 266 968 | 934 |
| Register | 109 631 | 219 918 | 301 978 | 934 |
| Difference | -5 322 | -38 399 | 229 176 | 934 |
| Total debt | ||||
| Survey | 246 106 | 409 761 | 837 956 | 731 |
| Register | 300 987 | 448 269 | 738 448 | 731 |
| Difference | -22 885 | -38 508 | 551 117 | 731 |
| Total gross wealth | ||||
| Survey | 984 423 | 1 406 966 | 1 701 859 | 1,531 |
| Register | 838 014 | 1 282 001 | 1 697 605 | 1,531 |
| Difference | 15 555 | 124 964 | 1 020 692 | 1,531 |
| Total net worth | ||||
| Survey | 821 993 | 1 251 162 | 1 530 660 | 1,515 |
| Register | 613 865 | 1 007 839 | 1 432 051 | 1,515 |
| Difference | 70 404 | 243 323 | 1 095 564 | 1,515 |
Table 4
The relative importance of measurement errors in estimating the variance of an asset, by type of asset
| Asset | Var(W) | Var(W*) | Var(u) | A = ρ(W*,u) | B = S(u)/S(W*) | 1+2(A/B) | ||
|---|---|---|---|---|---|---|---|---|
| Own home | 1.03E+12 | 8.50E+11 | 5.95E+11 | |||||
| Own home, corrected | 1.03E+12 | 9.04E+11 | 4.95E+11 | -0.275 | 0.740 | 0.257 | ||
| Other real estate | 2.29E+12 | 2.73E+12 | 1.55E+12 | |||||
| Bank accounts | 5.02E+10 | 4.99E+10 | 1.94E+10 | -0.307 | 0.623 | 0.013 | ||
| Bonds | 1.62E+10 | 2.12E+10 | 8.36E+09 | -0.501 | 0.627 | -0.596 | ||
| Stocks | 1.19E+11 | 1.46E+11 | 8.64E+10 | -0.507 | 0.769 | -0.319 | ||
| Mutual funds | 7.13E+10 | 9.12E+10 | 5.25E+10 | -0.523 | 0.759 | -0.379 | ||
| Debts | 7.02E+11 | 5.45E+11 | 3.04E+11 | -0.180 | 0.746 | 0.517 | ||
| Gross wealth | 2.90E+12 | 2.88E+12 | 1.04E+12 | |||||
| Net wealth | 2.34E+12 | 2.05E+12 | 1.20E+12 |
Table 5
Variances and correlation coefficients of asset components
| True components | Error components | |||||||||||
|---|---|---|---|---|---|---|---|---|---|---|---|---|
| Own home | Bank | Bonds | Stocks | Mutual Funds | Debts | Own home | Bank | Bonds | Stocks | Mutual Funds | Debts | |
| Own home | 9.04E+11 | -0.275 | ||||||||||
| Bank | 4.99E+10 | 0.081 | 0.244 | 0.406 | 0.100 | -0.307 | 0.264 | -0.078 | -0.091 | -0.019 | ||
| Bonds | 2.12E+10 | -0.005 | 0.104 | -0.050 | -0.013 | -0.501 | -0.027 | -0.090 | -0.050 | |||
| Stocks | 1.46E+11 | 0.265 | 0.096 | -0.222 | 0.072 | -0.507 | 0.218 | 0.026 | ||||
| Mutual Funds | 9.12E+10 | 0.025 | -0.084 | 0.181 | -0.100 | -0.523 | 0.015 | |||||
| Debts | 5.45E+11 | -0.160 | 0.049 | 0.035 | -0.001 | -0.180 | ||||||
| Own home | 4.95E+11 | |||||||||||
| Bank | 1.94E+10 | 0.064 | 0.128 | 0.049 | 0.035 | |||||||
| Bonds | 8.36E+09 | 0.109 | 0.084 | 0.076 | ||||||||
| Stocks | 8.64E+10 | -0.104 | 0.070 | |||||||||
| Mutual Funds | 5.25E+10 | 0.022 | ||||||||||
| Debts | 3.04E+11 | |||||||||||
Table 6
Estimated regression slopes with measurement errors in the dependent variable
| Dep. var | ||||||
|---|---|---|---|---|---|---|
| Indep. var | Age | Gender | ||||
| Own home | -12,654 | -8,821 | -3,833 | -95,289 | -45,449 | -49,840 |
| Other real estate | -5,323 | -1,845 | -3,478 | -130,307 | -210,552 | 80,245 |
| Bank accounts | 1,836 | 2,007 | -171 | -568 | 1,685 | -2,252 |
| Bonds | 557 | 931 | -374 | -1,783 | -2,369 | 586 |
| Stocks | 1,556 | 2,779 | -1,223 | -29,007 | -11,176 | -17,831 |
| Mutual funds | 2,171 | 3,203 | -1,031 | -8,444 | -1,653 | -6,791 |
| Debts | -15,877 | -10,968 | -4,910 | -105,990 | -122,514 | 16,525 |
| Gross wealth | 27,129 | 21,292 | 5,837 | -113,586 | -153,823 | 40,236 |
| Net wealth | 43,006 | 32,260 | 10,747 | -7,597 | -31,308 | 23,711 |
| Schooling | Health | |||||
| Own home | 64,900 | 57,997 | 6,903 | 71,591 | 105,627 | -34,035 |
| Other real estate | 40,892 | 21,286 | 19,606 | 150,175 | 124,325 | 25,850 |
| Bank accounts | 1,330 | 561 | 769 | 24,508 | 25,349 | -841 |
| Bonds | -805 | -2,747 | 1,942 | 12,991 | 5,489 | 7,501 |
| Stocks | 3,210 | 3,791 | -581 | -6,888 | -7,140 | 253 |
| Mutual funds | 6,056 | 3,677 | 2,379 | 50,412 | 50,437 | -24 |
| Debts | 91,571 | 35,350 | 56,221 | 4,049 | -41,256 | 45,305 |
| Gross wealth | 152,642 | 108,158 | 44,484 | 474,173 | 188,870 | 285,303 |
| Net wealth | 61,071 | 72,808 | -11,737 | 470,124 | 230,126 | 239,998 |
Table 7
Estimated regression slopes with measurement errors in the independent variable (gross wealth)
| Dep. Var. | * | * | * | /* | ||
|---|---|---|---|---|---|---|
| Own home | 0.277 (0.013) | 0.310 (0.011) | -0.159 | 1.20E+12 | 3.32E+12 | 0,360 |
| Other real estate | 0.521 (0.028) | 0.634 (0.018) | -0.544 | 2.01E+12 | 5.72E+12 | 0,352 |
| Bank accounts | 0.045 (0.003) | 0.047 (0.003) | -0.002 | 9.70E+11 | 2.95E+12 | 0,328 |
| Bonds | 0.000 (0.004) | 0.002 (0.004) | -0.007 | 1.69E+12 | 6.80E+12 | 0,249 |
| Stocks | 0.039 (0.006) | 0.047 (0.006) | -0.028 | 1.76E+12 | 4.70E+12 | 0,376 |
| Mutual funds | 0.057 (0.005) | 0.055 (0.005) | 0.000 | 1.31E+12 | 3.89E+12 | 0,336 |
| Debts | 0.263 (0.012) | 0.272 (0.011) | -0.001 | 1.91E+12 | 6.27E+12 | 0,304 |
| Health | 1,55E-08 (9,15E-09) | 1,68E-08 (1,03E-08) | -1,19E-01 | 1,1E+12 | 2,14E+12 | 0,505 |
-
*
Computed as if there were no errors in register data.
Table 8
Multivariate regressions with errors in one explanatory variable and decomposition of the estimates.
| Dep. Var | |||||||||||||
|---|---|---|---|---|---|---|---|---|---|---|---|---|---|
| A. Explanatory variables are gross wealth (W) and age (X) | |||||||||||||
| Own home | 0.275 (0.013) | -4,727 (2,335) | 0.309 (0.011) | -6,265 (2,129) | 0.360 | 0.310 | -8,821 | -2.29E-07 | -5.08E-07 | -0.224 | -8,274 | -6,608 | -0.159 |
| Other real estate | 0.524 (0.028) | 9,204 (6,906) | 0.635 (0.018) | 6,545 (4,763) | 0.352 | 0.634 | -1,845 | -1.87E-07 | -3.17E-07 | -0.252 | -13,219 | -7,869 | -0.544 |
| Bank accounts | 0.048 (0.003) | 3,033 (559) | 0.048 (0.003) | 2,703 (556) | 0.328 | 0.047 | 2,007 | -5.37E-07 | -8.16E-07 | -0.154 | -14,374 | -7,173 | -0.002 |
| Bonds | 4.7E-04 (0.004) | 946 (1,013) | 2.1E-03 (0.004) | 971 (1,007) | 0.249 | 0.002 | 931 | -2.81E-07 | -7.00E-07 | -0.175 | -19,656 | -12,194 | -0.007 |
| Stocks | 0.041 (0.006) | 3,857 (1,367) | 0.048 (0.006) | 3,398 (1,332) | 0.376 | 0.047 | 2,779 | -2.30E-07 | -6.40E-07 | -0.217 | -12,905 | -13,479 | -0.028 |
| Mutual funds | 0.060 (0.005) | 4,353 (987) | 0.056 (0.005) | 3,814 (990) | 0.336 | 0.055 | 3,203 | -2.74E-07 | -6.29E-07 | -0.188 | -10,888 | -8,387 | 0.000 |
| Debts | 0.268 (0.012) | -13,469 (3,154) | 0.276 (0.011) | -16,554 (2,970) | 0.304 | 0.272 | -11,846 | 2.45E-07 | -5.79E-07 | -0.173 | 17,004 | -10,959 | -0.093 |
| B. Explanatory variables are gross wealth (W) and gender (X, female=1) | |||||||||||||
| Own home | 0.277 (0.013) | 3,397 (44,761) | 0.310 (0.011) | 1,396 (40,964) | 0.360 | 0.310 | -45,449 | -1.14E-08 | -5.27E-09 | -0.224 | -150,951 | -25,189 | -0.159 |
| Other real estate | 0.520 (0.028) | -128,274 (124,484) | 0.633 (0.018) | -126,637 (85,960) | 0.352 | 0.634 | -210,552 | -5.76E-09 | -3.17E-09 | -0.252 | -132,611 | -25,710 | -0.544 |
| Bank accounts | 0.046 (0.003) | 16,355 (11,825) | 0.047 (0.003) | 13,305 (11,761) | 0.328 | 0.047 | 1,685 | -2.08E-08 | -1.94E-08 | -0.154 | -245,958 | -75,333 | -0.002 |
| Bonds | -6.6E-05 (0.004) | -2,407 (20,194) | 1.8E-03 (0.004) | -1,331 (20,176) | 0.249 | 0.002 | -2,369 | -2.14E-08 | 1.56E-09 | -0.175 | -594,537 | 10,801 | -0.007 |
| Stocks | 0.039 (0.006) | 3,417 (25,094) | 0.047 (0.006) | -1,385 (24,489) | 0.376 | 0.047 | -11,176 | -1.11E-08 | -2.36E-08 | -0.217 | -207,620 | -166,465 | -0.028 |
| Mutual funds | 0.058 (0.005) | 11,990 (19,698) | 0.055 (0.005) | 9,434 (19,756) | 0.336 | 0.055 | -1,653 | -1.29E-08 | -6.85E-09 | -0.188 | -200,887 | -35,733 | 0.000 |
| Debts | 0.266 (0.013) | -37,655 (49,847) | 0.272 (0.011) | -80,012 (47,078) | 0.304 | 0.272 | -148,691 | -1.52E-08 | -3.62E-08 | -0.173 | -252,850 | -164,188 | -0.093 |
| C. Explanatory variables are gross wealth (W) and year of schooling (X) | |||||||||||||
| Own home | 0.260 (0.013) | 27,887 (5,737) | 0.297 (0.011) | 29,504 (5,159) | 0.360 | 0.310 | 57,997 | 4.62E-07 | 2.63E-07 | -0.224 | 96,035 | 19,657 | -0.159 |
| Other real estate | 0.539 (0.029) | -43,158 (15,410) | 0.645 (0.018) | -40,365 (10,456) | 0.352 | 0.634 | 21,286 | 2.81E-07 | 2.01E-07 | -0.252 | 95,603 | 24,045 | -0.544 |
| Bank accounts | 0.049 (0.004) | -5,824 (1,538) | 0.049 (0.003) | -4,135 (1,504) | 0.328 | 0.047 | 561 | 5.16E-07 | 5.60E-07 | -0.154 | 95,628 | 34,094 | -0.002 |
| Bonds | 0.002 (0.004) | -3,073 (2,584) | 0.003 (0.004) | -3,115 (2,493) | 0.249 | 0.002 | -2,747 | 3.20E-07 | 6.48E-07 | -0.175 | 132,626 | 66,831 | -0.007 |
| Stocks | 0.040 (0.006) | -1,698 (3,200) | 0.048 (0.006) | -1,112 (3,077) | 0.376 | 0.047 | 3,791 | 3.60E-07 | 3.24E-07 | -0.217 | 103,054 | 34,823 | -0.028 |
| Mutual funds | 0.059 (0.005) | -3,609 (2,474) | 0.056 (0.005) | -1,431 (2,444) | 0.336 | 0.055 | 3,677 | 4.00E-07 | 3.98E-07 | -0.188 | 91,814 | 30,697 | 0.000 |
| Debts | 0.268 (0.013) | -1,819 (6,867) | 0.271 (0.012) | 3,953 (6,444) | 0.304 | 0.272 | 33,058 | 3.58E-07 | 2.79E-07 | -0.173 | 107,231 | 22,858 | -0.093 |
-
Note: In computing these statistics u was defined as .
Data and code availability
Please contact the authors for information on data and code availability.
Download links
A two-part list of links to download the article, or parts of the article, in various formats.