Microsimulation for Public Policy. Experiences from the Swedish Model SESIM
- Department of Economics, Sweden
Cite this article
as: A. Klevmarken; 2022; Microsimulation for Public Policy. Experiences from the Swedish Model SESIM; International Journal of Microsimulation; 15(1); 153-185.
doi: 10.34196/ijm.00258
Figures
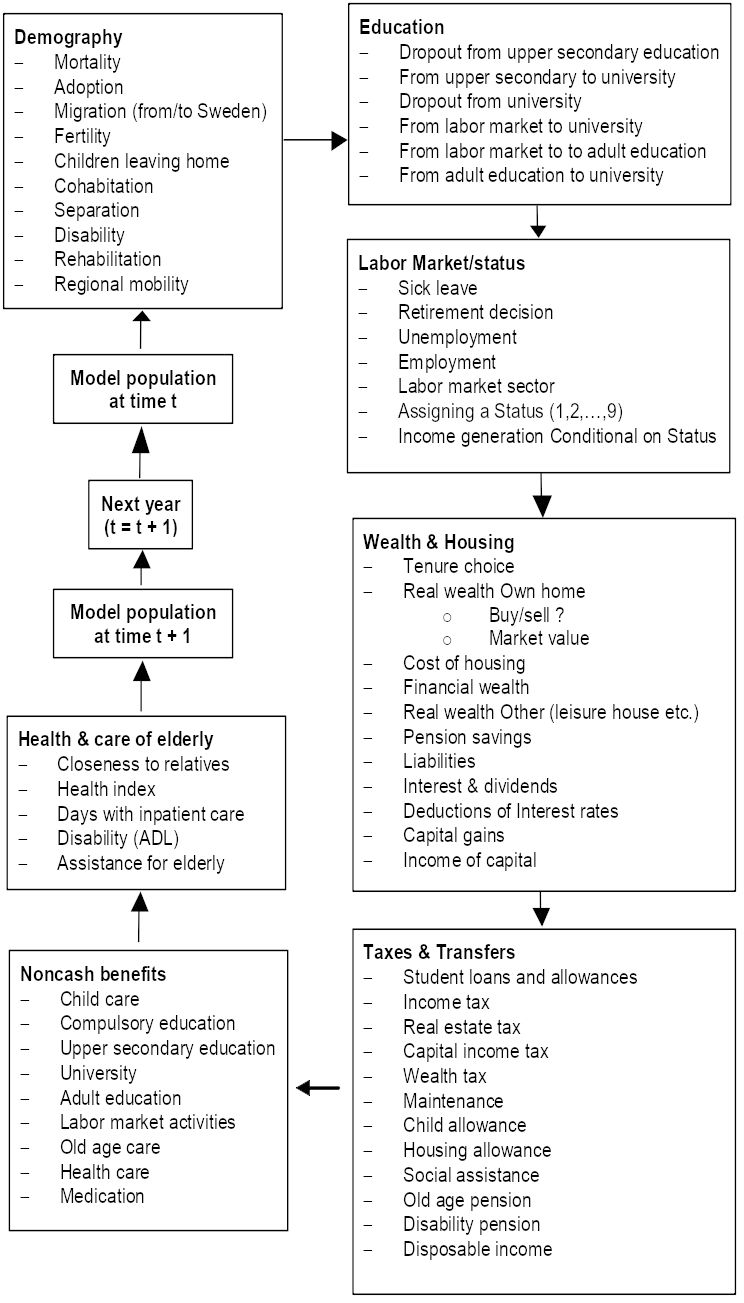
Figure 1

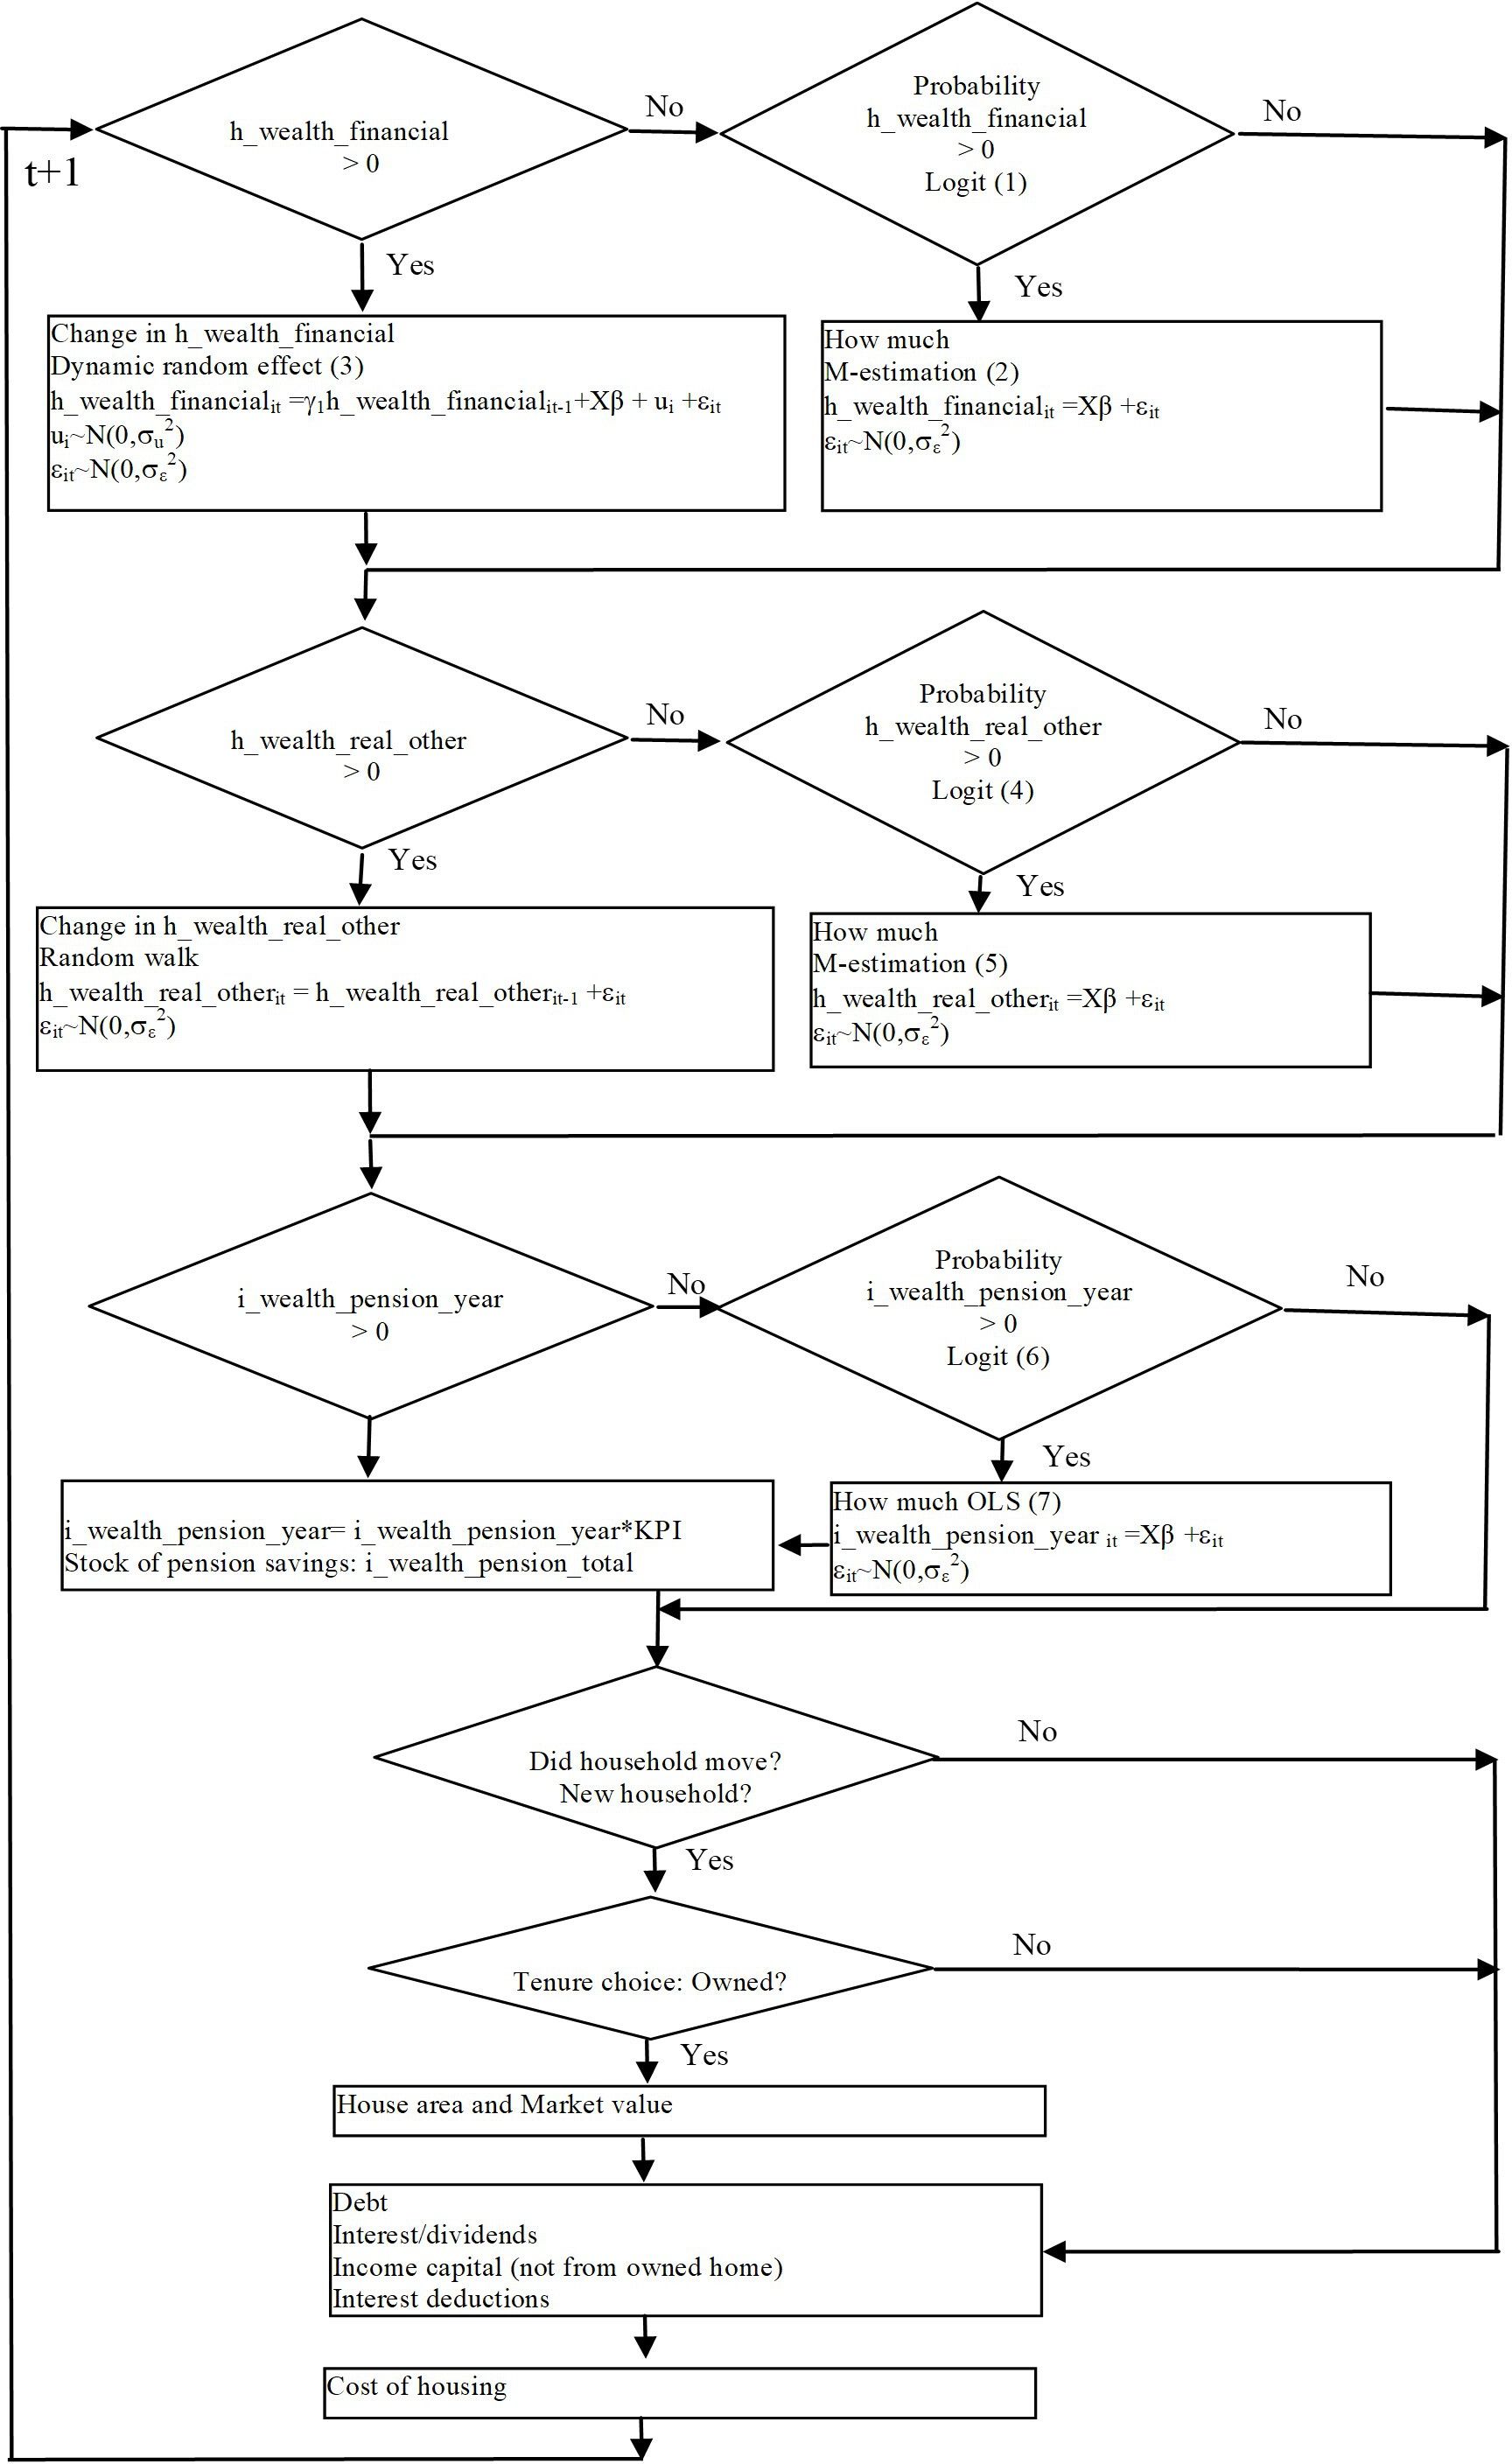
Structure of SESIM (Source Flood (2008a)). Note: The module “Noncash benfits” was not used in the project on population ageing, it was instead replaced by the module “Health and care of elderly”.
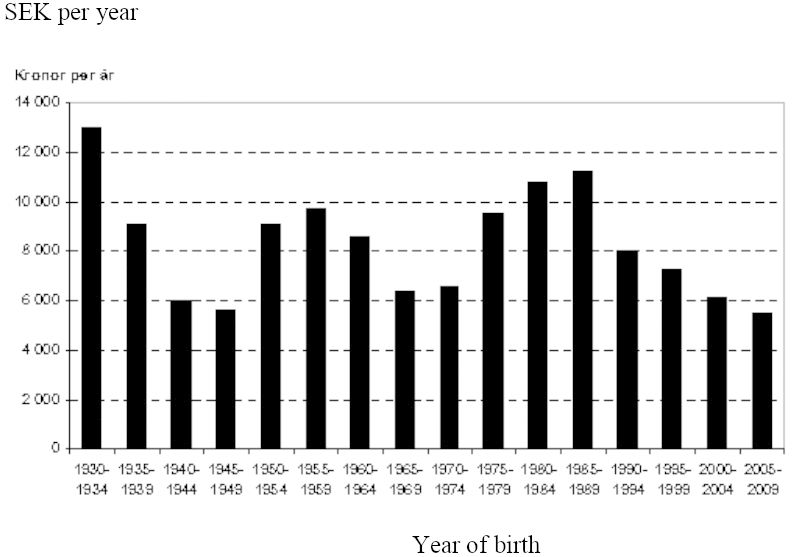
Figure 2

Public sector balances for people born in 1930-2009. (SEK, average per year of survival in Sweden adjusted for price changes and real growth.)
Figure 3
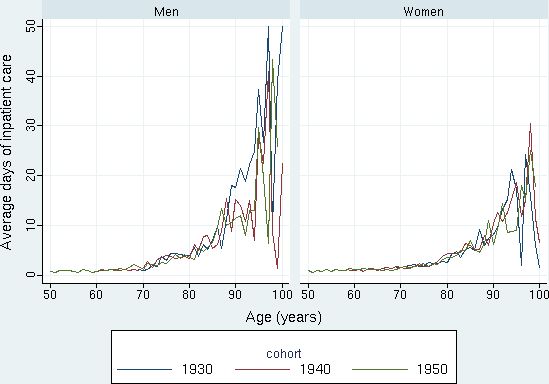
Simulated average days of inpatient care by age 50-100 for the birth cohorts of 1930, 1940, and 1950. Men and women, respectively. Source: Figure 10.2 in Bolin et al. (2008c).
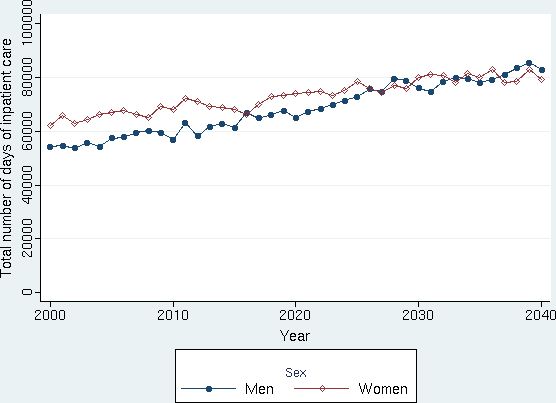
Figure 4

Simulated development of total number of days of inpatient care for the total Swedish population, by gender. Source: Figure 10.7 in Bolin et al. (2008c).
Figure 5

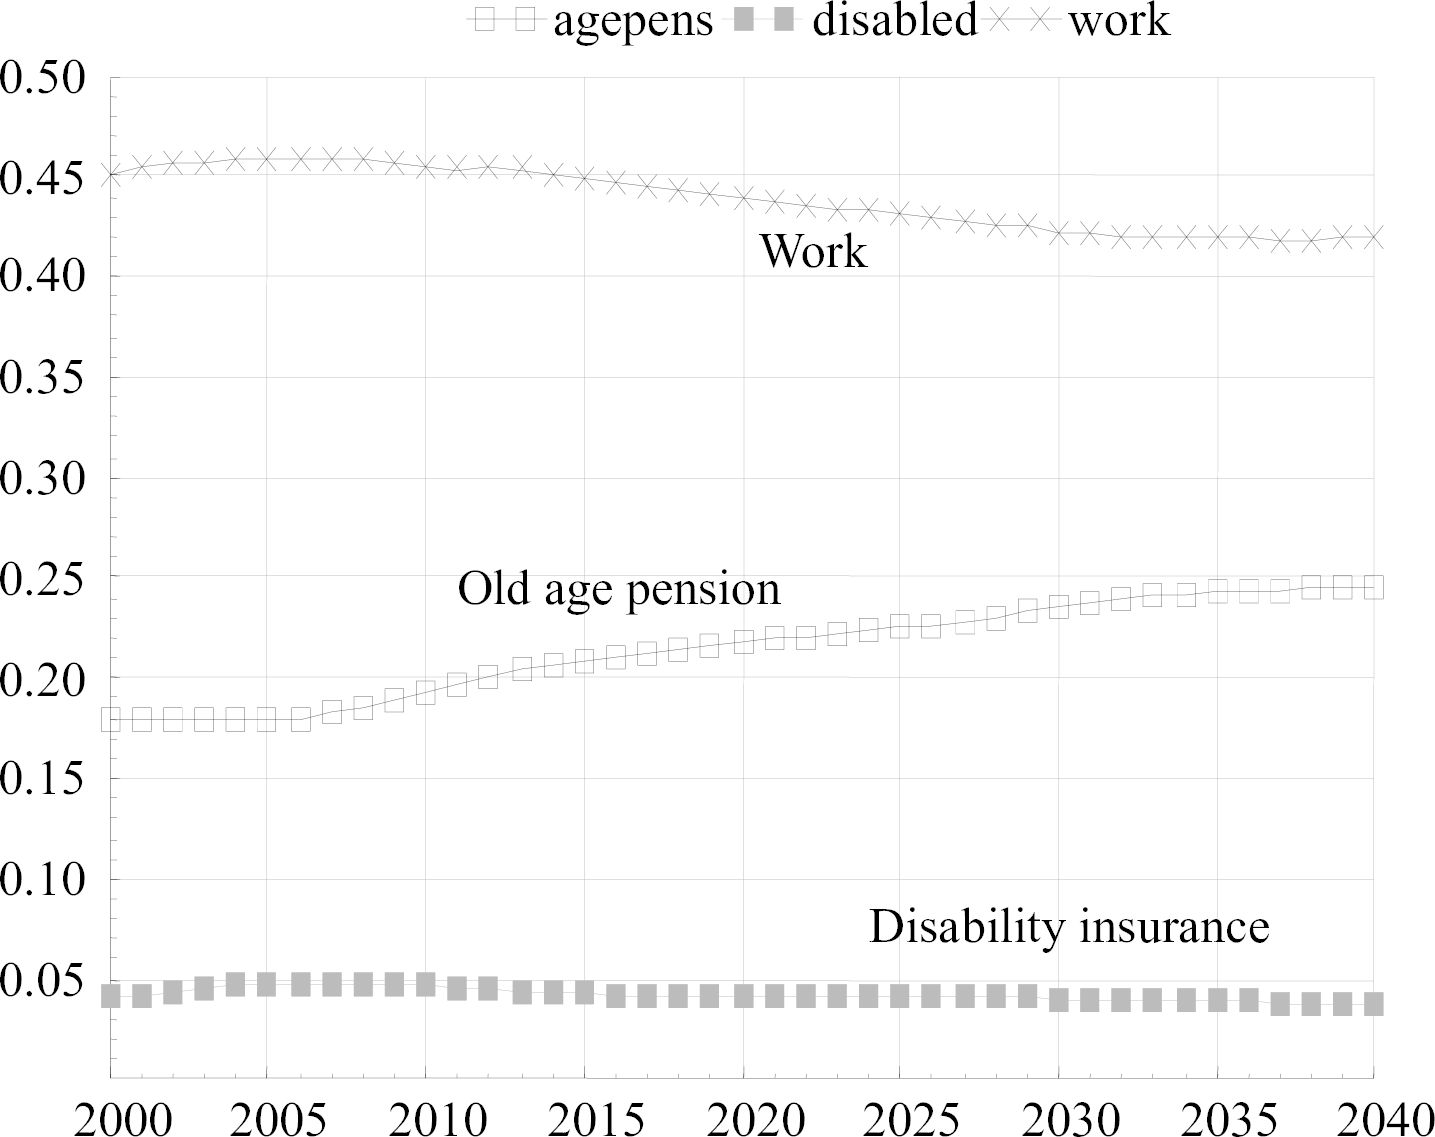
Simulated population shares in work, retirement and disability; all age groups. Source: Figure 5 in Bolin et al. (2008b).
Figure 6

Average transition age to old-age retirement by gender using two alternative scenarios. Source: Figure 10 in Bolin et al. (2008b)
Figure 7

Financial and real wealth and cost of housing in SESIM. Source: Figure 1 in Flood and Klevmarken (2008).
Figure 8

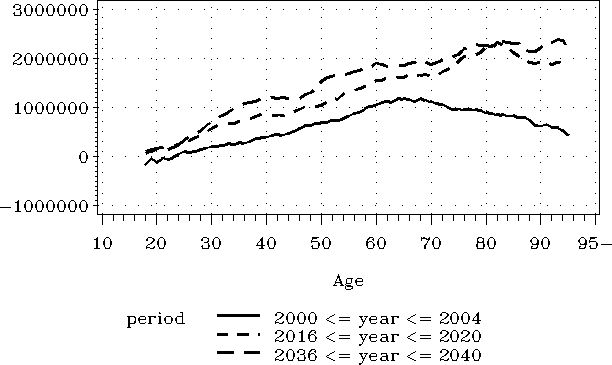
Mean net wealth by period and age of the oldest in the household (SEK in 1999 prices). Source: Figure 3 in Flood and Klevmarken (2008).
Figure 9

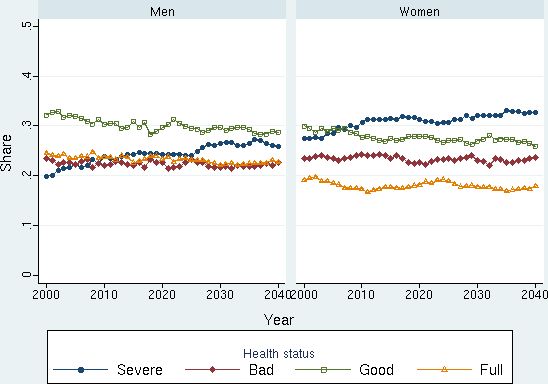
Simulated health status 2000-2040 for people aged 75+. (Population shares by health status and year.). Source: Figure 13 in Bolin et al. (2008a).
Figure 10

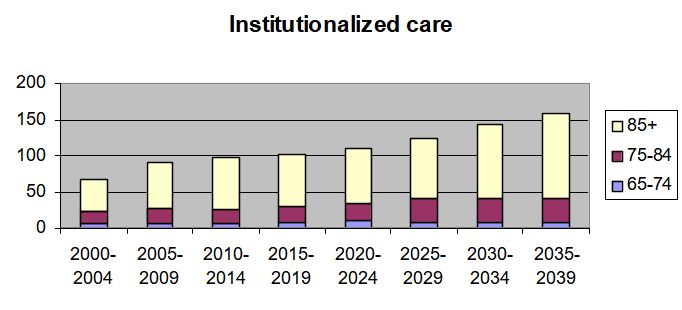
Total number of elderly with around-the-clock care 2000-2039 (1000s). Source: Figure 6 in Fransson et al. (2008).
Figure 11

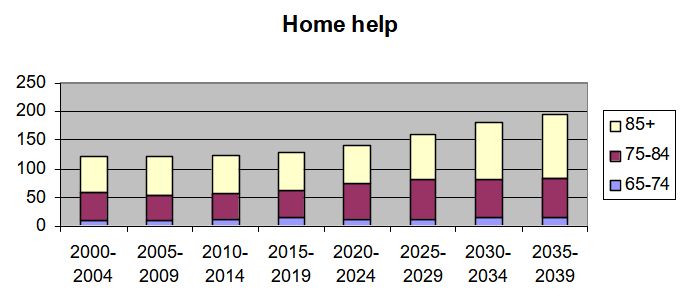
Total number of elderly with home help 2000-2039 (1000s). Source: Figure 6 in Fransson et al. (2008).
Figure 12

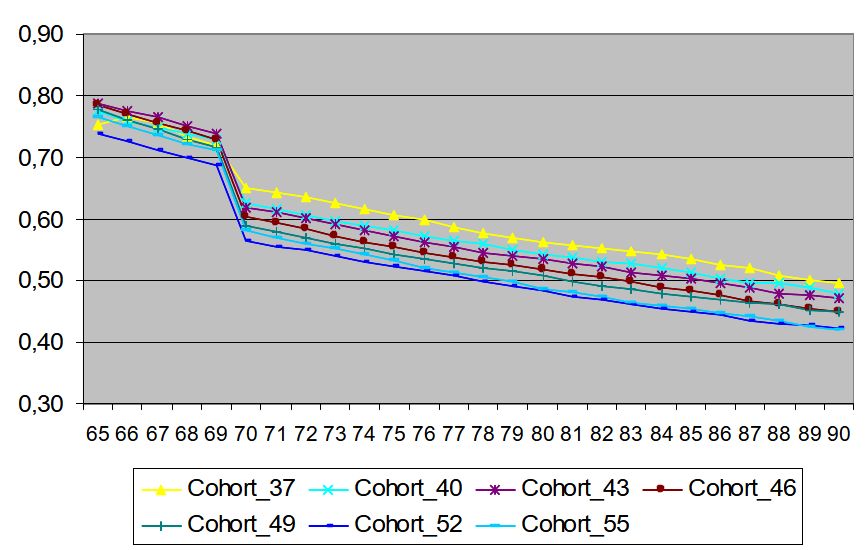
Average taxable income for retired relative to the average taxable income of working cohorts aged 20-64, by birth cohort and calendar year. Source: Figure 11 in Flood et al. (2008).
Figure 13

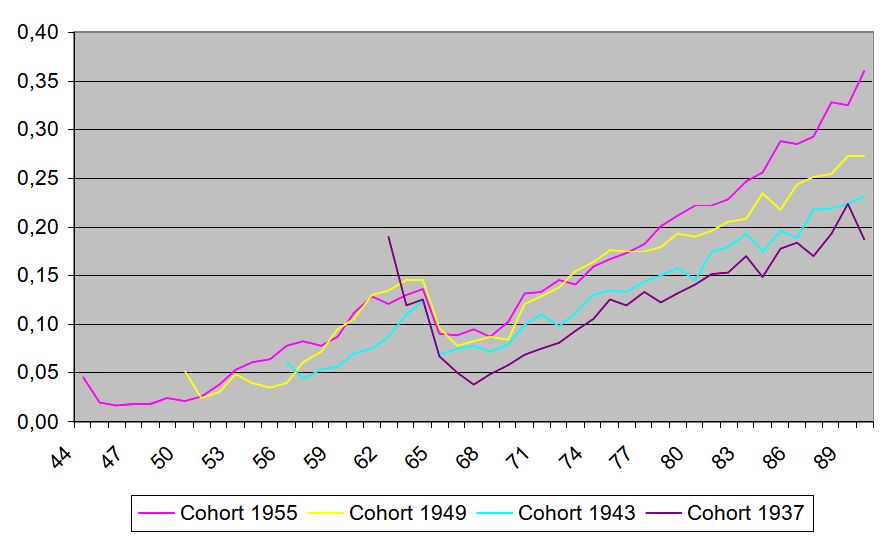
Poverty share by birth cohort and age (equivalized disposable income less than 50 % of the median income of the adult population). Source: Figure 14 in Flood et al. (2008).
Figure 14

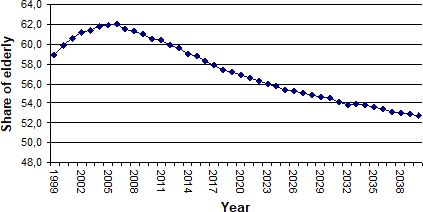
Share of elderly living close to adult children. Source: Figure 2 in Fransson et al. (2008).
Tables
Table 1
Life-cycle incomes and return to higher education.
| Non university program | Short university program | Long university program | ||||
|---|---|---|---|---|---|---|
| Males | Females | Males | Females | Males | Females | |
| Life-cycle income (1000 SEK) | 6974 | 5120 | 7727 | 5911 | 8861 | 6752 |
| Total return to education (1000 SEK) | 0 | 0 | 753 | 790 | 887 | 631 |
| Rate of return to education per year % | 6.0 | 8.7 | 4.9 | 6.3 | ||
-
Source: Table 5.2, Ericson and Hussénius, 2000.
Table 2
Share of students with loans who get their loans remitted at the age of 65 by gender and length of schooling.
| Interest rate (%) | |||
|---|---|---|---|
| 0 | 1.3 | 2.8 | |
| Males | 7.6 | 21.7 | 38.2 |
| Females | 26.1 | 41.4 | 53.2 |
| Less than university | 5.0 | 7.4 | 13.2 |
| Short university | 4.4 | 11.1 | 17.7 |
| Long university | 23.3 | 41.8 | 58.8 |
-
Source: Tables 5.7 and 5.8 in Ericson and Hussénius, 2000.
Table 3
Gini coefficients by income concepts.
| Annual income | Life-cycle income | |
|---|---|---|
| Market income | 0.490 | 0.196 |
| Equivalent disposable income | 0.217 | 0.102 |
| - Indirect taxes | 0.224 | 0.104 |
| + Non-cash benefits | 0.189 | 0.086 |
-
Source: Table 1, Pettersson and Pettersson (2007).
Table 4
Gains and losses through the public sector by gender and income quintile (1000 SEK in 2003 price level).
| Men | Women | Quintiles of Life-cycle income | All | |||||
|---|---|---|---|---|---|---|---|---|
| Q1 | Q2 | Q3 | Q4 | Q5 | ||||
| Taxes | 7136 | 6389 | 4264 | 5741 | 6597 | 7691 | 9483 | 6758 |
| Transfers | 3562 | 4085 | 3924 | 3983 | 3915 | 3770 | 3543 | 3827 |
| Non-cash benefits | 2611 | 3245 | 2840 | 3109 | 3109 | 2922 | 2679 | 2932 |
| Net effect | -963 | 941 | 2500 | 1351 | 428 | -999 | -3262 | 0 |
-
Source: Tables 4 and 5, Pettersson and Pettersson (2007).
Table 5
Average and total number of inpatient hospital days for people 65+ by year.
| Year | Average no of days | Total no of days (1000) | ||||
|---|---|---|---|---|---|---|
| Base scenario | Improved health | Improved health & lower death risks | Base scenario | Improved health | Improved health & lower death risks | |
| 2000 | 3.2 | 3.3 | 3.2 | 4954 | 5068 | 4990 |
| 2020 | 3.2 | 3.1 | 3.5 | 6495 | 6270 | 8117 |
| 2040 | 3.4 | 2.9 | 4.0 | 8396 | 7241 | 12087 |
-
Source: Table 3 in Klevmarken (2008b).
Table 6
Total expenditures for inpatient care, home help and institutionalized care for people 65+.
| Year | Total expenditures (millions of SEK in fixed prices) | Total expenditure as share of the sum of direct taxes from households (%) |
|---|---|---|
| 2000 | 92231 | 20.5 |
| 2020 | 166719 | 24.9 |
| 2040 | 339297 | 36.2 |
-
Source: Table 6 in Klevmarken (2008b).
Table 7
Median equivalized disposable income of 65+ relative to the median income of 20-64, by year in two scenarios.
| Year | Base scenario | High pension age |
|---|---|---|
| 2000 | 0.709 | 0.711 |
| 2020 | 0.634 | 0.693 |
| 2040 | 0.552 | 0.623 |
-
Source: Table 13 in Klevmarken (2008b).
Table 8
What income do those in most need of social care have? (Per cent of all 65+ in each form of care.).
| Year/Kind of care | Quartiles of the distribution of disposable income for all adults | ||||
|---|---|---|---|---|---|
| 1 | 2 | 3 | 4 | All | |
| 2000 | |||||
| No care | 46.7 | 30.8 | 14.1 | 8.4 | 100 |
| Home help | 68.6 | 18.7 | 7.1 | 5.6 | 100 |
| Institutionalized | 65.5 | 22.2 | 8.0 | 4.3 | 100 |
| 2040 | |||||
| No care | 53.1 | 30.7 | 10.9 | 5.3 | 100 |
| Home help | 75.4 | 17.6 | 3.8 | 3.2 | 100 |
| Institutionalized | 76.4 | 14.7 | 4.6 | 4.2 | 100 |
-
Source: Table 17 in Klevmarken (2008b).
Table 9
How much wealth do those in most need of care have? (Per cent of all 65+ in each form of care).
| Year/kind of care | Quartiles of the distribution of net worth for all adults | ||||
|---|---|---|---|---|---|
| 1 | 2 | 3 | 4 | All | |
| 2000 | |||||
| No care | 4.7 | 28.0 | 27.4 | 39.9 | 100 |
| Home help | 2.5 | 40.2 | 27.4 | 29.8 | 100 |
| Institutionalized | 2.0 | 39.9 | 25.8 | 32.3 | 100 |
| 2040 | |||||
| No care | 12.0 | 17.4 | 20.8 | 49.9 | 100 |
| Home help | 12.4 | 20.1 | 18.2 | 49.3 | 100 |
| Institutionalized | 11.1 | 21.6 | 19.9 | 47.4 | 100 |
-
Source: Table 18 in Klevmarken (2008b).
Table 10
Poverty rates among people aged 65+, by type of assistance, year and scenario (%).
| Scenario/year | Type of assistance | |||
|---|---|---|---|---|
| No assistance | Help at home | All day Surveillance | All 65+ | |
| Base scenario | ||||
| 2000 | 1.5 | 1.4 | 2.5 | 1.6 |
| 2020 | 11.1 | 10.8 | 13.2 | 11.2 |
| 2040 | 14.3 | 15.1 | 16.3 | 14.5 |
| Increased pension age | ||||
| 2000 | 1.7 | 2.6 | 2.2 | 1.8 |
| 2020 | 6.8 | 7.2 | 10.1 | 7.0 |
| 2040 | 7.9 | 9.8 | 12.0 | 8.3 |
-
Source: Table 20 in Klevmarken (2008b).
Data and code availability
Please contact the authors for information on data and code availability.
Download links
A two-part list of links to download the article, or parts of the article, in various formats.