Combining Microsimulation and Numerical Maximization to Identify Optimal Tax-Transfer Rules
- Department of Economics and Statistics "Cognetti De Martiis", Italy
- Living Conditions, Luxembourg
Cite this article
as: U. Colombino, N. Islam; 2022; Combining Microsimulation and Numerical Maximization to Identify Optimal Tax-Transfer Rules; International Journal of Microsimulation; 15(2); 4-43.
doi: 10.34196/ijm.00261
Figures
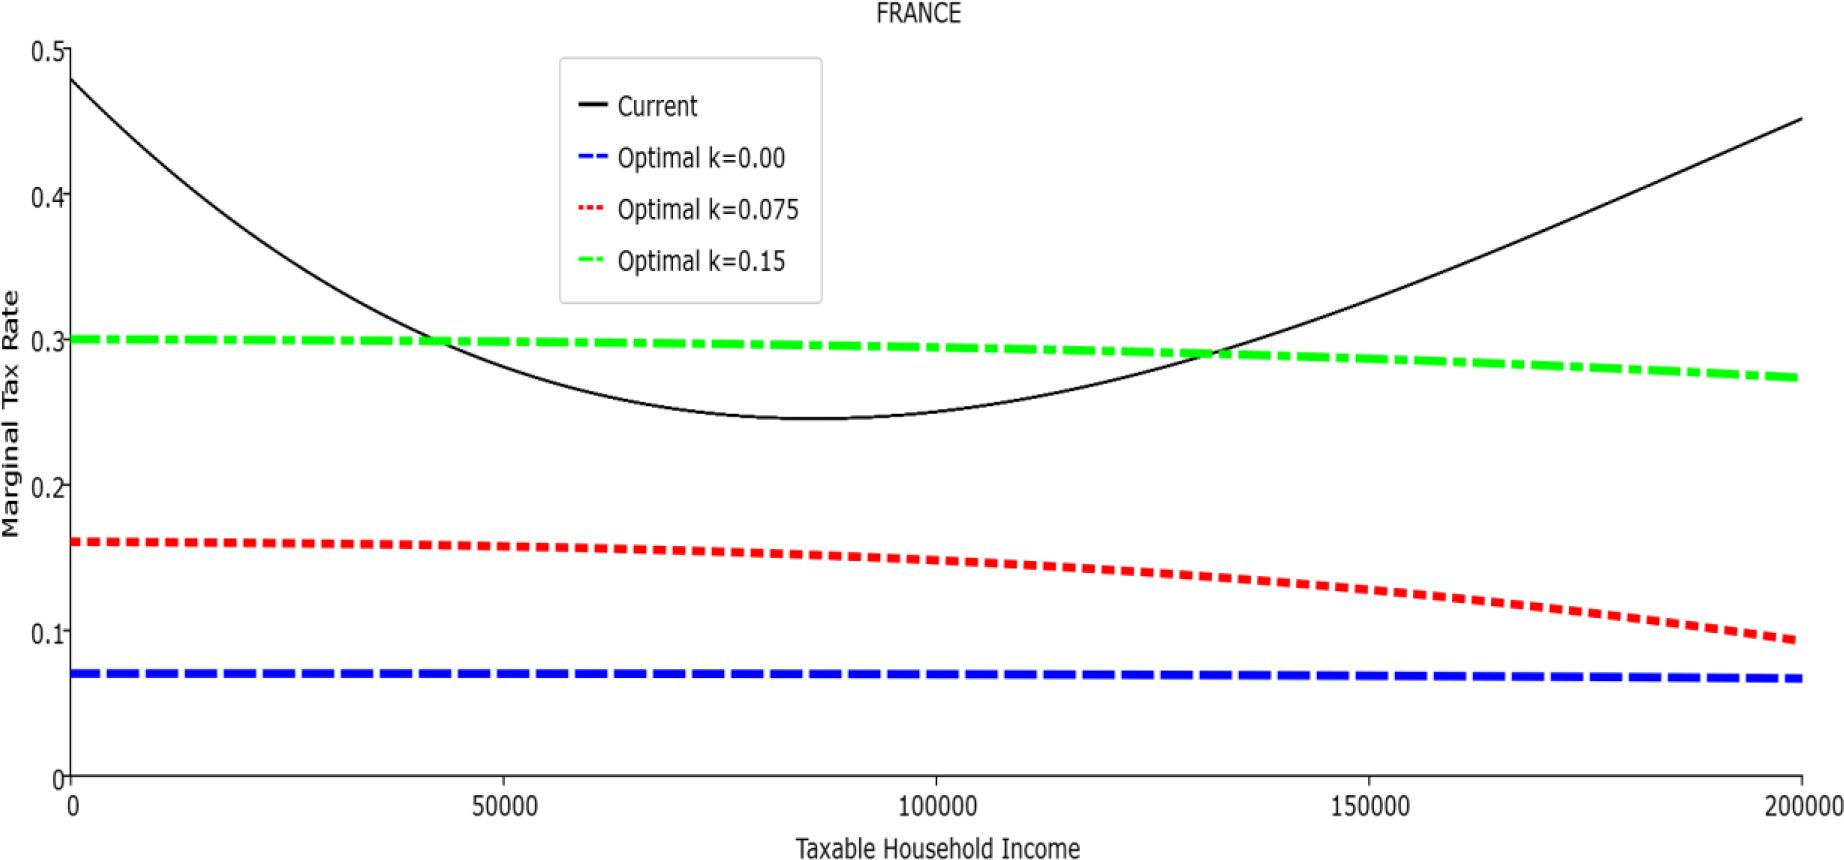
Figure 1
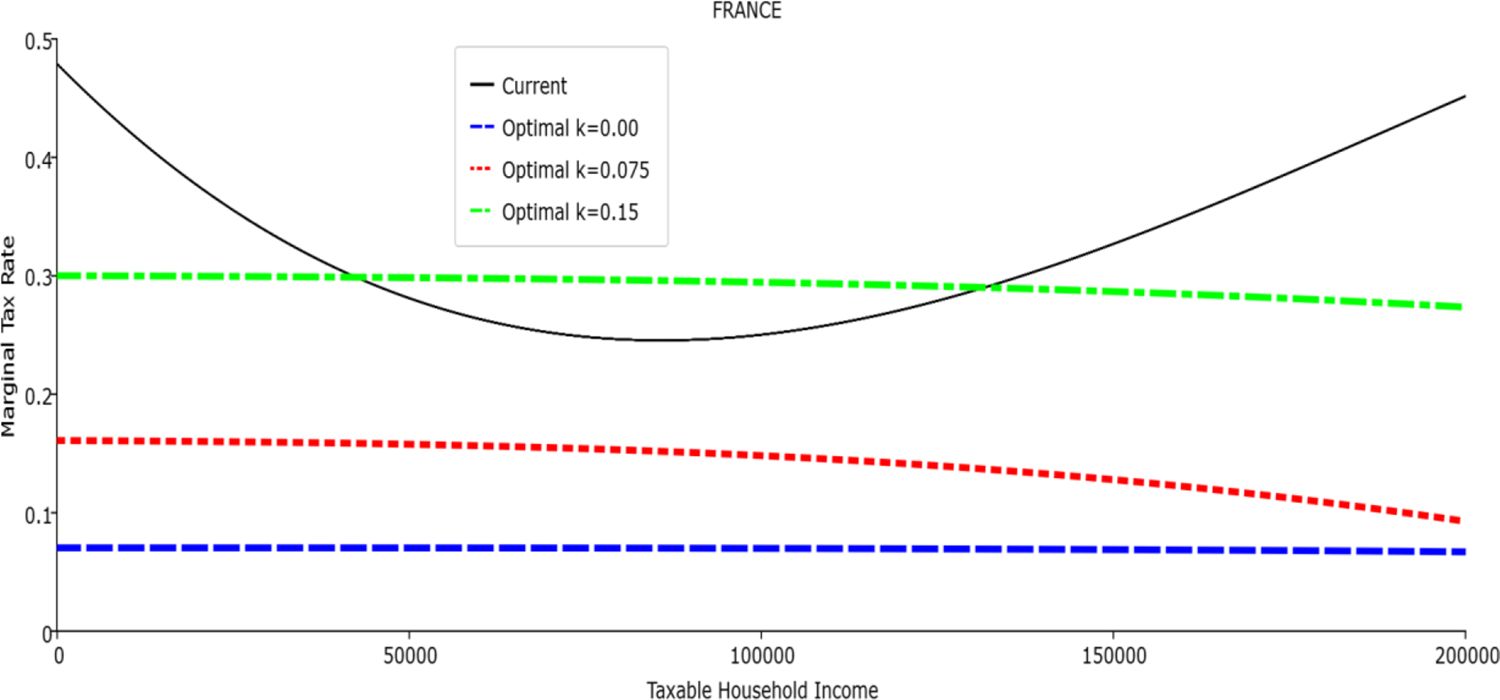
Marginal Tax Rate vs. Taxable Income. France
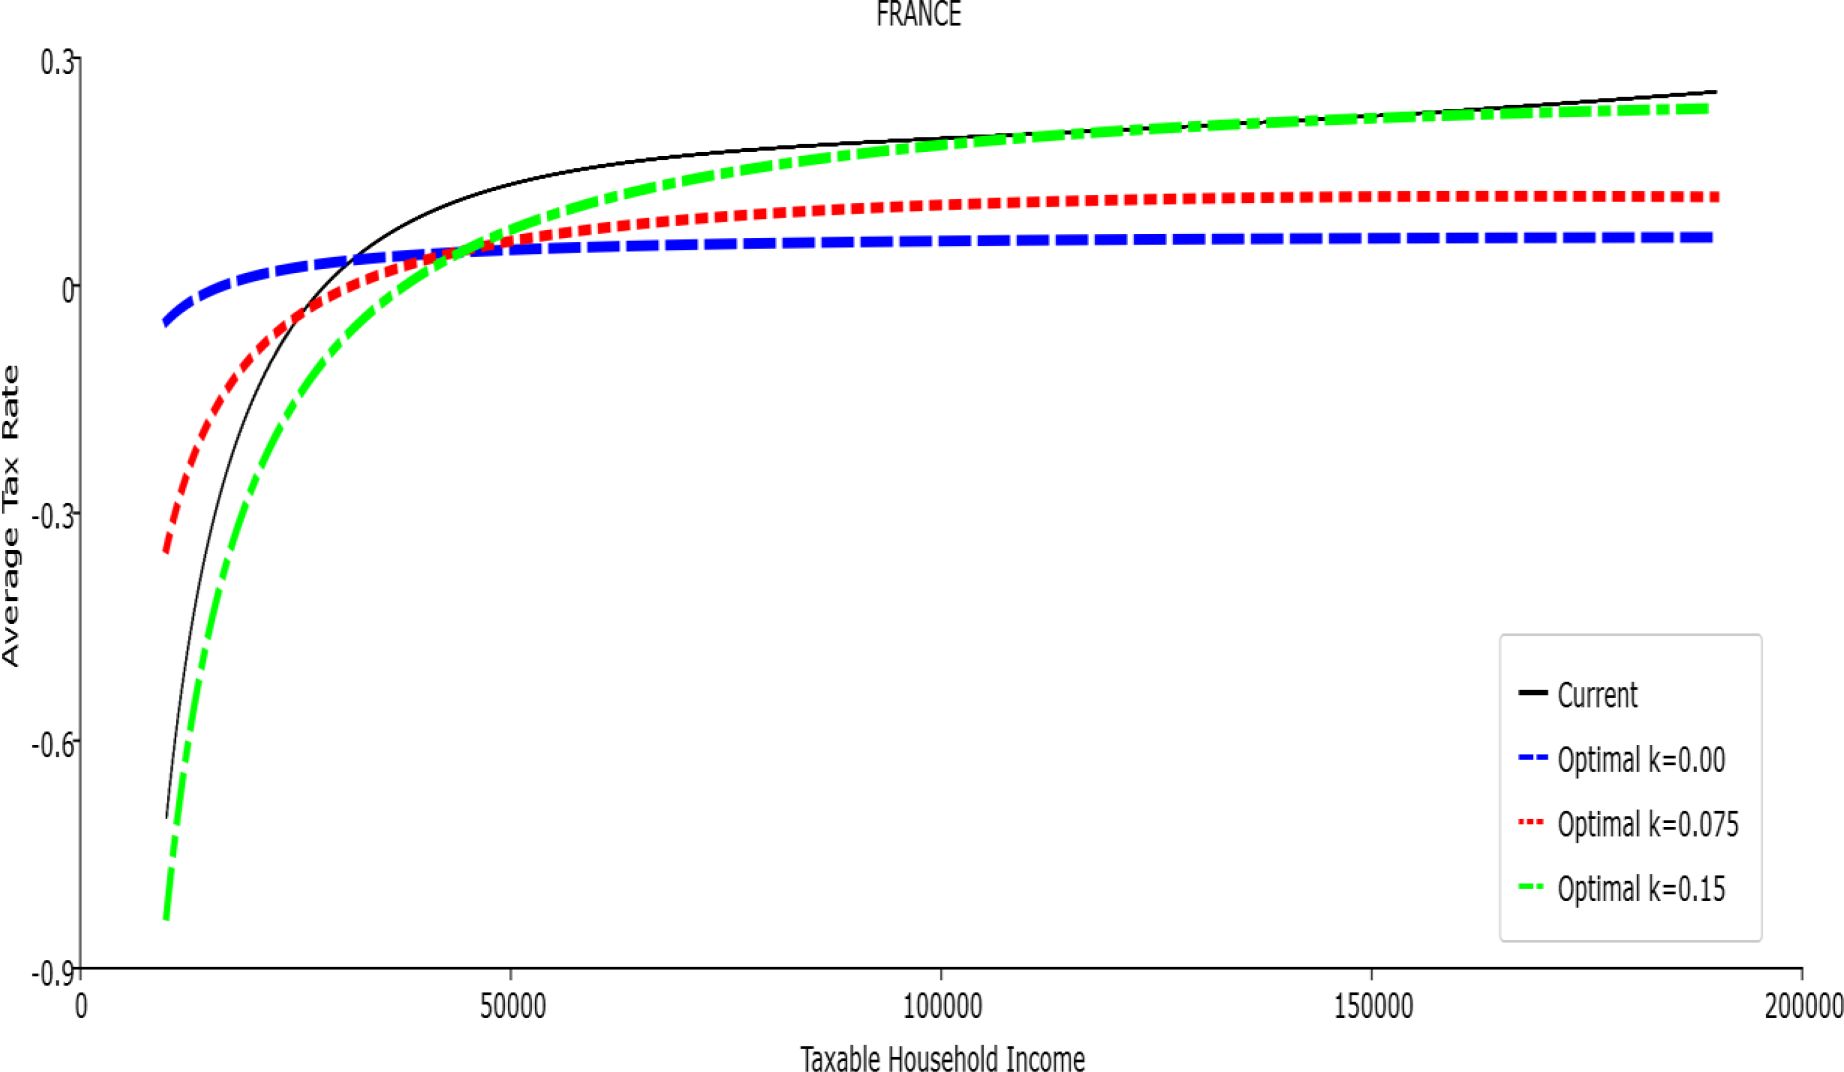
Figure 2

Average Tax Rate vs. Taxable Income. France
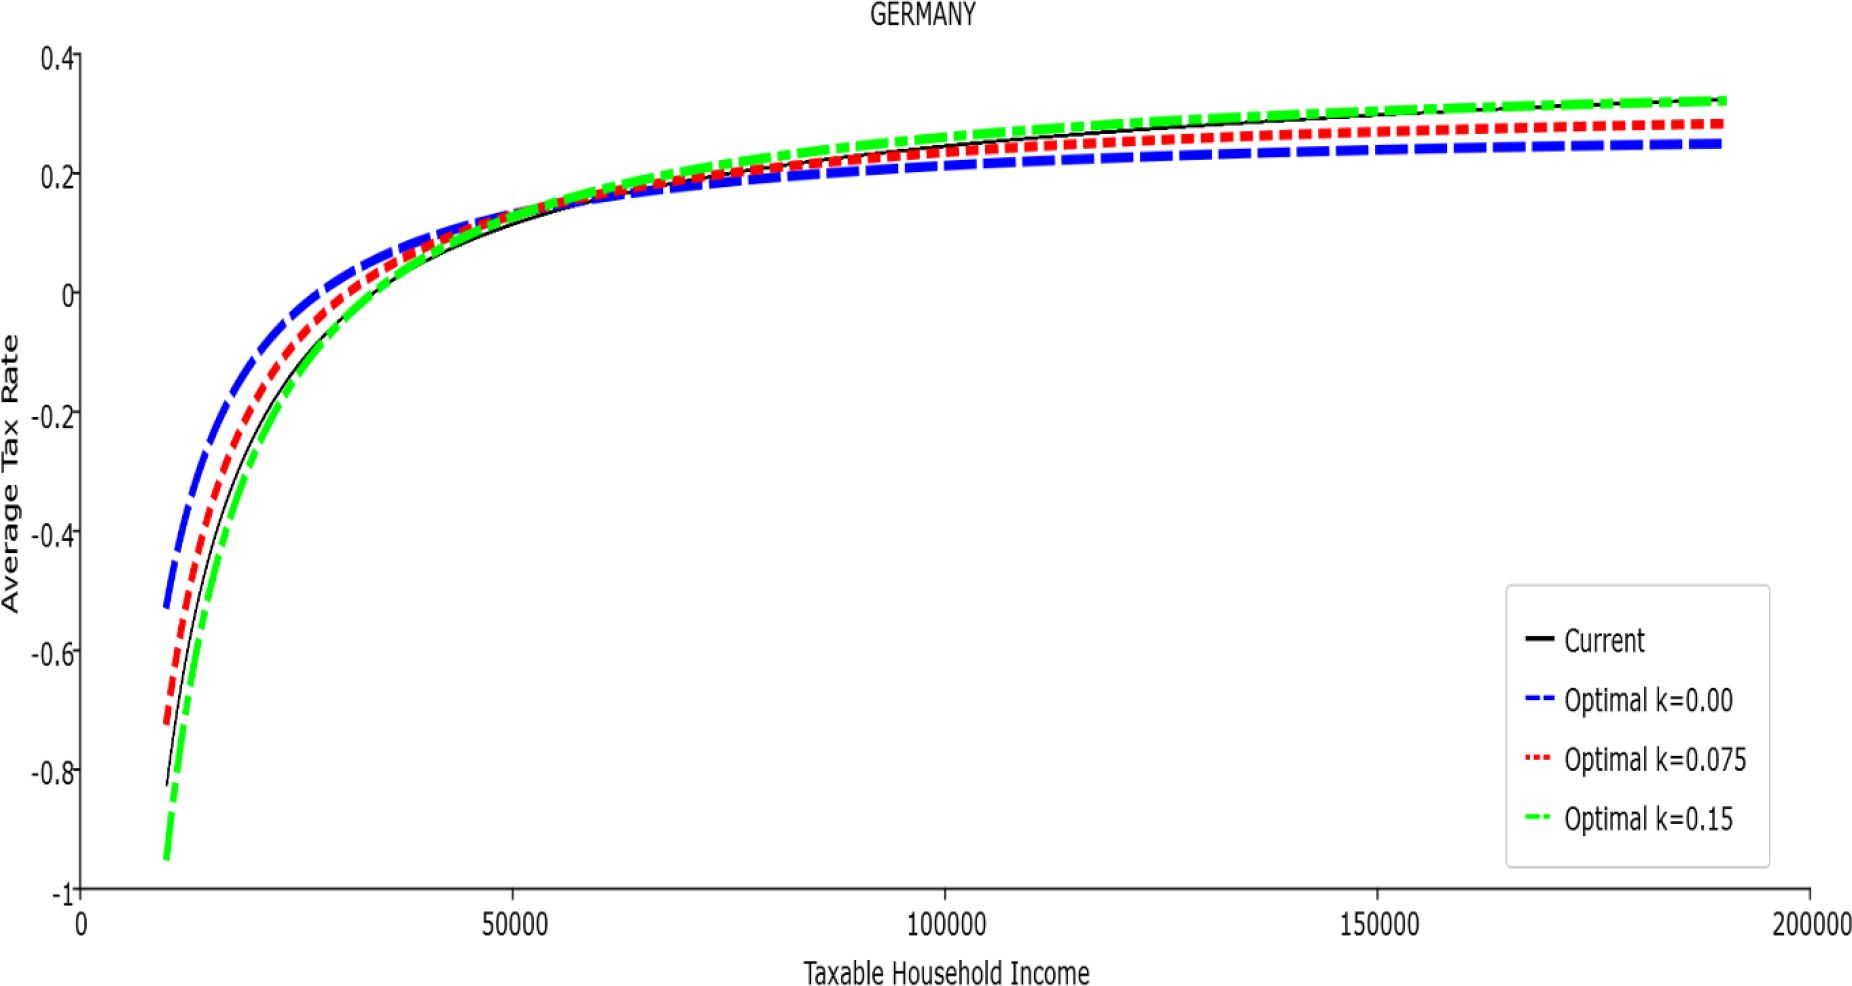
Figure 3

Marginal Tax Rate vs. Taxable Income. Germany
Figure 4

Average Tax Rate vs. Taxable Income. Germany
Figure 5
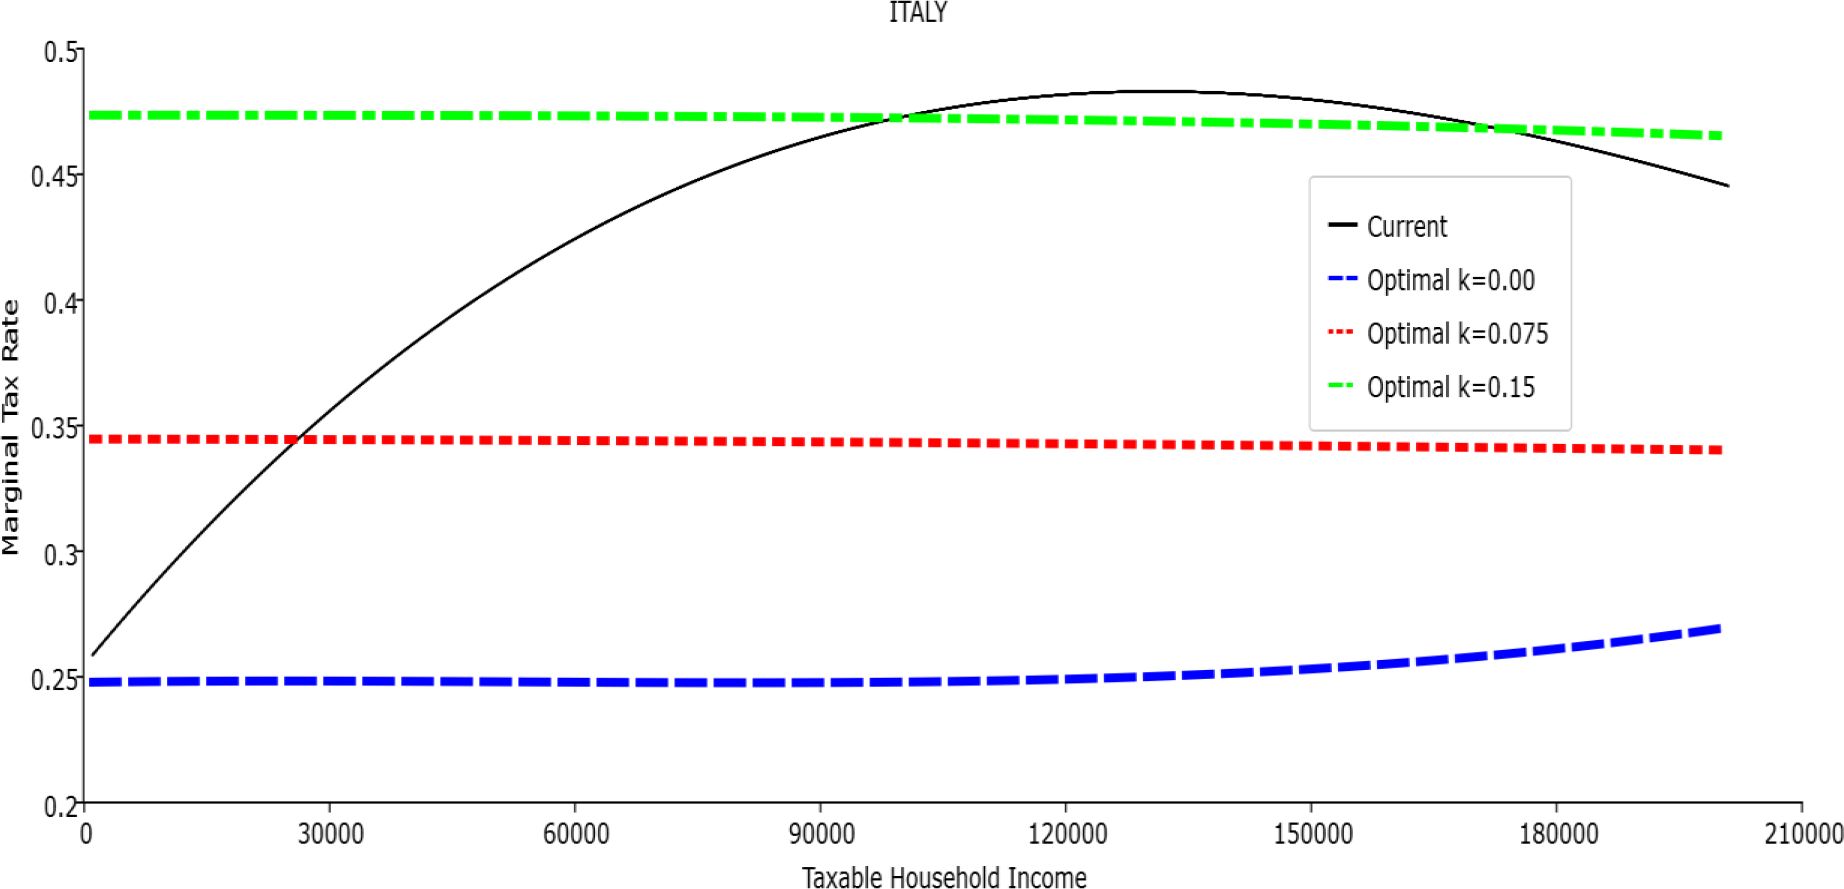
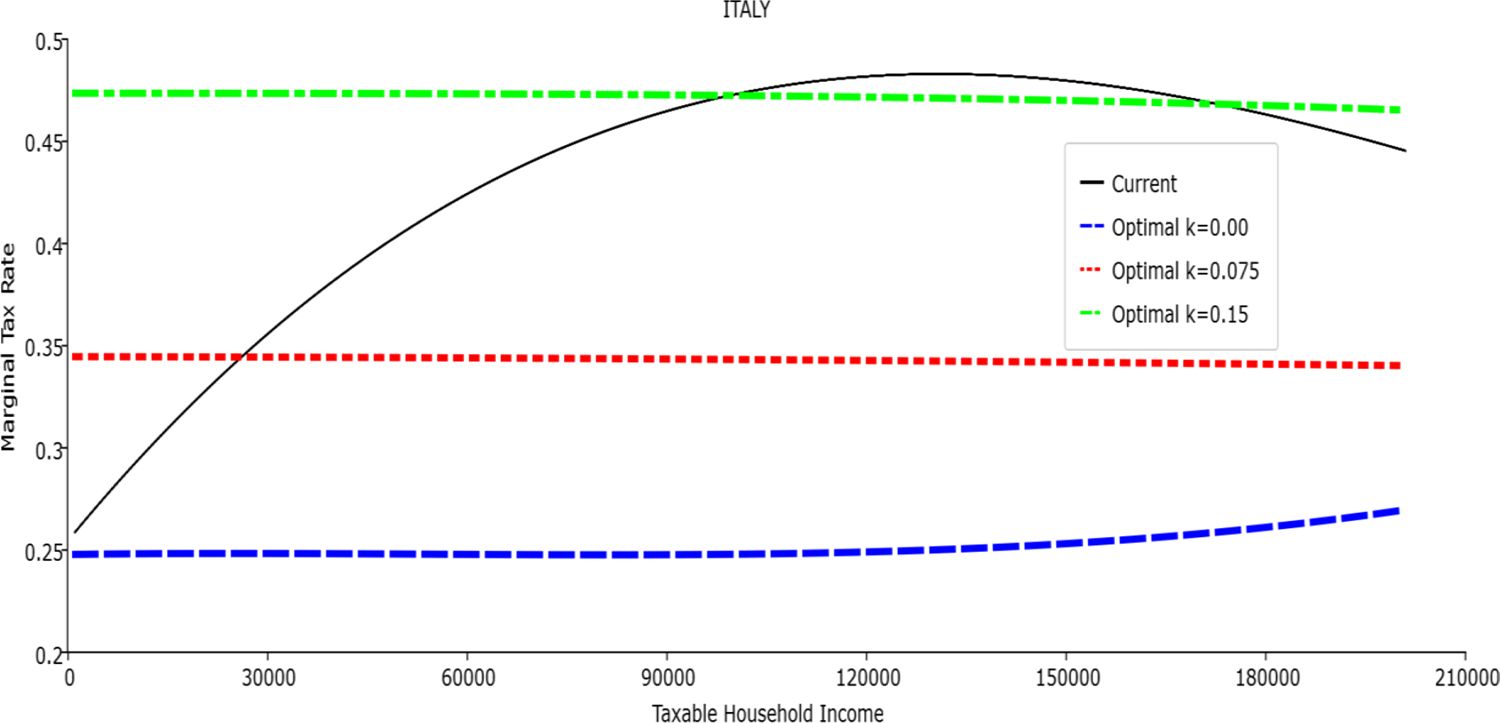
Marginal Tax Rate vs. Taxable Income. Italy
Figure 6

Average Tax Rate vs. Taxable Income. Italy
Figure 7
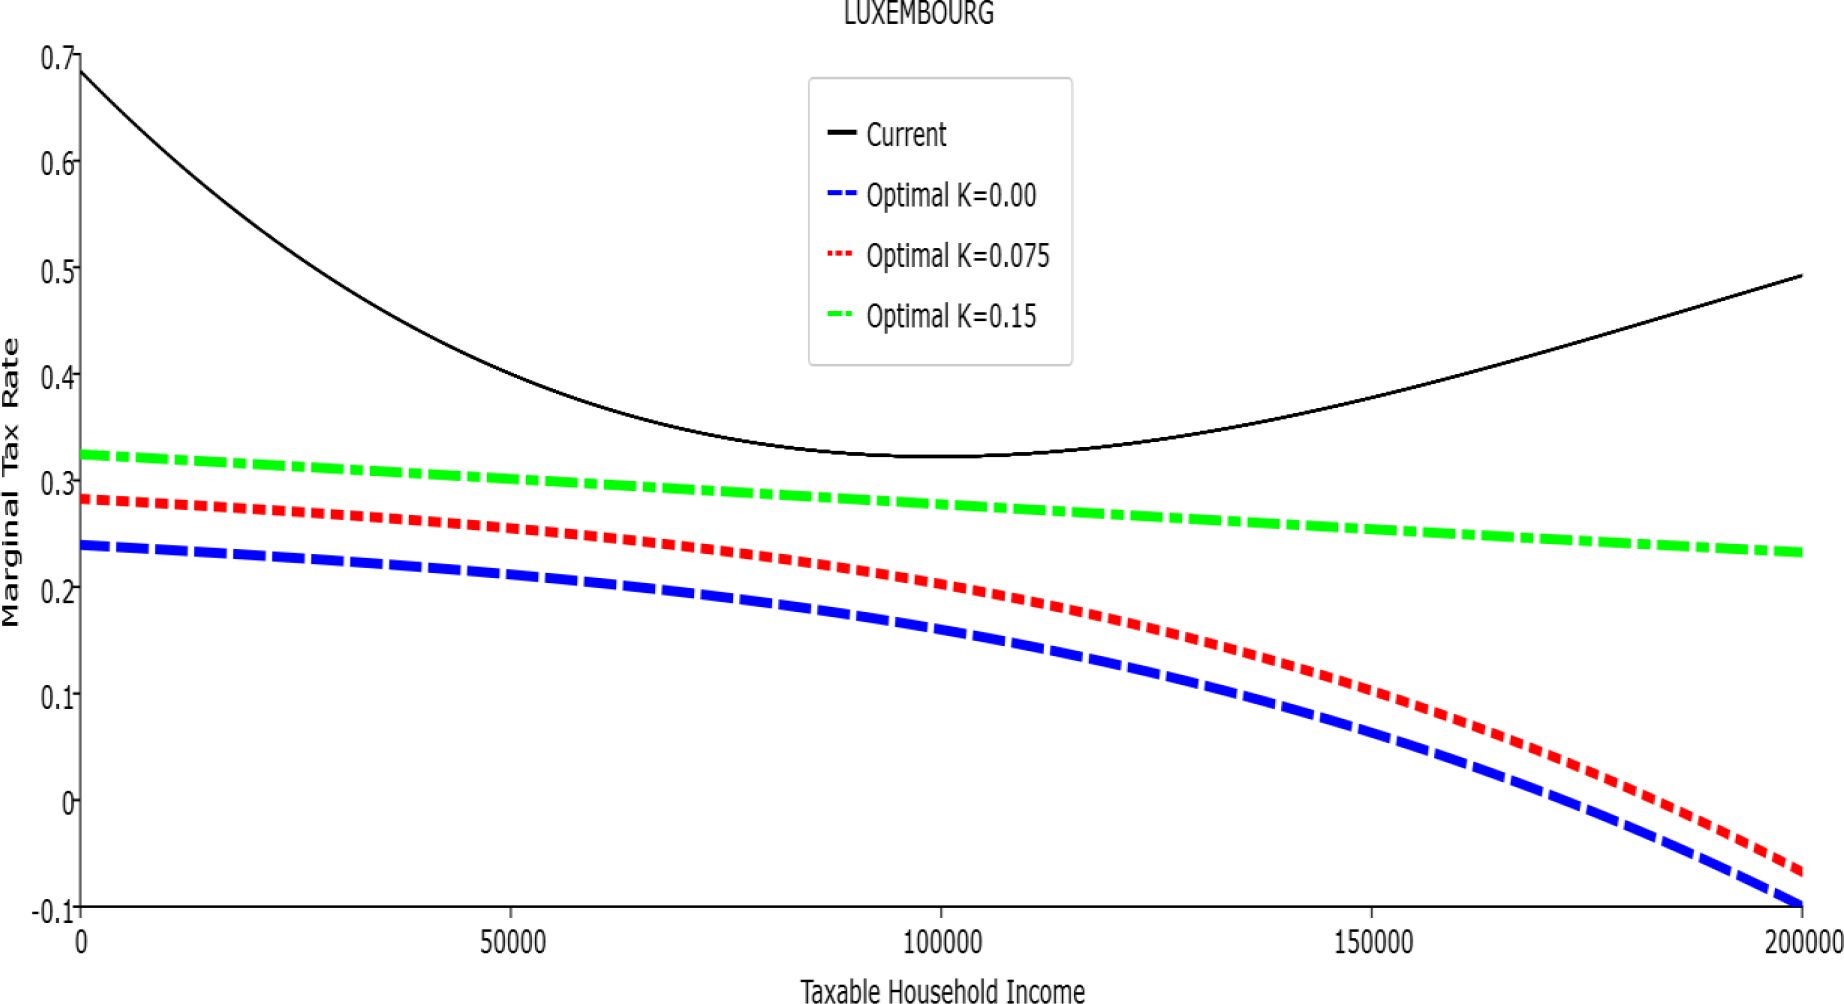

Marginal Tax Rate vs. Taxable Income. Luxembourg
Figure 8

Average Tax Rate vs. Taxable Income. Luxembourg
Figure 9
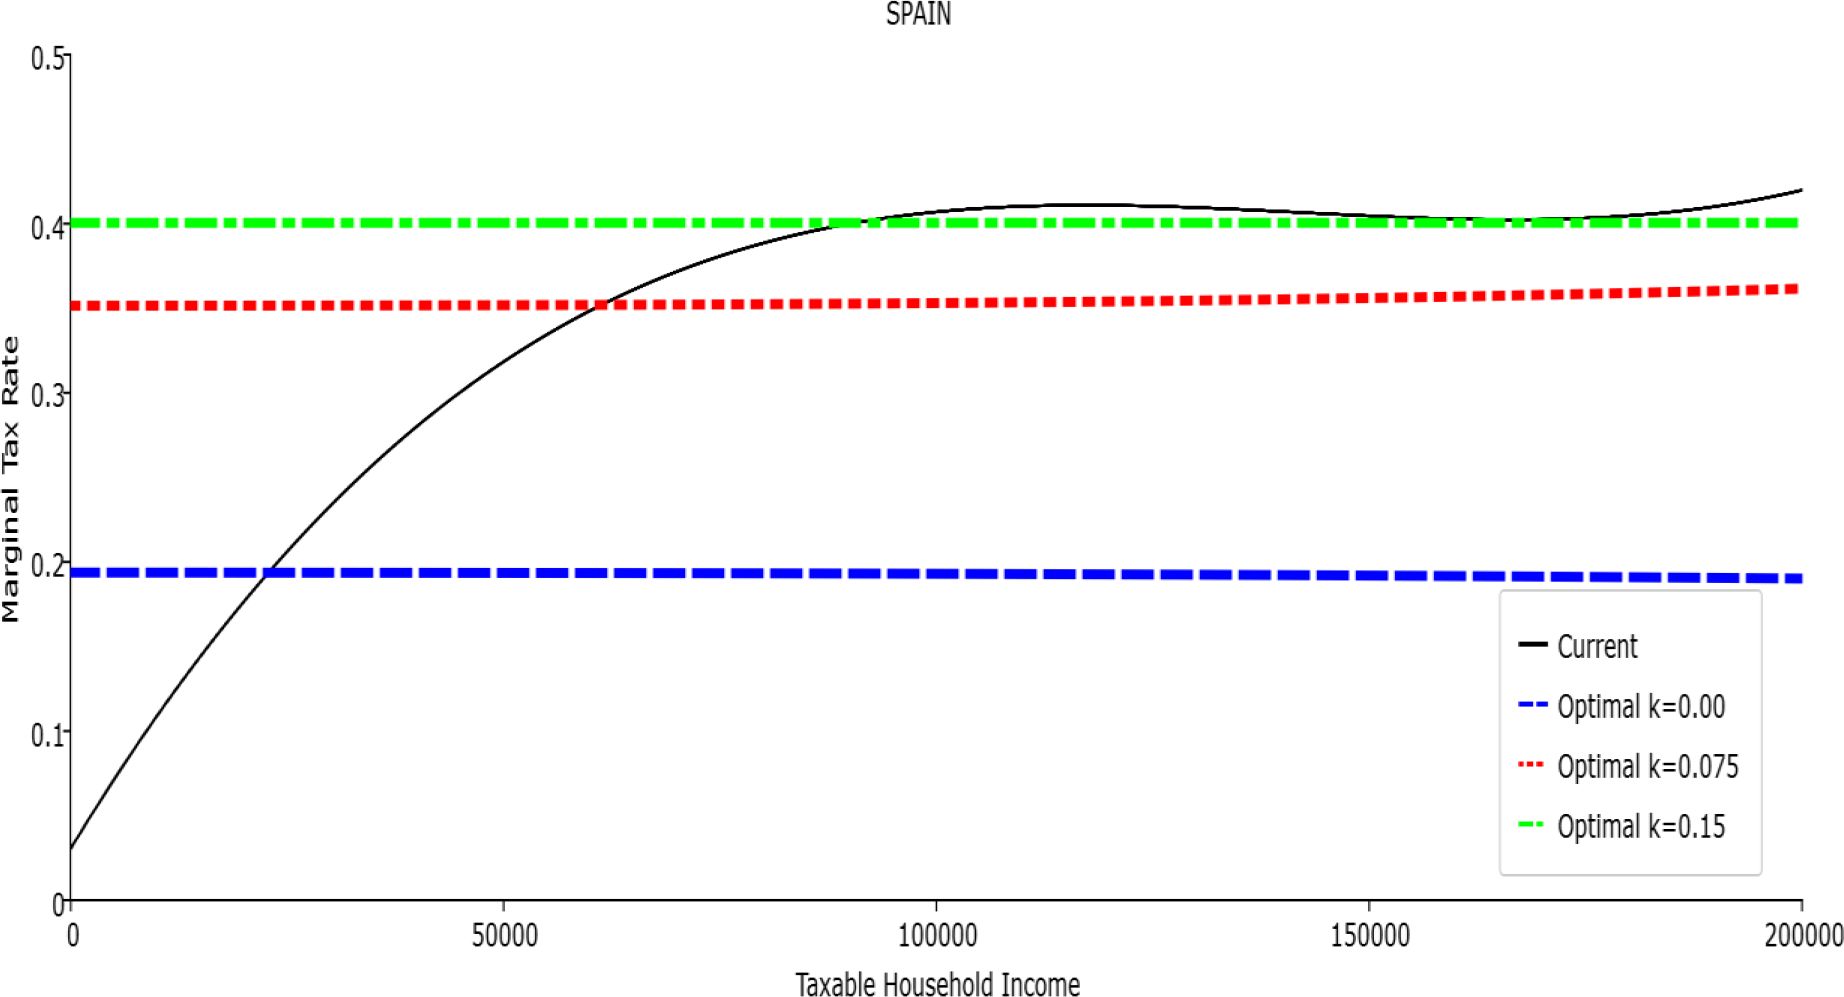
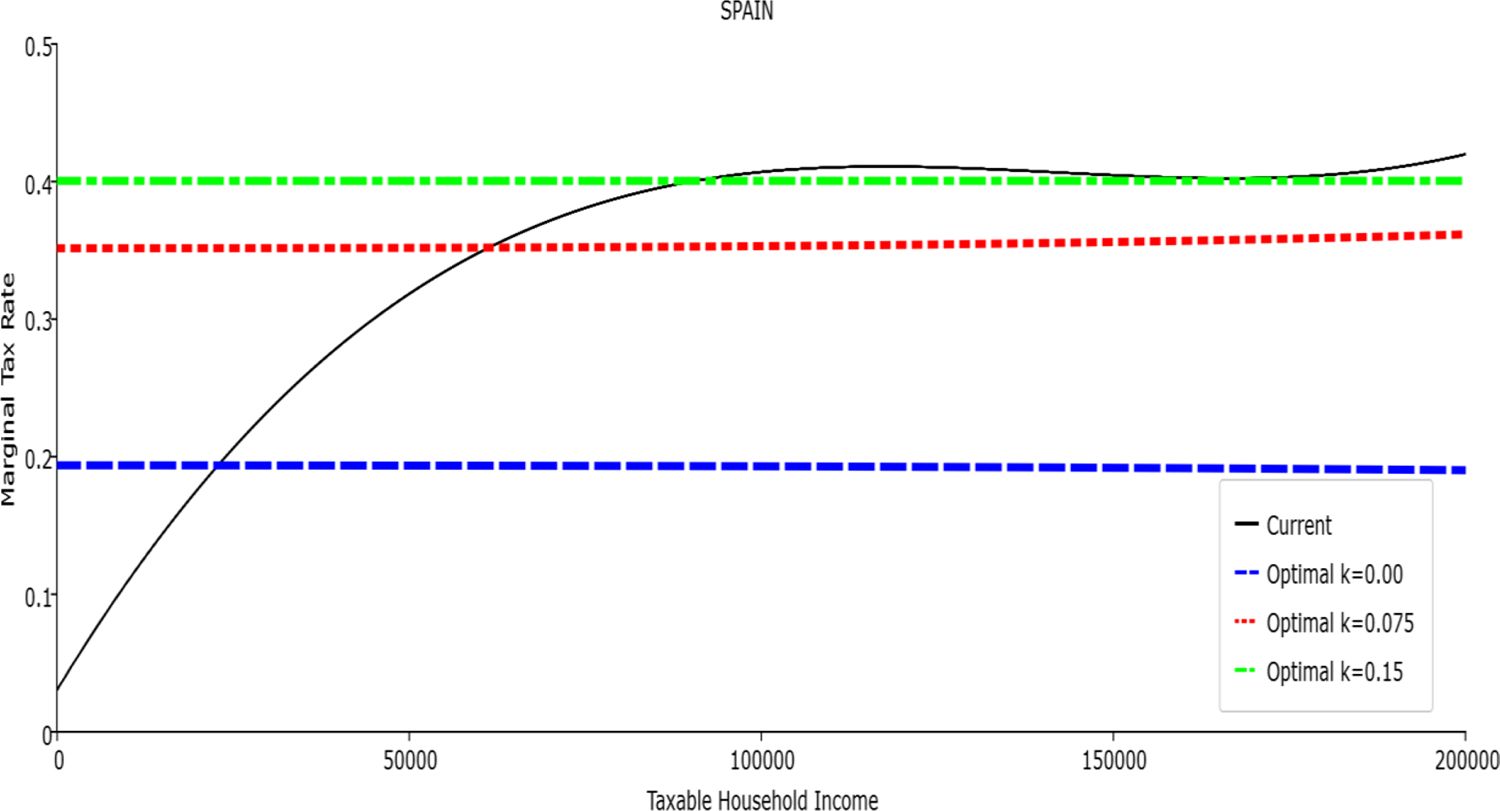
Marginal Tax Rate vs. Taxable Income. Spain
Figure 10
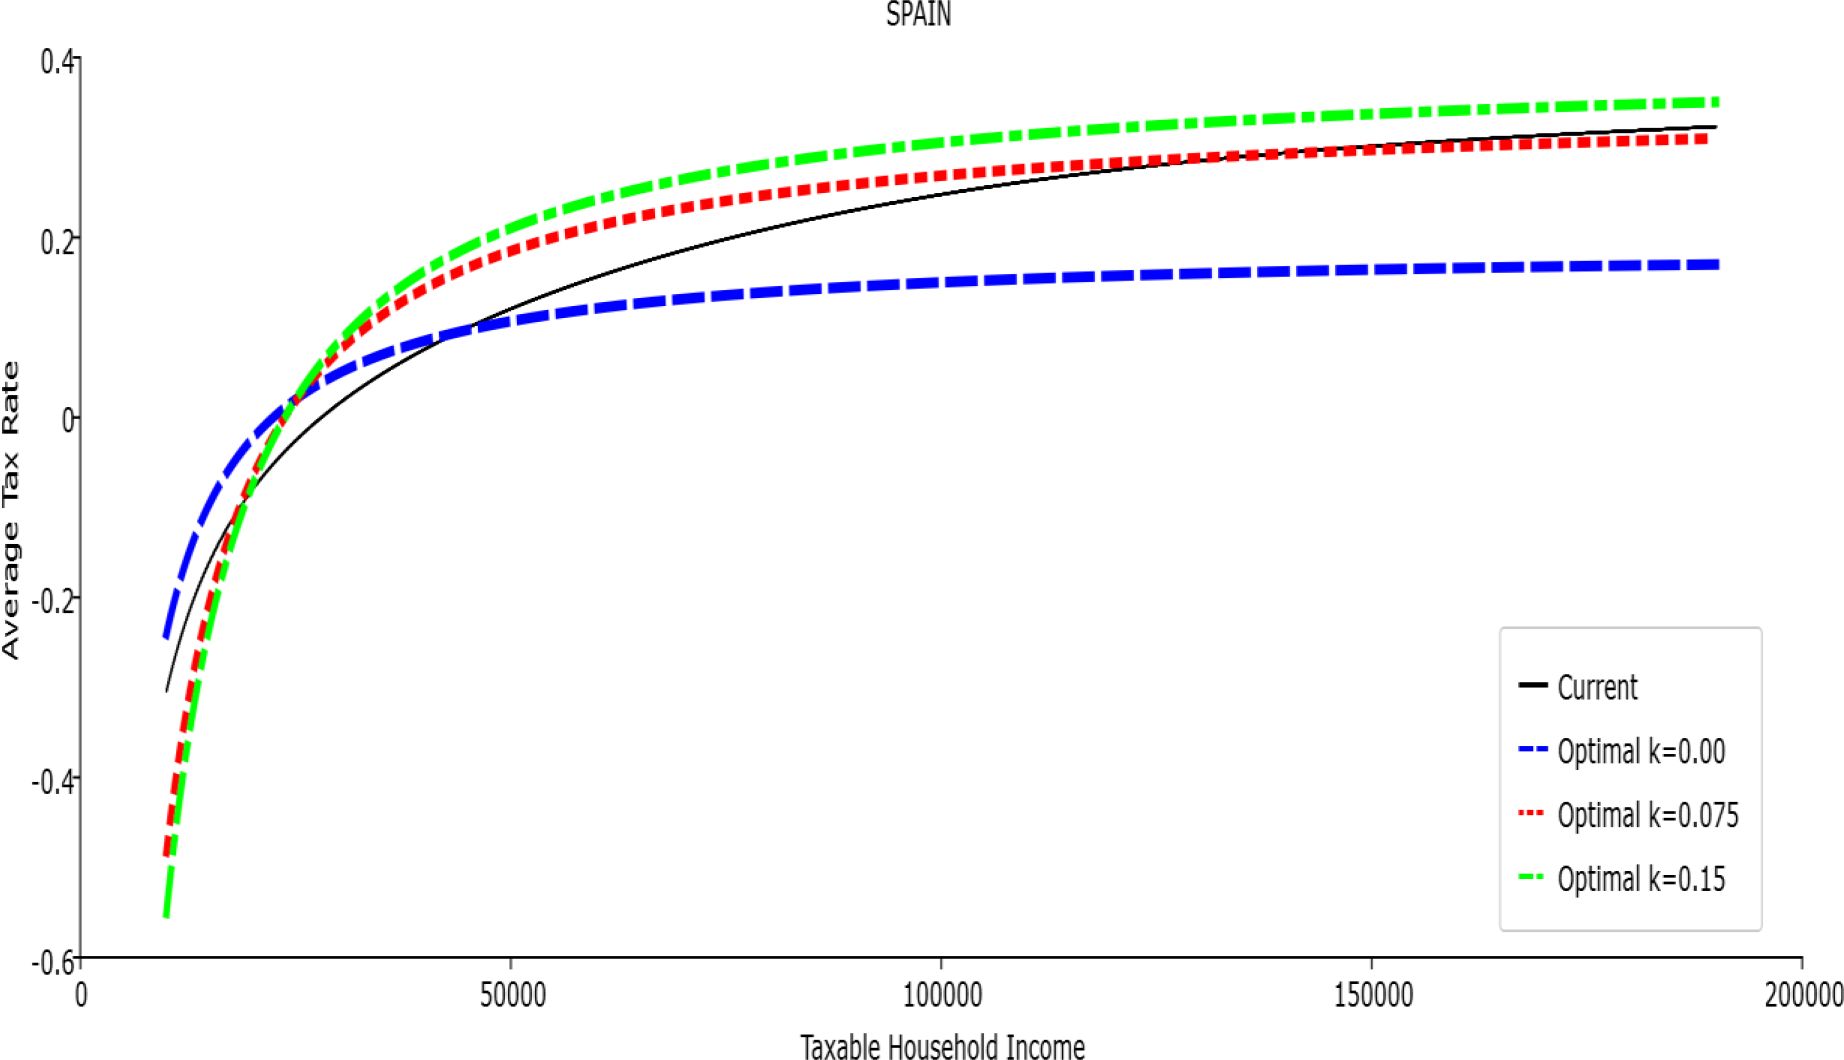
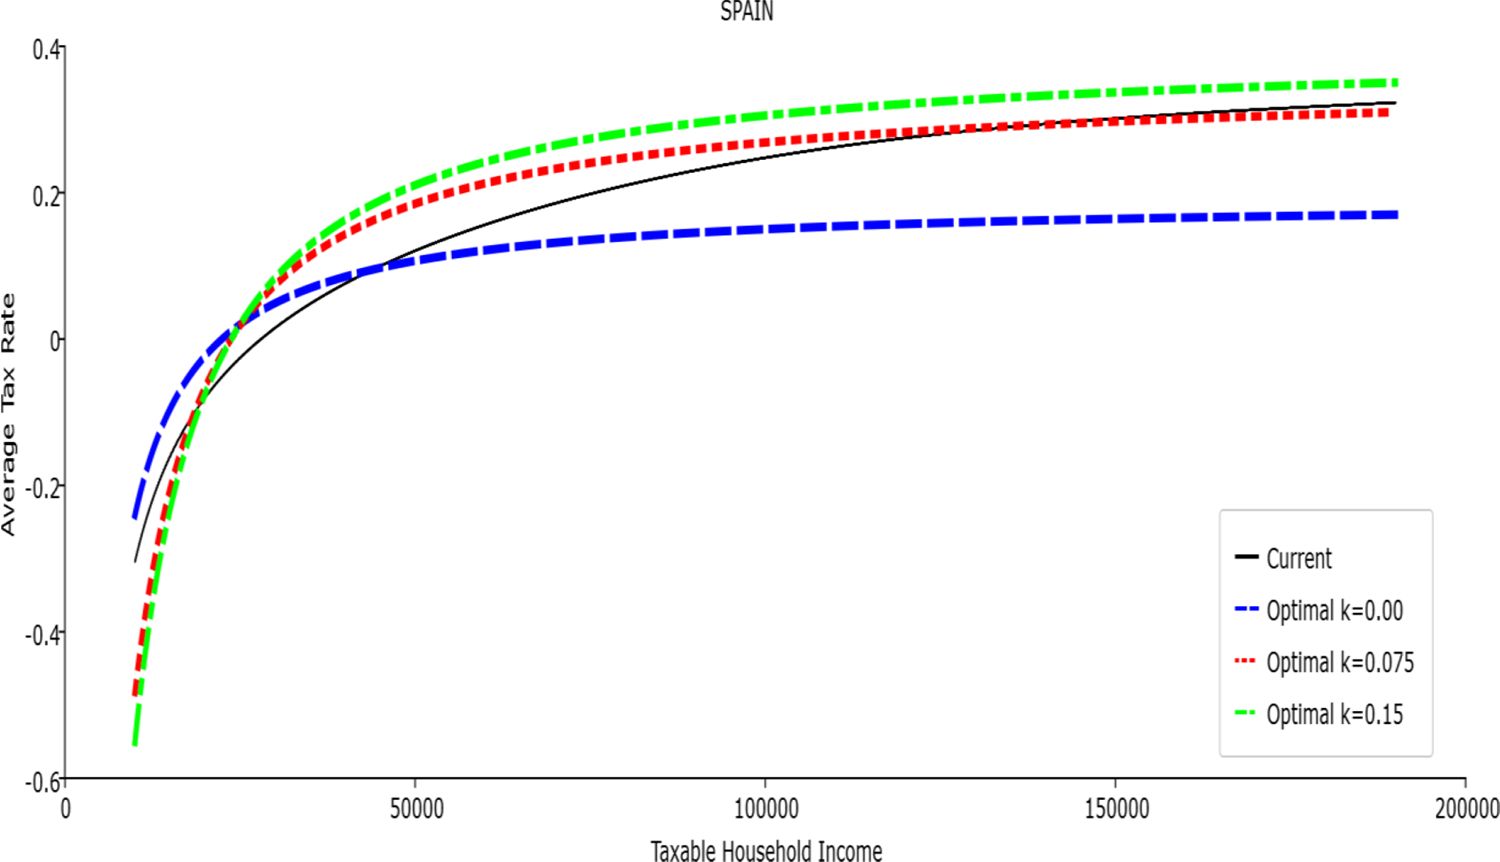
Average Tax Rate vs. Taxable Income. Spain
Figure 11
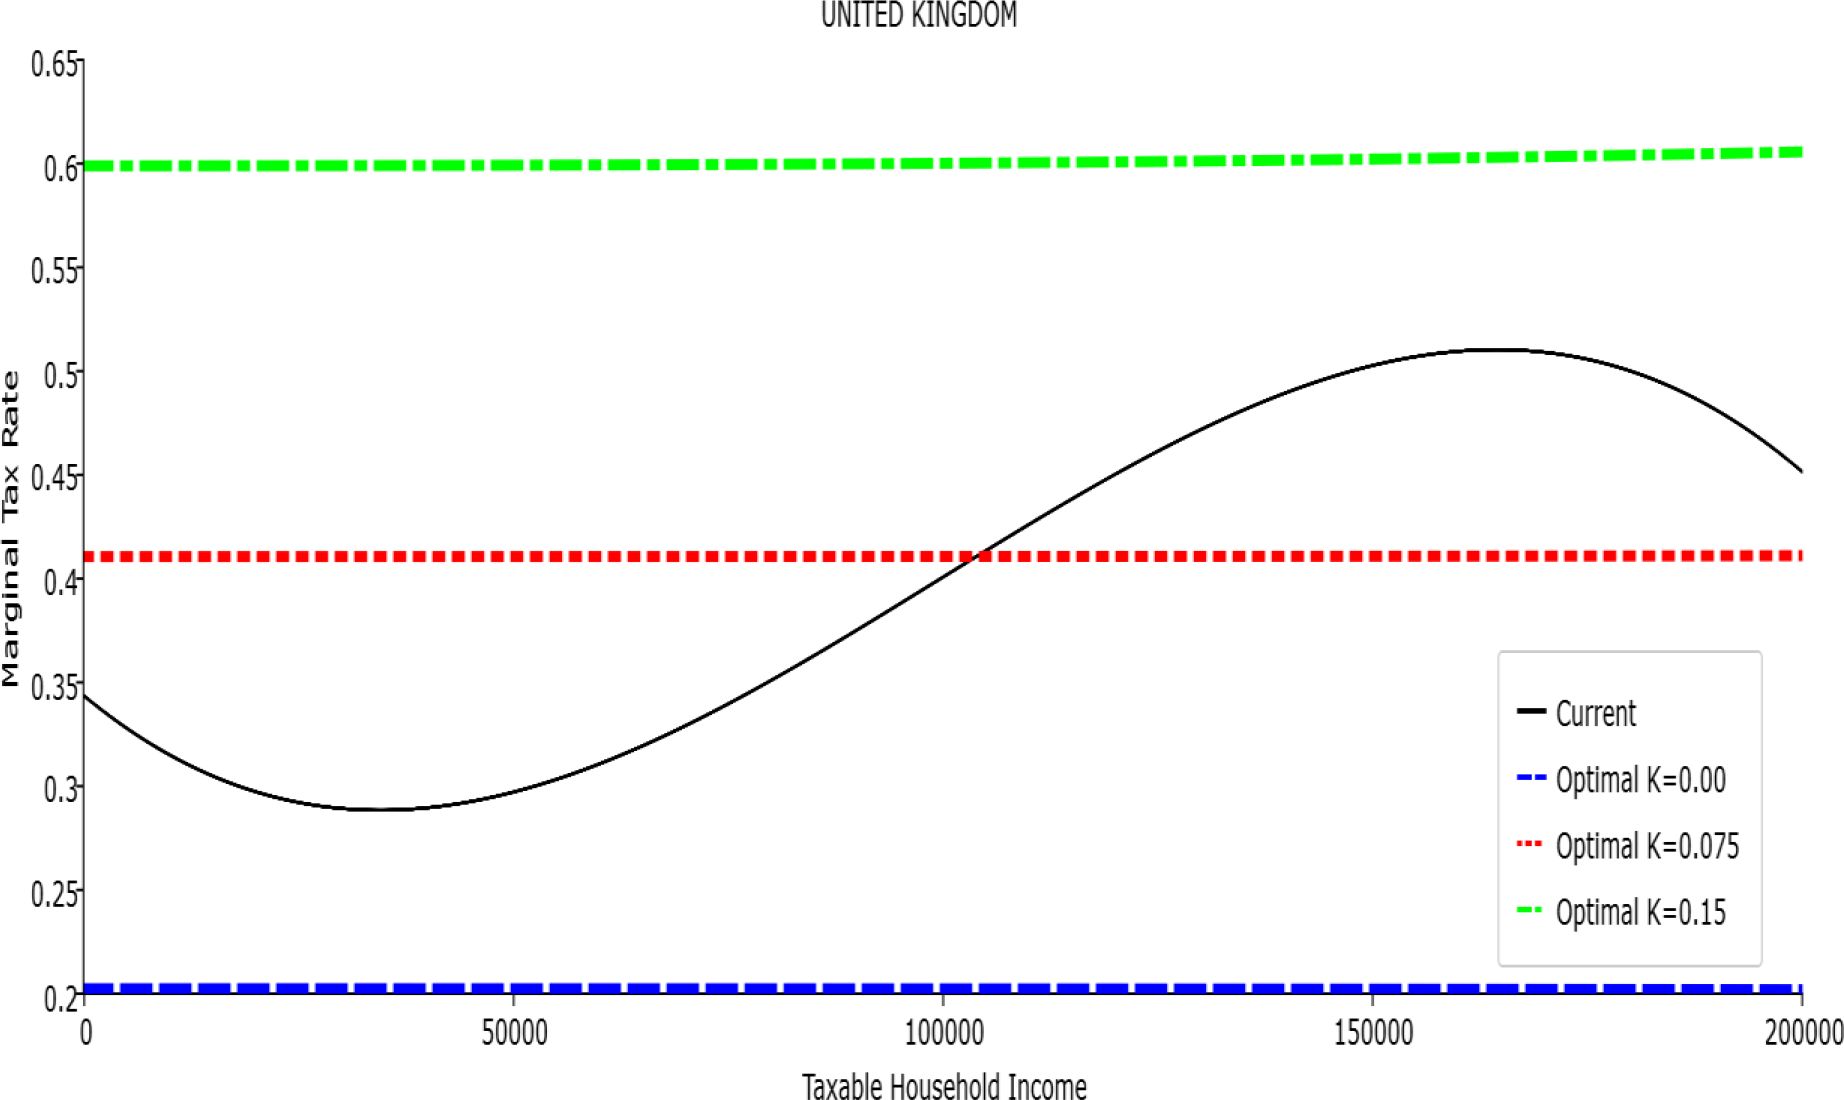
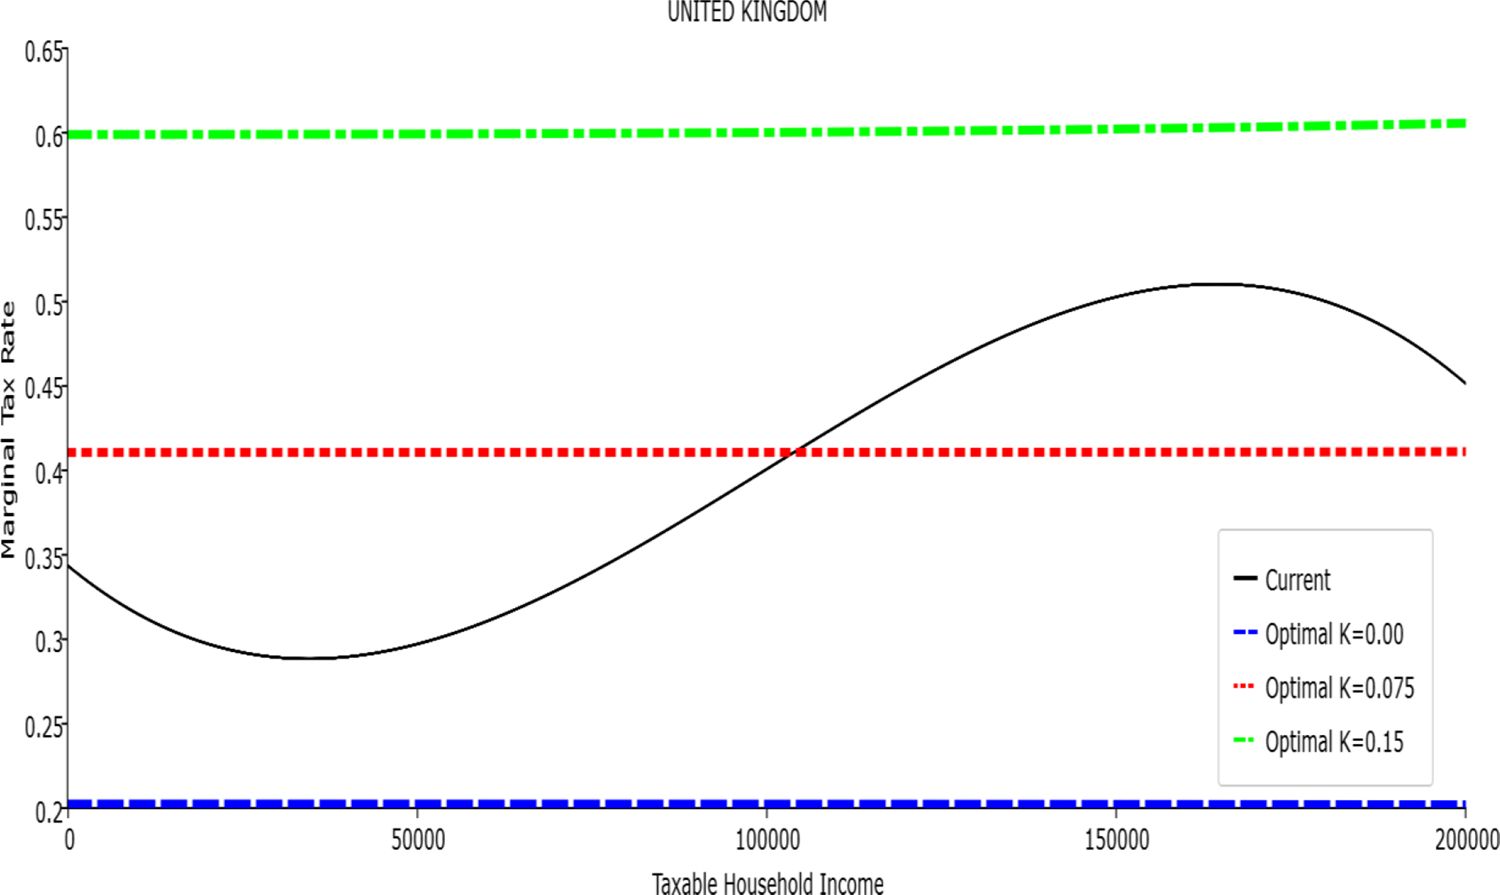
Marginal Tax Rate vs. Taxable Income. United Kingdom
Figure 12
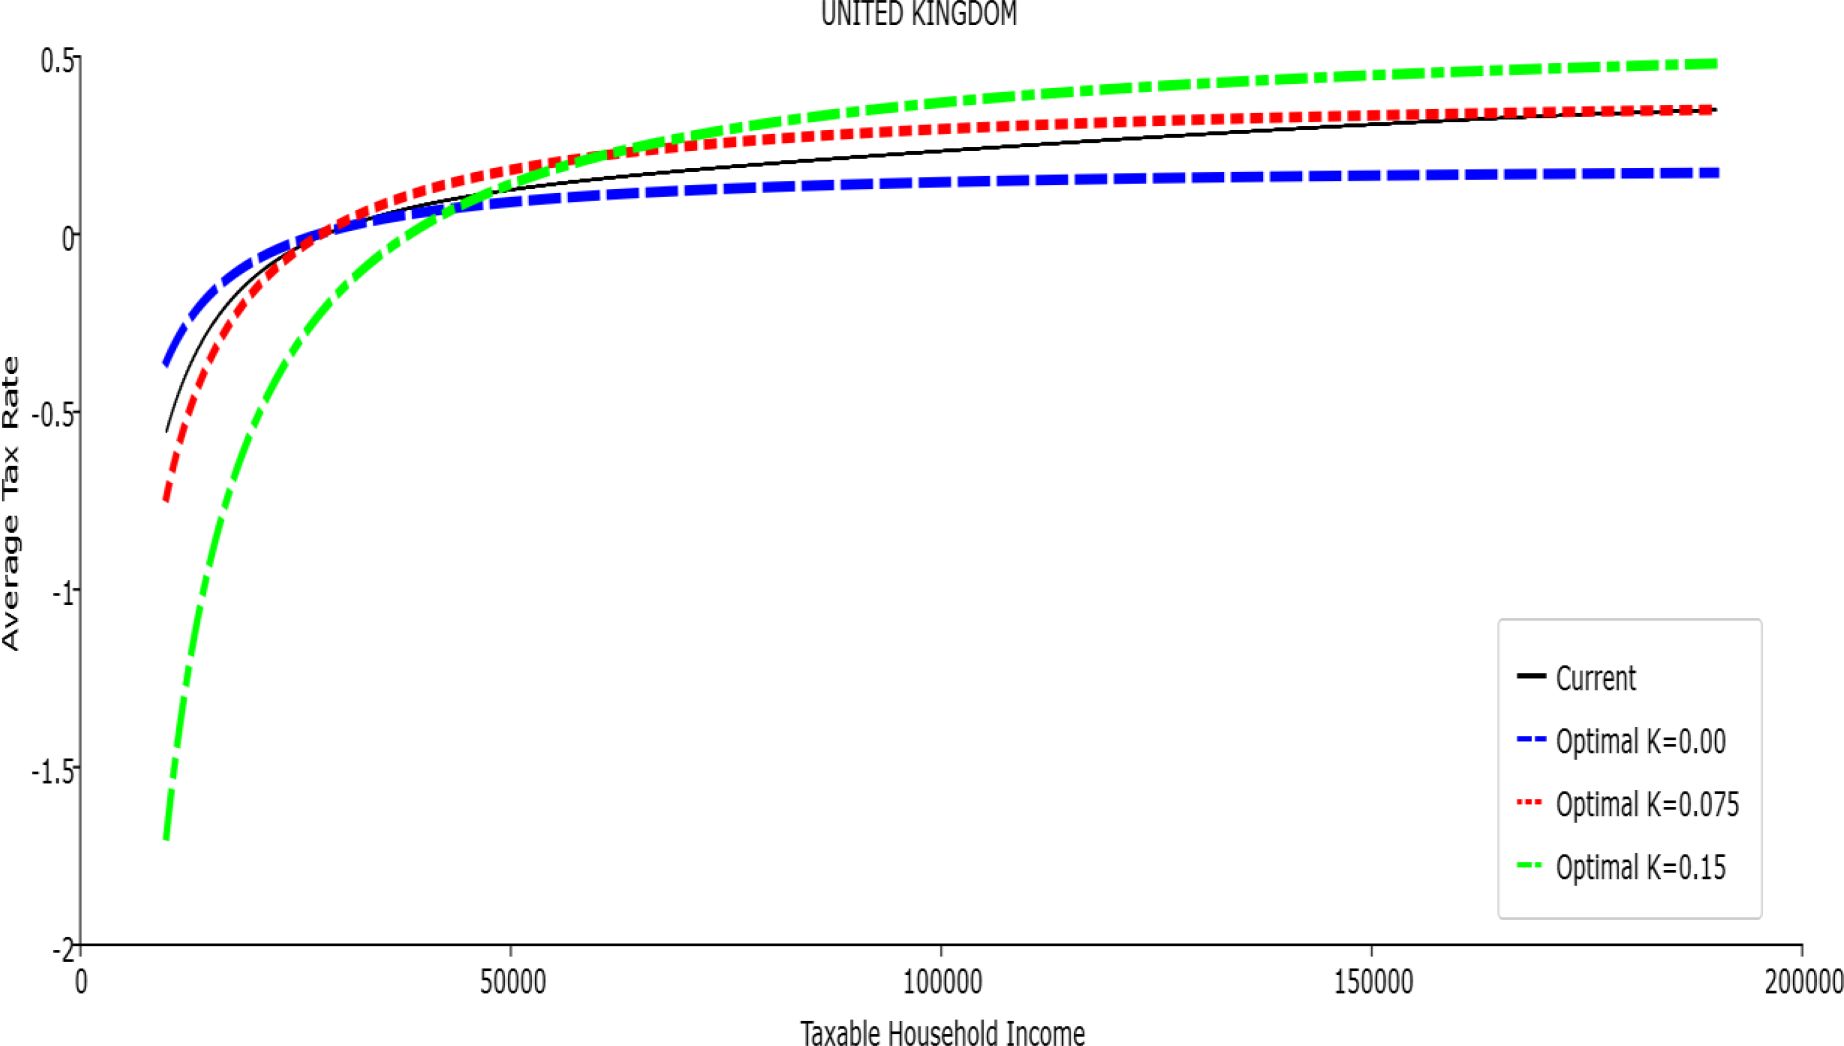
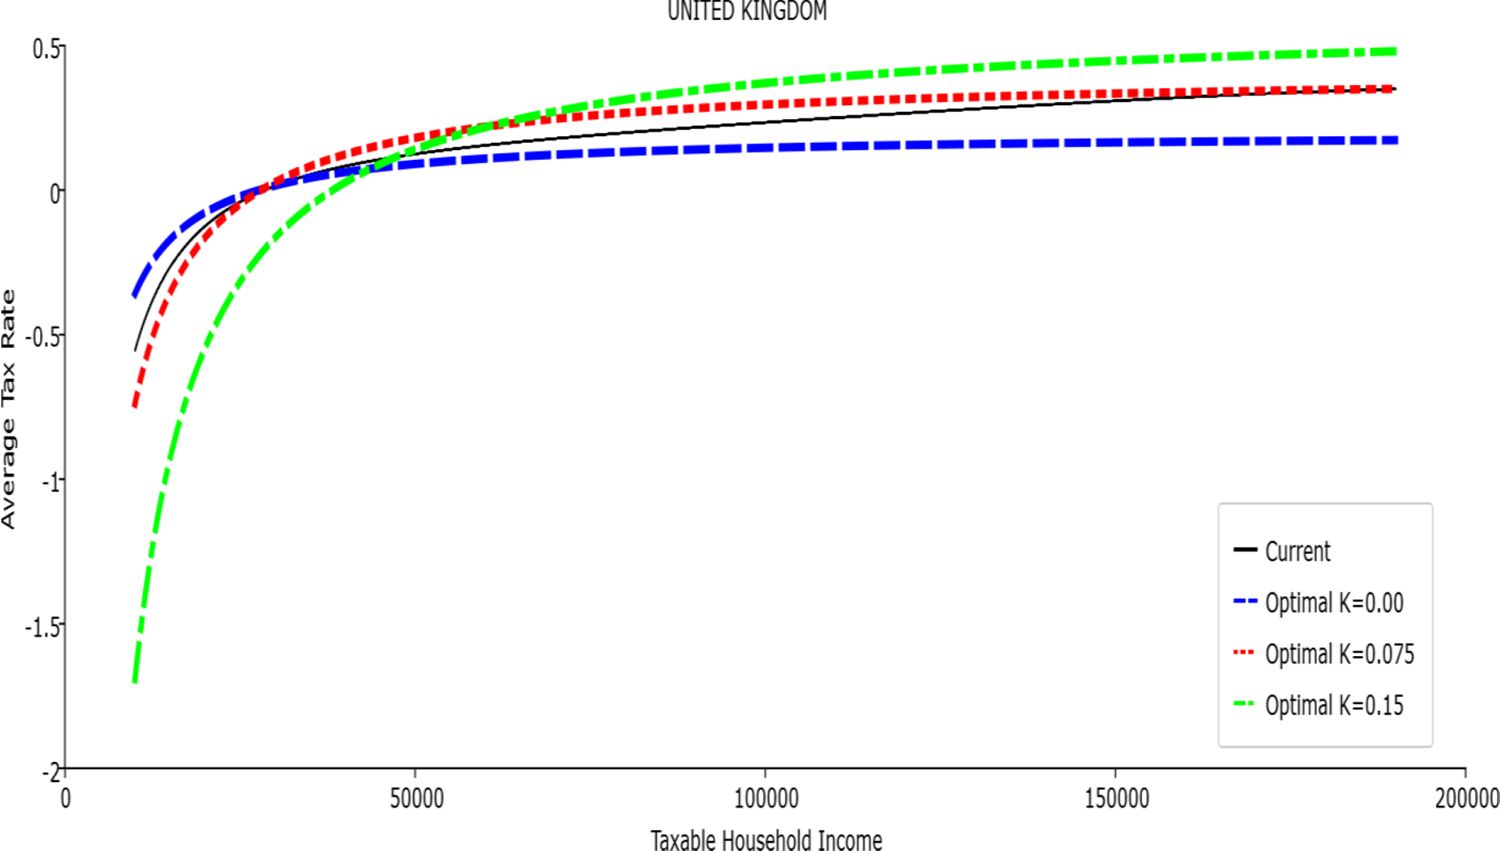
Average Tax Rate vs. Taxable Income. United Kingdom
Figure 13

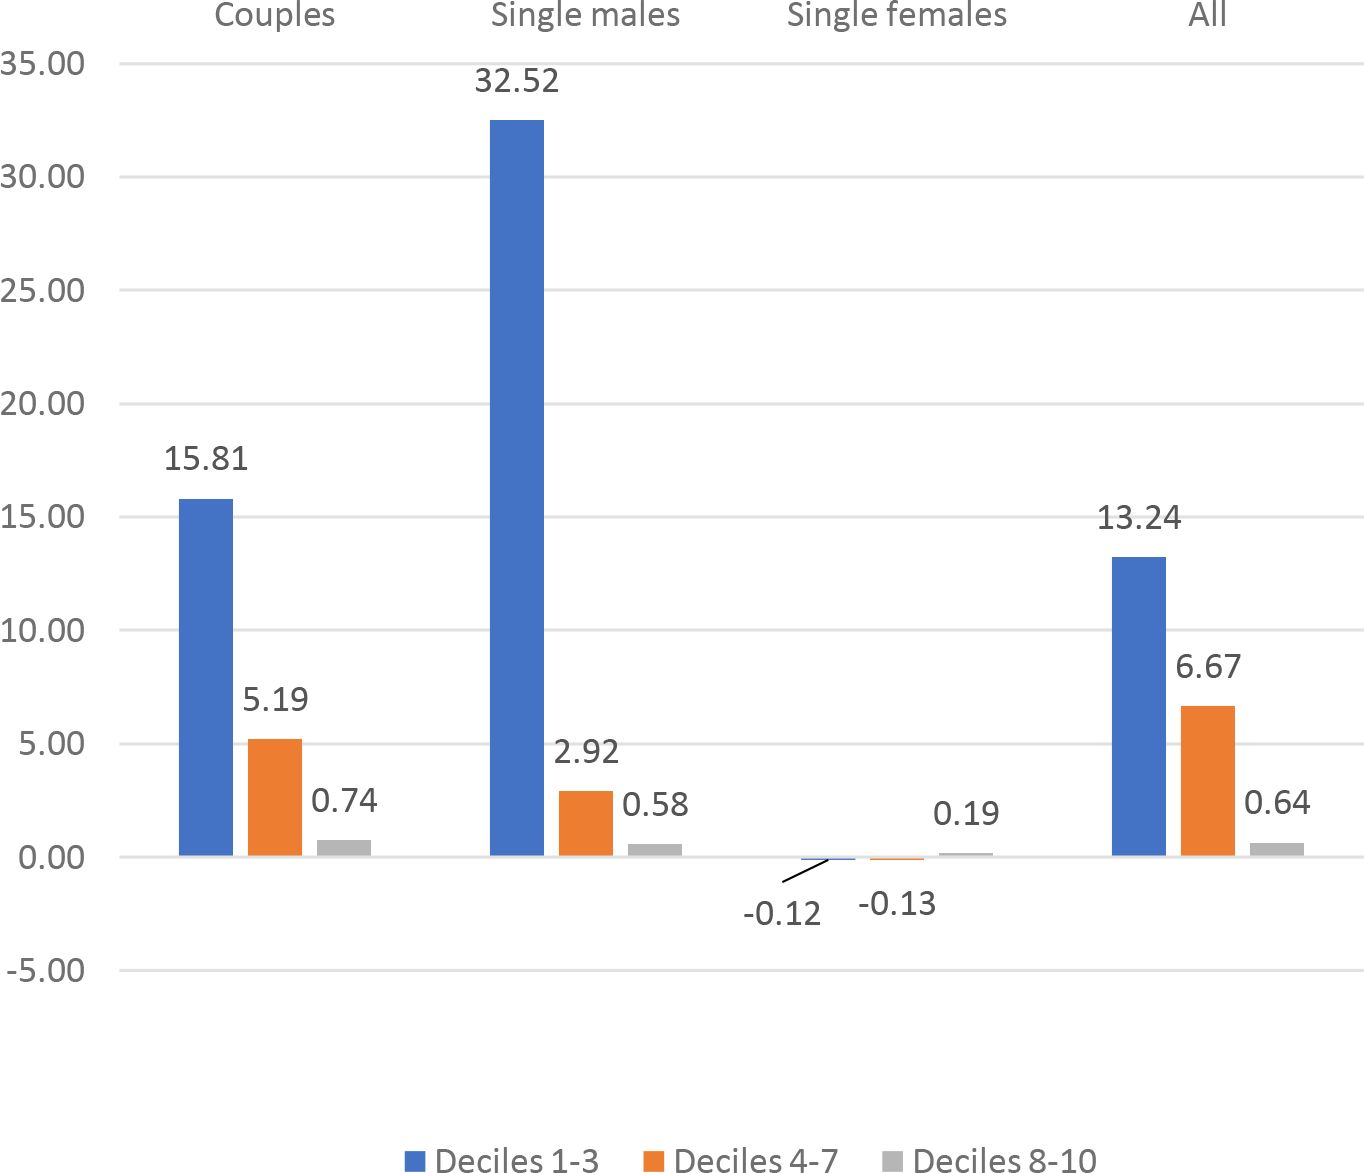
France: %change of CMU by demographic group and decile, k = 0.075.
Figure 14

France: %change of CMU by demographic group and decile, k = 0.075.
Figure 15

Italy: %change of CMU by demographic group and decile, k = 0.075.
Figure 16
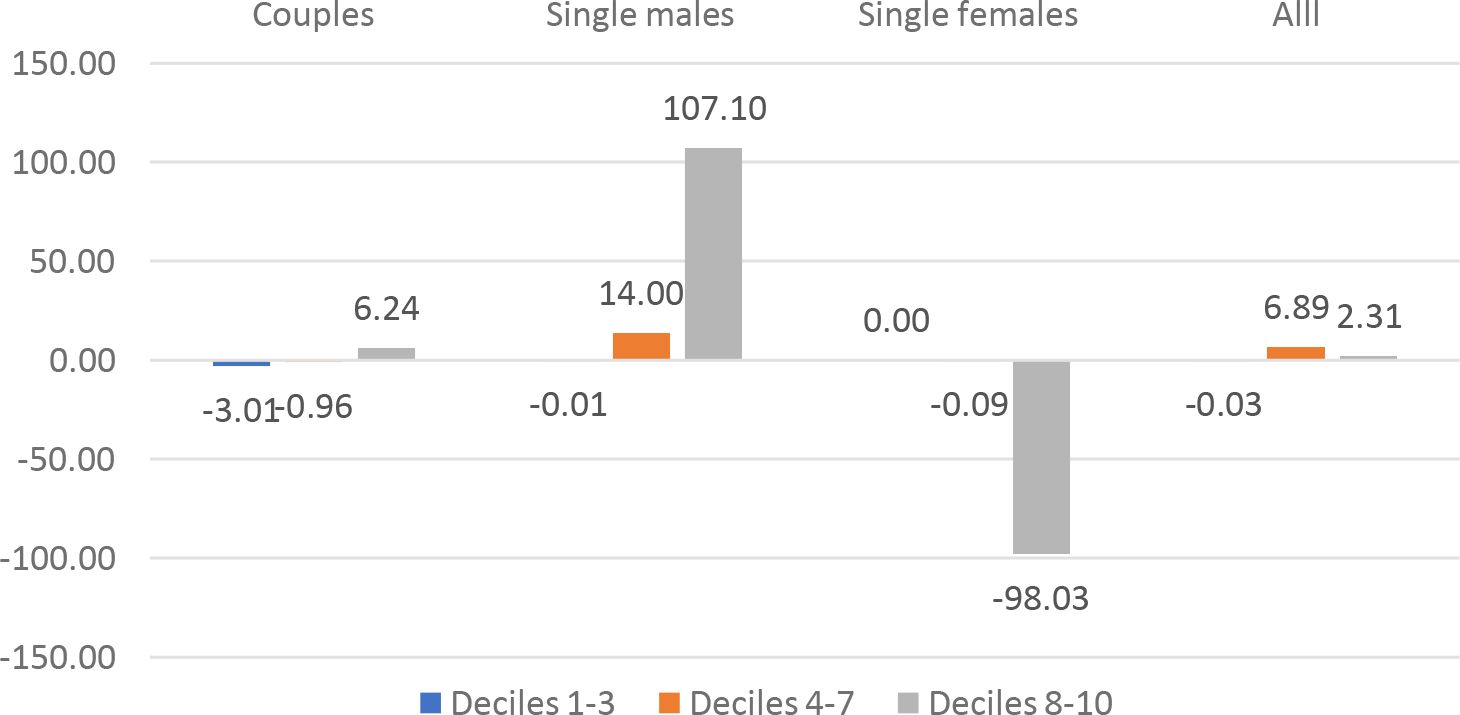

Luxembourg: %change of CMU by demographic group and decile, k = 0.075.
Figure 17
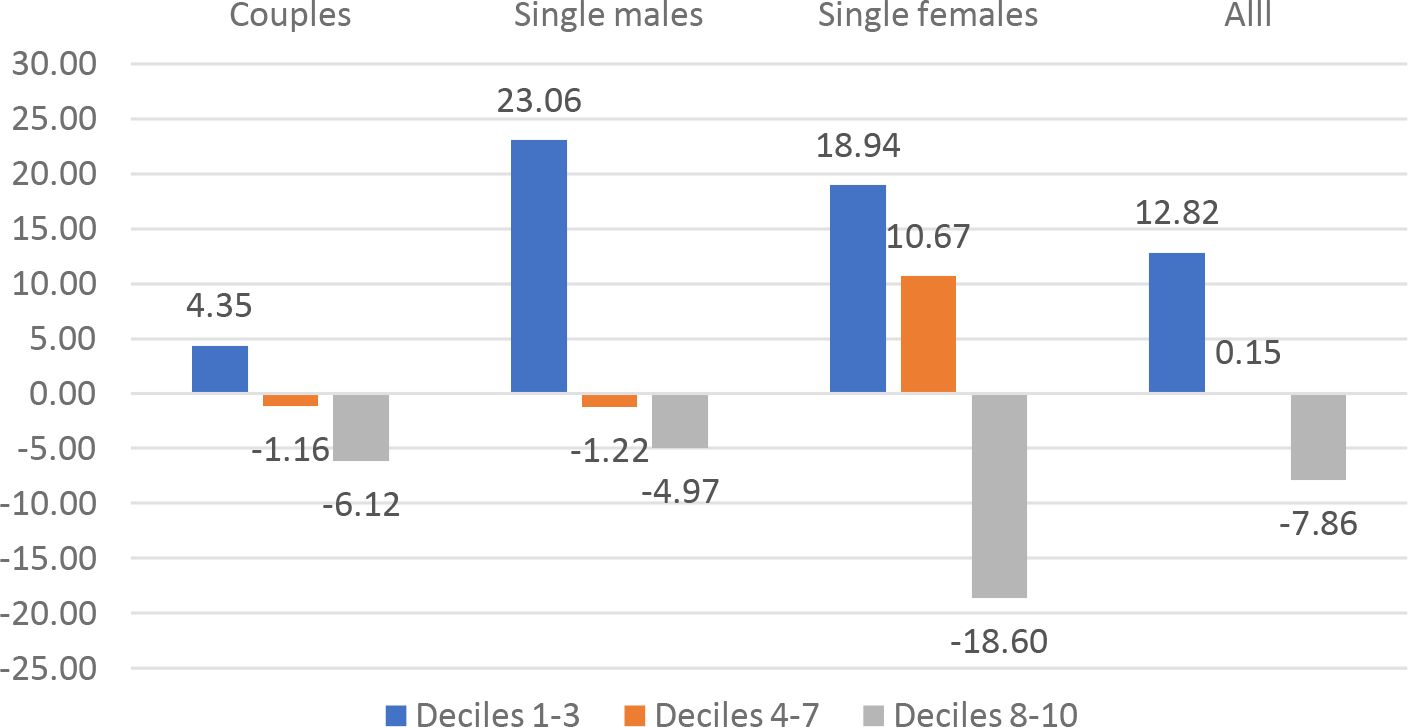

Spain: %change of CMU b.y demographic group and decile, k =0.075
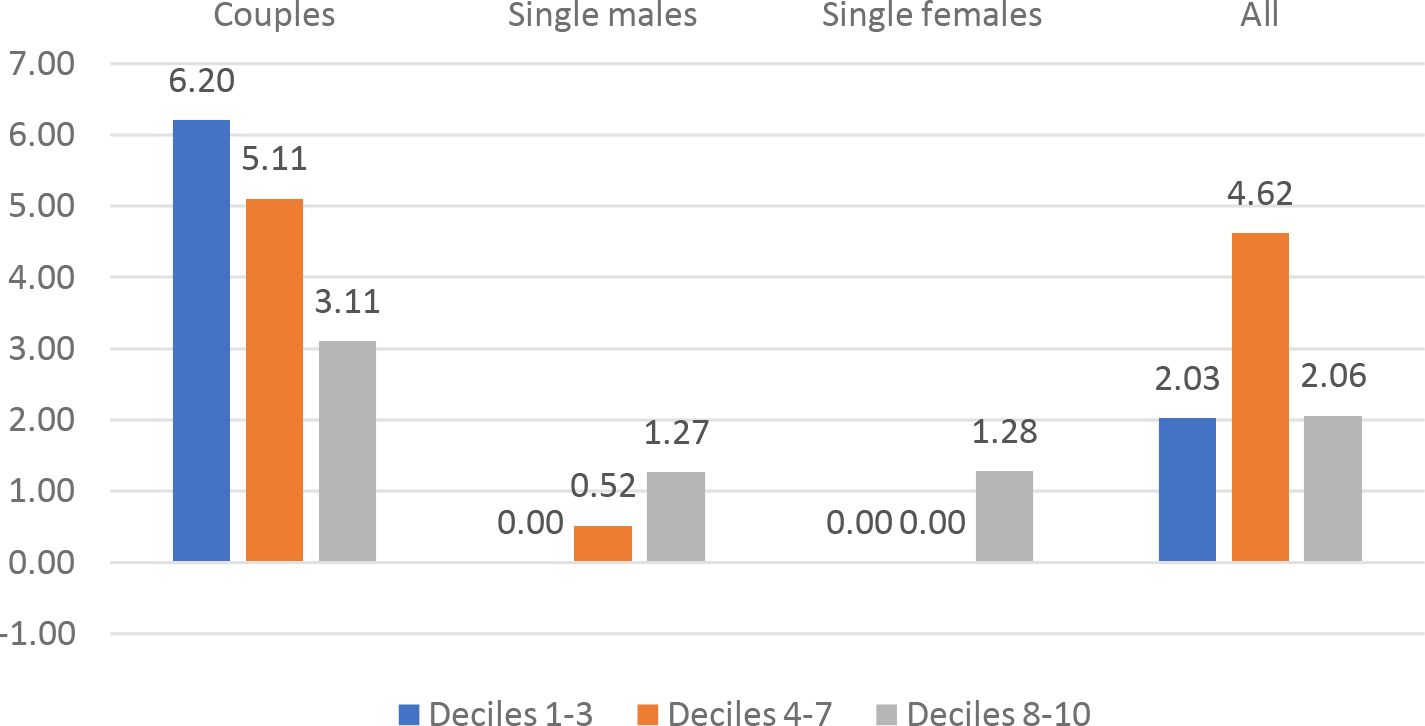
Figure 18

The UK: %change of CMU by demographic group and decile, k = 0.075.
Figure 19
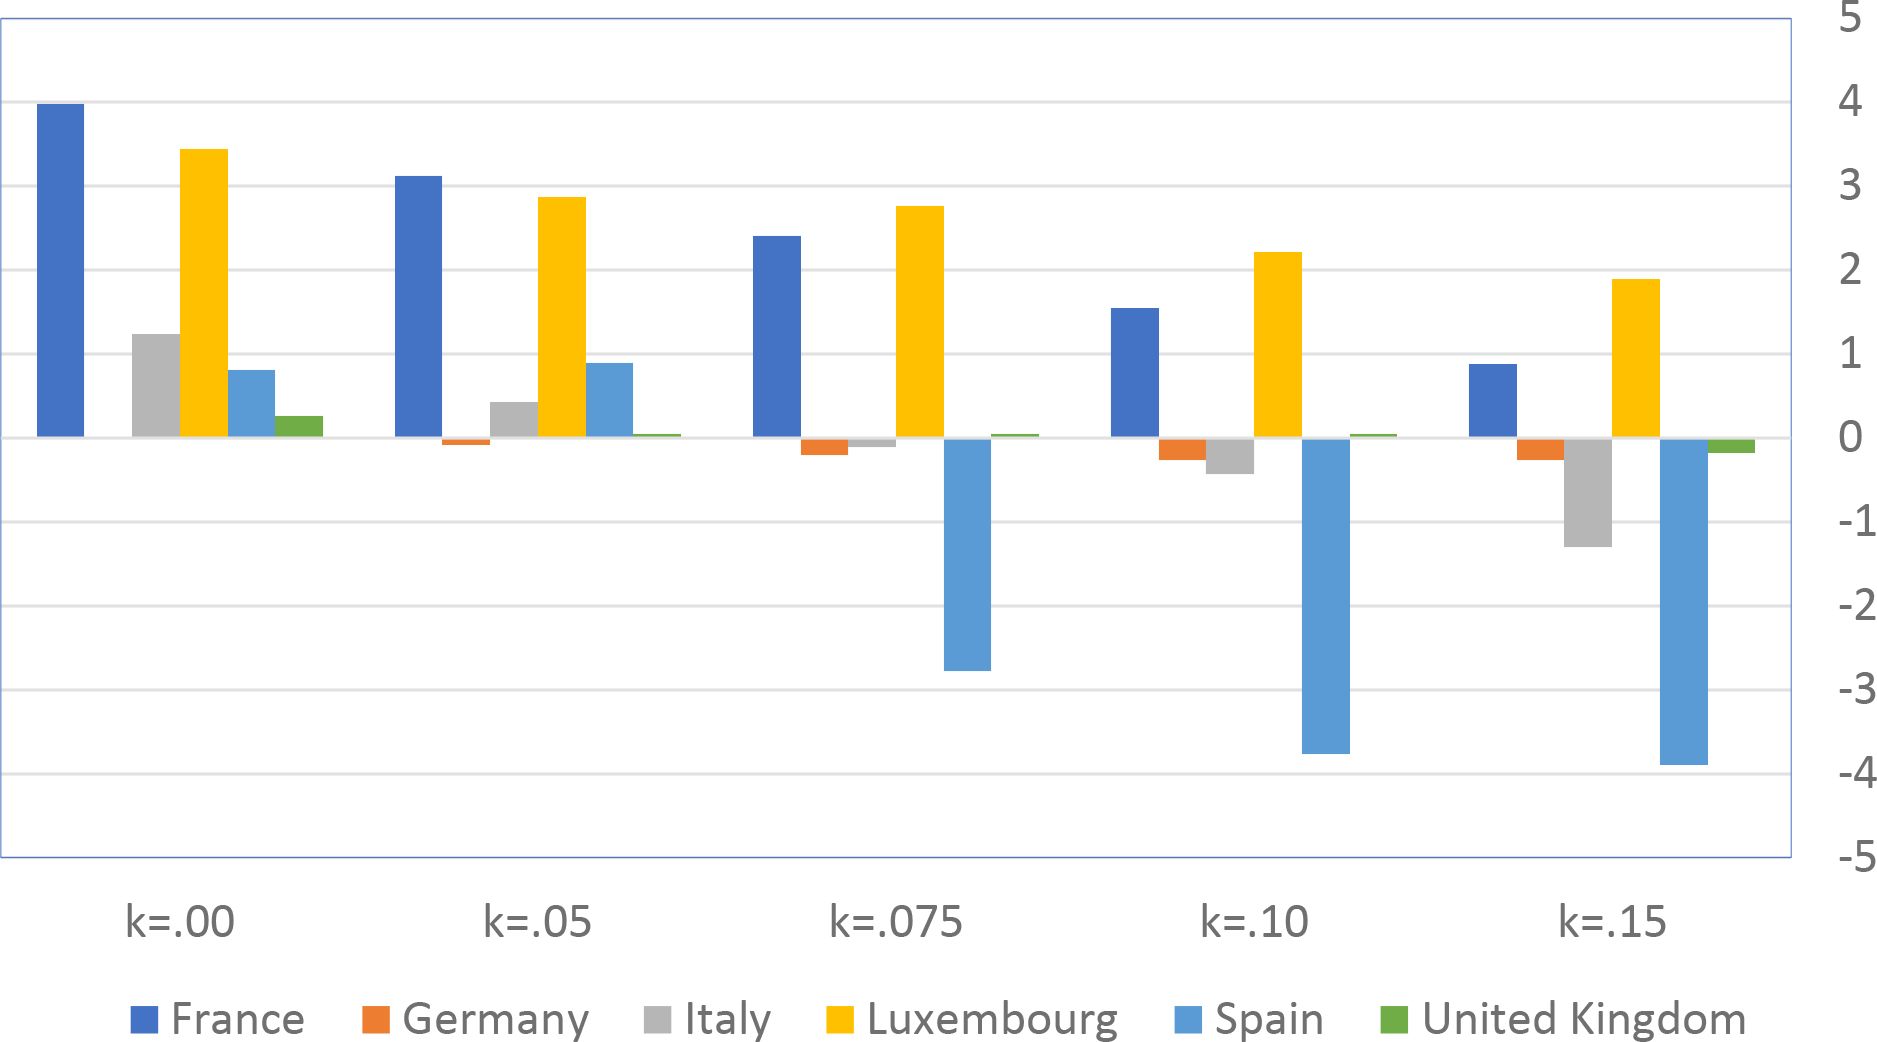
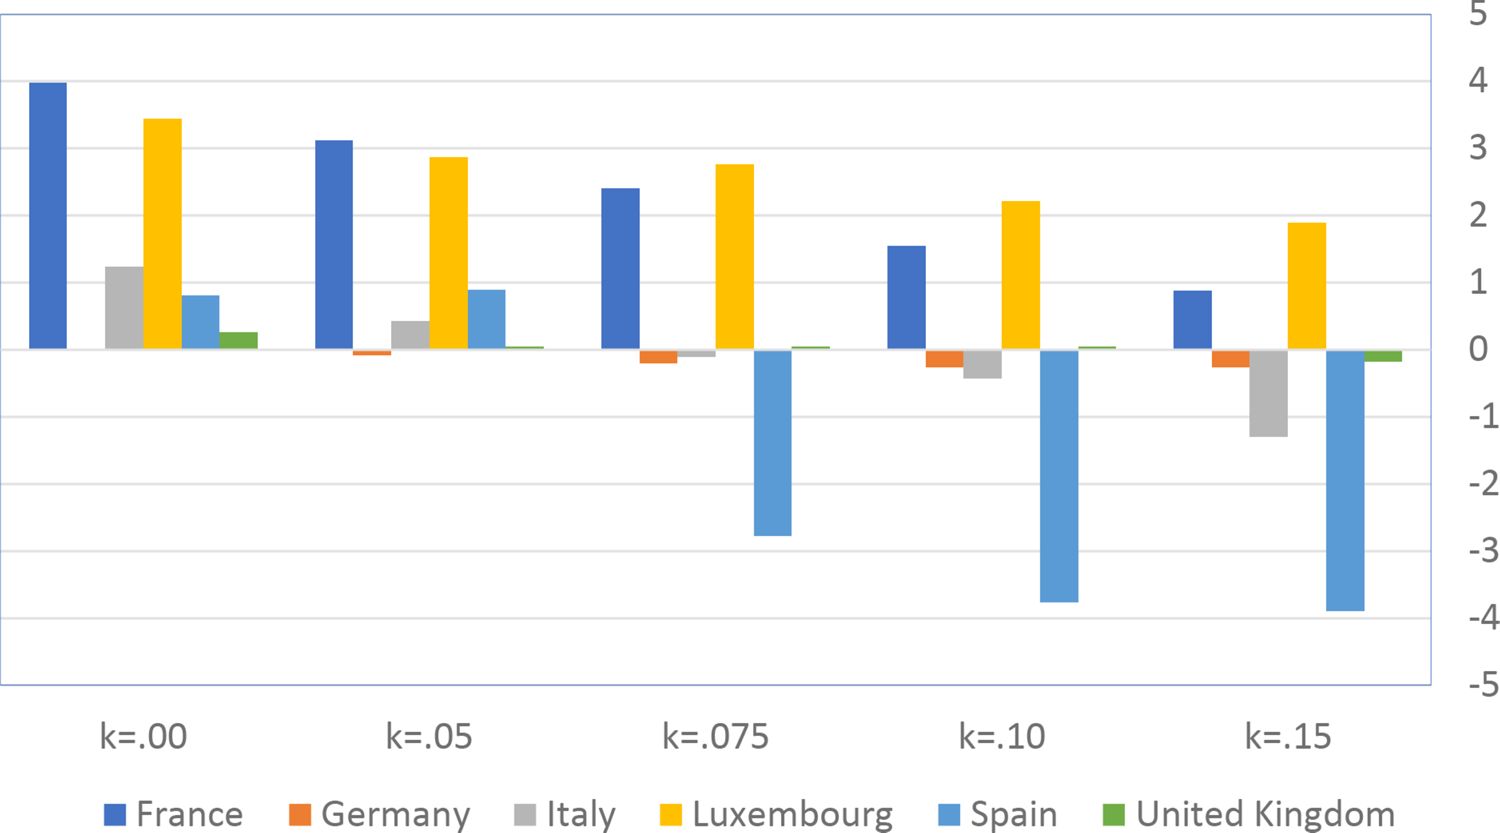
%change of disposable income w.r.t. current values by country and Kolm’s k.
Figure 20
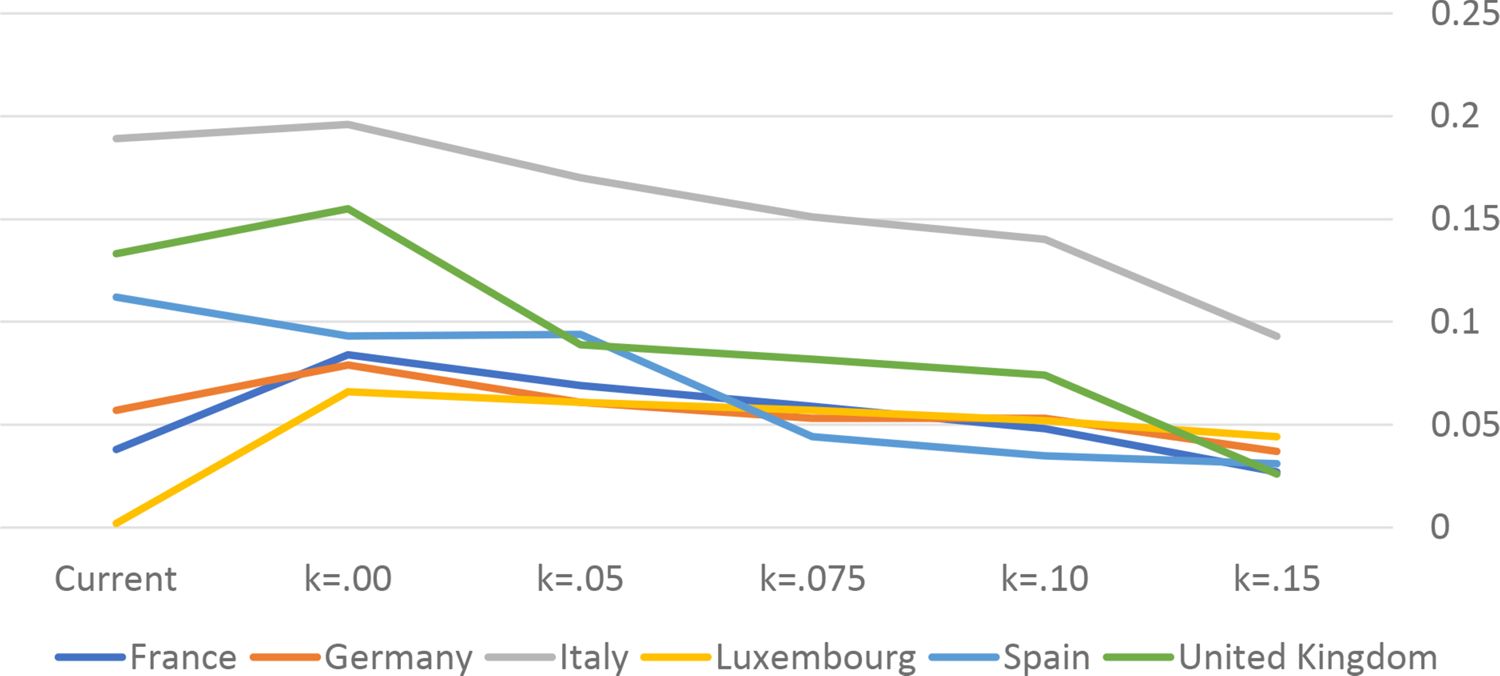
Povery Gap Index by country and Optimal TTR (indexed by Kolm’s k).
Tables
Table 1
“Current” and optimal TTRs
| Current* | k = .00 | k = .05 | k= .075 | k = .10 | k =.125 | k = .15 | ||
|---|---|---|---|---|---|---|---|---|
| France | τ0 | 603.27 | 61.43 | 181.72 | 265.57 | 367.97 | 453.77 | 592.02 |
| τ1 | 0.52 | 0.93 | 0.88 | 0.84 | 0.80 | 0.76 | 0.70 | |
| τ2 | 3.01×10⁻⁶ | -0.0000×10⁻⁶ | 0.0106×10⁻⁶ | 0.013×10⁻⁶ | 0.011×10⁻⁶ | 0.0098×10⁻⁶ | 0.0097×10⁻⁶ | |
| τ3 | -1.51×10⁻¹¹ | 0.0004×10⁻¹¹ | 0.0062×10⁻¹¹ | 0.015×10⁻¹¹ | 0.005×10⁻¹¹ | 0.0064×10⁻¹¹ | 0.0053×10⁻¹¹ | |
| τ4 | 0.20×10⁻¹⁶ | 0.0009×10⁻¹⁶ | 0.008×10⁻¹⁶ | 0.014×10⁻¹⁶ | 0.017×10⁻¹⁶ | 0.0098×10⁻¹⁶ | 0.0051×10⁻¹⁶ | |
| Germany | τ0 | 427.9 | 427.9 | 454.23 | 554.48 | 600.91 | 600.9075 | 701.7375 |
| τ1 | 0.71 | 0.71 | 0.69 | 0.66 | 0.64 | 0.64 | 0.61 | |
| τ2 | 0.0016×10⁻⁶ | 0.003×10⁻⁶ | 0.001×10⁻⁶ | 0.0001×10⁻⁶ | 0.001×10⁻⁶ | 0.002×10⁻⁶ | 0.002×10⁻⁶ | |
| τ3 | 0.0009×10⁻¹¹ | 0.005×10⁻¹¹ | -0.002×10⁻¹¹ | 0.001×10⁻¹¹ | 0.001×10⁻¹¹ | 0.001×10⁻¹¹ | 0.001×10⁻¹¹ | |
| τ4 | 0.0022×10⁻¹⁶ | 0.010×10⁻¹⁶ | 0.004×10⁻¹⁶ | 0.001×10⁻¹⁶ | 0.001×10⁻¹⁶ | 0.004×10⁻¹⁶ | 0.002×10⁻¹⁶ | |
| Italy | τ0 | 217.24 | 98.99 | 177.28 | 236.69 | 270.67 | 350.15 | 417.72 |
| τ1 | 0.745 | 0.752 | 0.698 | 0.66 | 0.63 | 0.58 | 0.53 | |
| τ2 | -1.98×10⁻⁶ | -0.02×10⁻⁶ | -0.01×10⁻⁶ | 0.002×10⁻⁶ | 0.005×10⁻⁶ | 0.0002×10⁻⁶ | 0.0008×10⁻⁶ | |
| τ3 | 0.69×10⁻¹¹ | 0.04×10⁻¹¹ | 0.01×10⁻¹¹ | 0.004×10⁻¹¹ | 0.004×10⁻¹¹ | 0.0000×10⁻¹¹ | -0.0004×10⁻¹¹ | |
| τ4 | -0.07×10⁻¹⁶ | -0.02×10⁻¹⁶ | -0.01×10⁻¹⁶ | -0.0000×10⁻¹⁶ | 0.003×10⁻¹⁶ | 0.0005×10⁻¹⁶ | 0.0025×10⁻¹⁶ | |
| Luxembourg | τ0 | 1469.68 | 615.73 | 680.78 | 746.64 | 809.23 | 858.74 | 926.17 |
| τ1 | 0.316 | 0.761 | 0.75 | 0.717 | 0.706 | 0.692 | 0.676 | |
| τ2 | 4.12×10⁻⁶ | 0.228×10⁻⁶ | 0.24×10⁻⁶ | 0.23×10⁻⁶ | 0.245×10⁻⁶ | 0.227×10⁻⁶ | 0.223×10⁻⁶ | |
| τ3 | -1.869×10⁻¹¹ | 0.019×10⁻¹¹ | 0.022×10⁻¹¹ | 0.014×10⁻¹¹ | 0.051×10⁻¹¹ | 0.041×10⁻¹¹ | 0.013×10⁻¹¹ | |
| τ4 | 0.25×10⁻¹⁶ | 0.07×10⁻¹⁶ | 0.017×10⁻¹⁶ | 0.075×10⁻¹⁶ | 0.008×10⁻¹⁶ | 0.009×10⁻¹⁶ | -0.004×10⁻¹⁶ | |
| Spain | τ0 | 196.42 | 227.43 | 225.51 | 436.88 | 481.18 | 493.54 | 498.23 |
| τ1 | 0.97 | 0.81 | 0.81 | 0.65 | 0.61 | 0.60 | 0.60 | |
| τ2 | -4.24×10⁻⁶ | 0.001×10⁻⁶ | 0.0005×10⁻⁶ | -0.0012×10⁻⁶ | 0.001×10⁻⁶ | 0.0005×10⁻⁶ | -0.0001×10⁻⁶ | |
| τ3 | 2.05×10⁻¹¹ | 0.001×10⁻¹¹ | .0008×10-11 | -.0008×10-11 | 0.0003×10⁻¹¹ | -.0001×10-11 | 0.0000×10⁻¹¹ | |
| τ4 | -0.36×10⁻¹⁶ | 0.001×10⁻¹⁶ | 0.0008×10⁻¹⁶ | -0.003×10⁻¹⁶ | 0.001×10⁻¹⁶ | 0.0002×10⁻¹⁶ | 0.0000×10⁻¹⁶ | |
| United Kingdom | τ0 | 455.51 | 289.08 | 564.61 | 564.82 | 628.61 | 749.57 | 864.62 |
| τ1 | 0.66 | 0.80 | 0.61 | 0.61 | 0.57 | 0.48 | 0.40 | |
| τ2 | 1.717×10⁻⁶ | -0.0002×10⁻⁶ | 0.0003×10⁻⁶ | 0.0003×10⁻⁶ | 0.001×10⁻⁶ | -0.005×10⁻⁶ | -0.001×10⁻⁶ | |
| τ3 | -2.008×10⁻¹¹ | 0.0002×10⁻¹¹ | 0.0001×10⁻¹¹ | 0.001×10⁻¹¹ | -0.0006×10⁻¹¹ | 0.002×10⁻¹¹ | -0.002×10⁻¹¹ | |
| τ4 | 0.505×10⁻¹⁶ | 0.0001×10⁻¹⁶ | 0.0001×10⁻¹⁶ | 0.0004×10⁻¹⁶ | -0.0004×10⁻¹⁶ | -0.003×10⁻¹⁶ | -0.001×10⁻¹⁶ |
-
*
In the “Current” column, the parameter τ are those of the polynomial approximation to the current TTR.
Table 2
Welfare Gains and Welfare Winners
| k = .00 | k = .05 | k= .075 | k = .10 | k =.125 | k = .15 | ||
|---|---|---|---|---|---|---|---|
| France | Social Welfare Gain | 159.23 | 89.63 | 53.17 | 16.37 | -8.6 | -45.47 |
| Equality Gain | 0 | -20.31 | -20.64 | -12.4 | -1.86 | 20.3 | |
| Efficiency Gain | 159.23 | 109.94 | 73.81 | 28.77 | -6.64 | -65.77 | |
| %Winners: All | 67 | 67 | 66 | 65 | 64 | 61 | |
| %Winners: Couples | 66 | 66 | 65 | 64 | 62 | 57 | |
| %Winners: Single Males | 84 | 80 | 76 | 71 | 66 | 62 | |
| %Winners: Single Females | 51 | 55 | 57 | 61 | 66 | 72 | |
| Germany | Social Welfare Gain | -7.48 | -5.00 | 41.05 | 71.39 | 87.65 | 155.27 |
| Equality Gain | 0 | -2.02 | 8.51 | 23.68 | 39.94 | 78.61 | |
| Efficiency Gain | -7.48 | -2.98 | 32.54 | 47.71 | 47.71 | 76.66 | |
| %Winners: All | 46 | 44 | 46 | 46 | 46 | 49 | |
| %Winners: Couples | 41 | 41 | 41 | 41 | 41 | 41 | |
| %Winners: Single M | 37 | 38 | 38 | 40 | 40 | 41 | |
| %Winners: Single F | 55 | 56 | 62 | 63 | 63 | 71 | |
| Italy | Social Welfare Gain | 72.9 | 45.93 | 28.4 | 18.64 | -1.35 | -18.54 |
| Equality Gain | 0 | -3 | -3.06 | -2.97 | 0.13 | 3.16 | |
| Efficiency Gain | 72.9 | 48.93 | 31.46 | 21.61 | -1.48 | -21.70 | |
| %Winners | 56 | 58 | 58 | 57 | 53 | 52 | |
| %Winners: Couples | 51 | 49 | 44 | 42 | 38 | 36 | |
| %Winners: Single M | 59 | 66 | 69 | 70 | 63 | 61 | |
| %Winners: Single F | 58 | 63 | 65 | 65 | 64 | 63 | |
| Luxembourg | Social Welfare Gain | 2.06 | -35.63 | -68.35 | -62.63 | -67.54 | -66.94 |
| Equality Gain | 0 | -41.82 | -43.04 | -46.45 | -40.26 | -27.94 | |
| Efficiency Gain | 2.06 | 6.19 | -25.31 | -16.18 | -27.28 | -39.00 | |
| %Winners | 45 | 48 | 46 | 48 | 49 | 51 | |
| %Winners: Couples | 54 | 59 | 54 | 58 | 59 | 61 | |
| %Winners: Single M | 31 | 32 | 31 | 30 | 30 | 30 | |
| %Winners: Single F | 44 | 47 | 48 | 50 | 52 | 56 | |
| Spain | Social Welfare Gain | -16.99 | -13.87 | 10.65 | 13.83 | 21.35 | 27.17 |
| Equality Gain | 0 | 2.17 | 13.88 | 20.25 | 25.47 | 30.29 | |
| Efficiency Gain | -16.99 | -16.04 | -3.23 | -6.42 | -4.12 | -3.12 | |
| %Winners | 73 | 73 | 67 | 63 | 63 | 63 | |
| %Winners: Couples | 75 | 75 | 63 | 56 | 56 | 55 | |
| %Winners: Single M | 70 | 70 | 72 | 70 | 70 | 70 | |
| %Winners: Single F | 70 | 70 | 73 | 73 | 74 | 74 | |
| United Kingdom | Social Welfare Gain | -18.37 | 37.42 | 37.81 | 48.34 | 65.19 | 77.19 |
| Equality Gain | 0 | 0.81 | 1.14 | 1.24 | 0.64 | -0.17 | |
| Efficiency Gain | -18.37 | 36.61 | 36.67 | 47.10 | 64.55 | 77.36 | |
| %Winners: All | 42 | 76 | 77 | 79 | 81 | 82 | |
| %Winners: Couples | 23 | 79 | 82 | 84 | 88 | 90 | |
| %Winners: Single M | 57 | 64 | 64 | 65 | 66 | 68 | |
| %Winners: Single F | 64 | 82 | 83 | 83 | 83 | 82 |
Table 3
“Primitives” of the economy and characteristics of the optimal polynomial TTRs
| UBI | Leading Tax Rate | |
|---|---|---|
| Constant | 357.28 2.14 | -5.04 -0.3 |
| Kolm’s k | 25.44 14.01 | 1.40 9.95 |
| Productivity | 0.22 11.29 | 0.002 1.48 |
| Extensive Elasticity | 117.35 3.05 | 9.90 3.31 |
| Intensive Elasticity | 253.55 8.44 | 1.46 0.62 |
| Budget | -0.25 -8.08 | 0.002 -0.85 |
| R2 | 0.83 | 0.88 |
| Standard error of the estimate | 53.69 | 0.04 |
-
t-values in italics below the estimates.
-
Bold estimates are significant at standard levels.
Table A1
Maximum likelihood estimates – couples (France)
| Model component | Variable | Coef. | Std. Err. |
|---|---|---|---|
| Opportunity density | δ | ||
| Employee_Man | 0.4761696 | 0.3665576 | |
| Self-employed_Man | 0.2130577 | 0.3805561 | |
| Employee_Woman | -0.3649212 | 0.2853927 | |
| Self-employed_Woman | -1.426779 | 0.3241603 | |
| Part-time_Employee_Man | -0.3805255 | 0.2414433 | |
| Full-time_Employee_Man | 2.83453 | 0.1249029 | |
| Part-time_Self-employed_Man | -1.841048 | 0.324269 | |
| Full-time_Self-employed_Man | 0.2870089 | 0.1540075 | |
| Part-time_Employee_Woman | 0.6361778 | 0.2170085 | |
| Full-time_Employee_Woman | 2.698627 | 0.1676399 | |
| Part-time_Self-employed_Woman | -1.014395 | 0.3149686 | |
| Full-time_Self-employed_Woman | 0.6781008 | 0.2277644 | |
| Income | γ | ||
| Household_Disposable_income | 0.0003342 | 0.0001334 | |
| Hosuhold_Disposable_income squared | 1.61E-08 | 6.75E-09 | |
| Household_size X Household_disposable_income | -0.0000513 | 0.0000175 | |
| Leisure | λ | ||
| Leisure_Male | 0.1256514 | 0.0281893 | |
| Leisure_Man squared | 0.0000173 | 0.0001373 | |
| Leisure_Woman | 0.163189 | 0.0255661 | |
| Leisure_Woman squared | -0.000107 | 0.0001529 | |
| Leisure_Man X Household_disp_income | -7.88E-06 | 1.02E-06 | |
| Leisure_Woman X Household_disp_income | -1.54E-07 | 8.04E-07 | |
| Leisure_Man X Age_Man | -0.0059183 | 0.0011829 | |
| Leisure_Woman X Age_Woman | -0.0085386 | 0.0009848 | |
| Leisure_Man X Age_Man squared | 0.0000742 | 0.0000138 | |
| Leisure_Woman X Age_Woman squared | 0.0001108 | 0.000012 | |
| Leisure_Man X No. Children | -0.0026133 | 0.0017907 | |
| Leisure_Woman X No. Children | 0.0084813 | 0.0015617 | |
| Leisure_Man X No. Children0-6 | 0.0027957 | 0.0025747 | |
| Leisure_Man X No. Children7-10 | 0.006507 | 0.0027523 | |
| Leisure_Woman X No. Children0-6 | 0.006981 | 0.0021144 | |
| Leisure_Woman X No. Children7-10 | 0.0007436 | 0.002288 | |
| Leisure_Woman X Leisure_Man | 0.0001134 | 0.0000948 | |
| N.observations (N. couples*49 alternatives) | 195804 | ||
| N.couples | 3996 | ||
| LR chi2(32) | 15140.15 | ||
| Prob > chi2 | 0 | ||
| Pseudo R2 | 0.4868 | ||
| Log likelihood | -7981.6412 |
Table A2
Maximum likelihood estimates – singles (France)
| Male | Female | ||||
|---|---|---|---|---|---|
| Model component | Variable | Coef. | Std. Err. | Coef. | Std. Err. |
| Opportunity density | δ | δ | |||
| Employee | 0.199478 | 0.533068 | -1.19744 | 0.470041 | |
| Self_employed | -0.21333 | 0.593638 | -1.68397 | 0.553979 | |
| Part-time_Employee | -0.69588 | 0.393698 | 1.256628 | 0.352174 | |
| Full-time_Employee | 2.213382 | 0.253926 | 2.994315 | 0.267448 | |
| Part-time_Self-employed | -2.70132 | 0.585303 | -1.80785 | 0.627849 | |
| Full-time_Self-employed | -0.28412 | 0.336337 | 0.368914 | 0.377033 | |
| Income | λ | λ | |||
| Disposable income | -0.00012 | 0.00024 | 7.55E-05 | 0.000379 | |
| Disposable income squared | 4.53E-08 | 2.07E-08 | 6.64E-08 | 4.13E-08 | |
| Household size X Disp_income | -5.6E-05 | 4.62E-05 | -6.7E-05 | 6.84E-05 | |
| Leisure | λ | λ | |||
| Leisure | 0.129227 | 0.029882 | 0.15447 | 0.034747 | |
| Leisure2 | -8.1E-05 | 0.000239 | -9.2E-05 | 0.000254 | |
| Leisure X Disposable income | 1.01E-06 | 2.34E-06 | 6.43E-07 | 3.40E-06 | |
| Leisure X Age | -0.00516 | 0.000963 | -0.0075 | 0.001086 | |
| Leisure X Age squared | 6.36E-05 | 1.21E-05 | 0.000092 | 1.34E-05 | |
| Leisure X No. Children | -0.01374 | 0.005121 | 0.006768 | 0.003433 | |
| Leisure X No. Children 0-6 | -0.00814 | 0.019875 | 0.015925 | 0.00544 | |
| Leisure X No. Children 7-10 | 0.011728 | 0.010413 | 0.008727 | 0.004892 | |
| Other | |||||
| N.observations (N. single*7 alternatives) | 9331 | 10465 | |||
| N.single | 1333 | 1495 | |||
| LR chi2(17) | 2318.15 | 2657.35 | |||
| Prob > chi2 | 0 | 0 | |||
| Pseudo R2 | 0.4468 | 0.4567 | |||
| Log likelihood | -1434.83 | -1580.46 | |||
Table A3
Maximum likelihood estimates – couples (Germany)
| Model component | Variable | Coef. | Std. Err. |
|---|---|---|---|
| Opportunity density | δ | ||
| Employee_Man | -0.5269339 | 0.435726 | |
| Self-employed_Man | -1.611115 | 0.4373339 | |
| Employee_Woman | -1.560942 | 0.2543809 | |
| Self-employed_Woman | -3.580387 | 0.3637122 | |
| Part-time_Employee_Man | -0.9591195 | 0.2591677 | |
| Full-time_Employee_Man | 2.516702 | 0.1205793 | |
| Part-time_Self-employed_Man | -1.797576 | 0.3673868 | |
| Full-time_Self-employed_Man | 0.940684 | 0.1597094 | |
| Part-time_Employee_Woman | 1.829915 | 0.2318468 | |
| Full-time_Employee_Woman | 2.531309 | 0.1913391 | |
| Part-time_Self-employed_Woman | 0.8422771 | 0.341443 | |
| Full-time_Self-employed_Woman | 1.067966 | 0.2761494 | |
| Income | γ | ||
| Household_Disposable_income | 0.001699 | 0.0001136 | |
| Hosuhold_Disposable_income squared | -5.60E-08 | 5.58E-09 | |
| Household_size X Household_disposable_income | 0.0000479 | 0.0000222 | |
| Leisure | λ | ||
| Leisure_Male | 0.184064 | 0.0264439 | |
| Leisure_Man squared | -0.0004684 | 0.0002088 | |
| Leisure_Woman | 0.2376265 | 0.0251642 | |
| Leisure_Woman squared | -0.0011735 | 0.00014 | |
| Leisure_Man X Household_disp_income | -1.38E-05 | 7.25E-07 | |
| Leisure_Woman X Household_disp_income | -9.65E-06 | 5.79E-07 | |
| Leisure_Man X Age_Man | -0.0030924 | 0.0009326 | |
| Leisure_Woman X Age_Woman | -0.0046903 | 0.0009542 | |
| Leisure_Man X Age_Man squared | 0.0000357 | 0.0000106 | |
| Leisure_Woman X Age_Woman squared | 0.0000713 | 0.0000112 | |
| Leisure_Man X No. Children | -0.0017621 | 0.0019208 | |
| Leisure_Woman X No. Children | 0.0231159 | 0.0016417 | |
| Leisure_Man X No. Children0-6 | 0.0184762 | 0.0025177 | |
| Leisure_Man X No. Children7-10 | -0.0007047 | 0.0032015 | |
| Leisure_Woman X No. Children0-6 | 0.01427 | 0.0025455 | |
| Leisure_Woman X No. Children7-10 | 0.0037864 | 0.0026824 | |
| Leisure_Woman X Leisure_Man | -0.0003689 | 0.0000744 | |
| Other | |||
| N.observations (N. couples*49 alternatives) | 201,243 | ||
| N.couples | 4107 | ||
| LR chi2(32) | 14394.76 | ||
| Prob > chi2 | 0 | ||
| Pseudo R2 | 0.4503 | ||
| Log likelihood | -8786.3249 |
Table A4
Maximum likelihood estimates – singles (Germany)
| Male | Female | ||||
|---|---|---|---|---|---|
| Model component | Variable | Coef. | Std. Err. | Coef. | Std. Err. |
| Opportunity density | δ | δ | |||
| Employee | -0.80193 | 0.57248 | -1.43637 | 0.446197 | |
| Self_employed | 0.179376 | 0.597029 | -8.15099 | 0.661612 | |
| Part-time_Employee | -0.32109 | 0.406771 | 0.579569 | 0.34354 | |
| Full-time_Employee | 2.865958 | 0.240845 | 2.703306 | 0.249755 | |
| Part-time_Self-employed | -2.54205 | 0.498362 | 4.688473 | 0.595456 | |
| Full-time_Self-employed | 0.184833 | 0.295293 | 4.011293 | 0.42799 | |
| Income | γ | γ | |||
| Disposable income | 0.003328 | 0.000448 | 0.003246 | 0.000196 | |
| Disposable income squared | -7.89E-07 | 7.78E-08 | -1.49E-07 | 1.28E-08 | |
| Household size X Disp_income | 6.42E-04 | 1.93E-04 | 8.93E-05 | 3.80E-05 | |
| Leisure | λ | λ | |||
| Leisure | 0.241596 | 0.03538 | 0.281701 | 0.033209 | |
| Leisure2 | -0.00076 | 0.000296 | -0.00141 | 0.000258 | |
| Leisure X Disposable income | -4.42E-05 | 2.40E-06 | -3.86E-05 | 2.08E-06 | |
| Leisure X Age | -0.00382 | 0.001035 | -0.00337 | 0.001006 | |
| Leisure X Age squared | 5.09E-05 | 1.24E-05 | 4.29E-05 | 1.20E-05 | |
| Leisure X No. Children | -0.02709 | 0.012505 | 0.014031 | 0.003459 | |
| Leisure X No. Children 0-6 | 0.038387 | 0.020631 | 0.0287 | 0.007638 | |
| Leisure X No. Children 7-10 | 0.016741 | 0.021338 | 0.017555 | 0.006452 | |
| Other | |||||
| N.observations (N. single*7 alternatives) | 10,283 | 12,551 | |||
| N.single | 1469 | 1793 | |||
| LR chi2(17) | 2983.13 | 3608.3 | |||
| Prob > chi2 | 0 | 0 | |||
| Pseudo R2 | 0.5218 | 0.5171 | |||
| Log likelihood | -1366.98 | -1684.87 | |||
Table A5
Maximum likelihood estimates – couples (Italy)
| Model component | Variable | Coef. | Std. Err. |
|---|---|---|---|
| Opportunity density | δ | ||
| Employee_Man | -2.227042 | 0.3359151 | |
| Self-employed_Man | -1.793772 | 0.3327547 | |
| Employee_Woman | -4.205803 | 0.3711781 | |
| Self-employed_Woman | -3.159583 | 0.3091701 | |
| Part-time_Employee_Man | 1.810835 | 0.2235256 | |
| Full-time_Employee_Man | 3.457804 | 0.1466732 | |
| Part-time_Self-employed_Man | -1.142189 | 0.2861769 | |
| Full-time_Self-employed_Man | 1.827801 | 0.1352579 | |
| Part-time_Employee_Woman | 3.522802 | 0.3488772 | |
| Full-time_Employee_Woman | 4.233018 | 0.3257372 | |
| Part-time_Self-employed_Woman | 0.2200945 | 0.3028192 | |
| Full-time_Self-employed_Woman | 1.989132 | 0.2580389 | |
| Income | γ | ||
| Household_Disposable_income | 0.0005129 | 0.0001534 | |
| Hosuhold_Disposable_income squared | 1.36E-08 | 7.25E-09 | |
| Household_size X Household_disposable_income | -0.0001608 | 0.0000251 | |
| Leisure | λ | ||
| Leisure_Male | 0.0030689 | 0.05153 | |
| Leisure_Man squared | -0.0000926 | 0.0001607 | |
| Leisure_Woman | 0.2598116 | 0.0365898 | |
| Leisure_Woman squared | -0.000653 | 0.0001763 | |
| Leisure_Man X Household_disp_income | 4.38E-06 | 1.43E-06 | |
| Leisure_Woman X Household_disp_income | -5.81E-07 | 1.01E-06 | |
| Leisure_Man X Age_Man | -0.0015349 | 0.0025113 | |
| Leisure_Woman X Age_Woman | -0.0097254 | 0.0016741 | |
| Leisure_Man X Age_Man squared | 0.0000135 | 0.0000318 | |
| Leisure_Woman X Age_Woman squared | 0.0001141 | 0.0000223 | |
| Leisure_Man X No. Children | -0.0081218 | 0.0022336 | |
| Leisure_Woman X No. Children | 0.0078869 | 0.0017578 | |
| Leisure_Man X No. Children0-6 | 0.0076125 | 0.0026554 | |
| Leisure_Man X No. Children7-10 | 0.0002707 | 0.0028172 | |
| Leisure_Woman X No. Children0-6 | -0.0054445 | 0.0020634 | |
| Leisure_Woman X No. Children7-10 | -0.0009139 | 0.0020886 | |
| Leisure_Woman X Leisure_Man | 0.0003854 | 0.0000964 | |
| Other | |||
| N.observations (N. couples*49 alternatives) | 188405 | ||
| N.couples | 3845 | ||
| LR chi2(32) | 10209.91 | ||
| Prob > chi2 | 0 | ||
| Pseudo R2 | 0.3411 | ||
| Log likelihood | -9859.09 |
Table A6
Maximum likelihood estimates – singles (Italy)
| Male | Female | ||||
|---|---|---|---|---|---|
| Model component | Variable | Coef. | Std. Err. | Coef. | Std. Err. |
| Opportunity density | δ | δ | |||
| Employee | -1.22117 | 0.331639 | -3.43019 | 0.3787 | |
| Self_employed | -0.47643 | 0.315555 | -2.81075 | 0.350903 | |
| Part-time_Employee | 1.263827 | 0.268794 | 3.554593 | 0.34008 | |
| Full-time_Employee | 3.310487 | 0.207522 | 4.654217 | 0.303264 | |
| Part-time_Self-employed | -2.2652 | 0.32631 | 0.618142 | 0.341357 | |
| Full-time_Self-employed | 1.473456 | 0.180946 | 2.786139 | 0.266647 | |
| Income | γ | γ | |||
| Disposable income | 0.000114 | 0.000145 | 0.0003 | 0.000255 | |
| Disposable income squared | 5.12E-09 | 1.08E-08 | 6.55E-09 | 3.11E-08 | |
| Household size X Disp_income | -5.5E-05 | 4.01E-05 | -0.00011 | 4.77E-05 | |
| Leisure | λ | λ | |||
| Leisure | 0.280595 | 0.024332 | 0.312801 | 0.030346 | |
| Leisure2 | 0.000164 | 0.000173 | 0.000428 | 0.000198 | |
| Leisure X Disposable income | 1.36E-06 | 1.55E-06 | -1.91E-07 | 2.59E-06 | |
| Leisure X Age | -0.01438 | 0.001037 | -0.01841 | 0.001297 | |
| Leisure X Age squared | 0.000176 | 1.51E-05 | 0.000225 | 1.84E-05 | |
| Leisure X No. Children | -0.0191 | 0.01175 | 0.005966 | 0.003381 | |
| Leisure X No. Children 0-6 | 0.007813 | 0.020605 | 0.00305 | 0.005703 | |
| Leisure X No. Children 7-10 | 0.011513 | 0.022161 | -0.00433 | 0.005772 | |
| Other | |||||
| N.observations (N. single*7 alternatives) | 22190 | 18270 | |||
| N.single | 3170 | 2610 | |||
| LR chi2(17) | 4055.02 | 3501.41 | |||
| Prob > chi2 | 0 | 0 | |||
| Pseudo R2 | 0.3287 | 0.3447 | |||
| Log likelihood | -4141.03 | -3328.12 | |||
Table A7
Maximum likelihood estimates – couples (Luxembourg)
| Model component | Variable | Coef. | Std. Err. |
|---|---|---|---|
| Opportunity density | δ | ||
| Employee_Man | 2.798179 | 1.230943 | |
| Self-employed_Man | 1.196799 | 1.218041 | |
| Employee_Woman | -1.670879 | 0.4877308 | |
| Self-employed_Woman | -3.273727 | 0.5811094 | |
| Part-time_Employee_Man | -0.9321119 | 0.5778732 | |
| Full-time_Employee_Man | 2.740097 | 0.2477136 | |
| Part-time_Self-employed_Man | -3.276221 | 1.176261 | |
| Full-time_Self-employed_Man | 0.3923308 | 0.4062014 | |
| Part-time_Employee_Woman | 2.251194 | 0.381928 | |
| Full-time_Employee_Woman | 3.024338 | 0.2864887 | |
| Part-time_Self-employed_Woman | -0.0916981 | 0.6417357 | |
| Full-time_Self-employed_Woman | 0.9017009 | 0.4806236 | |
| Income | γ | ||
| Household_Disposable_income | 0.0001153 | 0.0001343 | |
| Hosuhold_Disposable_income squared | -2.43E-09 | 2.07E-09 | |
| Household_size×Household_disposable_income | -1.63E-06 | 0.000023 | |
| Leisure | λ | ||
| Leisure_Male | -0.0472945 | 0.0551945 | |
| Leisure_Man squared | 0.0014071 | 0.0004473 | |
| Leisure_Woman | 0.0416601 | 0.0425495 | |
| Leisure_Woman squared | 0.0003121 | 0.0002634 | |
| Leisure_Man X Household_disp_income | 1.64E-06 | 8.45E-07 | |
| Leisure_Woman X Household_disp_income | 1.18E-07 | 8.47E-07 | |
| Leisure_Man X Age_Man | -0.0038039 | 0.0021464 | |
| Leisure_Woman X Age_Woman | -0.0059885 | 0.0016256 | |
| Leisure_Man X Age_Man squared | 0.0000479 | 0.0000254 | |
| Leisure_Woman X Age_Woman squared | 0.0000904 | 0.0000201 | |
| Leisure_Man X No. Children | -0.0067684 | 0.0038964 | |
| Leisure_Woman X No. Children | 0.0069002 | 0.0027455 | |
| Leisure_Man X No. Children0-6 | 0.0085339 | 0.0051382 | |
| Leisure_Man X No. Children7-10 | 0.002834 | 0.0060786 | |
| Leisure_Woman X No. Children0-6 | 0.0088988 | 0.0034797 | |
| Leisure_Woman X No. Children7-10 | 0.0022974 | 0.0039516 | |
| Leisure_Woman X Leisure_Man | 0.0002931 | 0.0001535 | |
| Other | |||
| N.observations (N. couples*49 alternatives) | 64435 | ||
| N.couples | 1315 | ||
| LR chi2(32) | 5058.95 | ||
| Prob > chi2 | 0 | ||
| Pseudo R2 | 0.4943 | ||
| Log likelihood | -2588.2705 |
Table A8
Maximum likelihood estimates – singles (Luxembourg)
| Male | Female | ||||
|---|---|---|---|---|---|
| Model component | Variable | Coef. | Std. Err. | Coef. | Std. Err. |
| Opportunity density | δ | δ | |||
| Employee | 3.840025 | 1.467676 | -3.83547 | 0.916069 | |
| Self_employed | 3.076828 | 1.44261 | -6.09075 | 1.124339 | |
| Part-time_Employee | -1.25405 | 0.727917 | 3.214104 | 0.688409 | |
| Full-time_Employee | 2.760224 | 0.389481 | 3.833989 | 0.508304 | |
| Part-time_Self-employed | -17.2776 | 699.2763 | 2.533271 | 1.111393 | |
| Full-time_Self-employed | 0.139062 | 0.585945 | 2.068577 | 0.878229 | |
| Income | γ | γ | |||
| Disposable income | 3.53E-05 | 0.000416 | 0.00036 | 0.000262 | |
| Disposable income squared | -8.96E-09 | 2.75E-08 | -8.71E-09 | 9.30E-09 | |
| Household size X Disp_income | 0.000177 | 0.000082 | -4.1E-05 | 5.76E-05 | |
| Leisure | λ | λ | |||
| Leisure | 0.083226 | 0.061447 | 0.222152 | 0.066109 | |
| Leisure2 | 0.00187 | 0.000632 | -0.00012 | 0.000504 | |
| Leisure X Disposable income | 2.07E-07 | 3.91E-06 | 3.42E-06 | 2.72E-06 | |
| Leisure X Age | -0.0096 | 0.001664 | -0.01311 | 0.00192 | |
| Leisure X Age squared | 0.000118 | 0.000021 | 0.00016 | 2.33E-05 | |
| Leisure X No. Children | 0.010493 | 0.008464 | 0.002518 | 0.005455 | |
| Leisure X No. Children 0-6 | 0.006816 | 0.029223 | 0.00331 | 0.010569 | |
| Leisure X No. Children 7-10 | 0.024772 | 0.029139 | -0.0027 | 0.009811 | |
| Other | |||||
| N.observations (N. single*7 alternatives) | 4123 | 3640 | |||
| N.single | 589 | 520 | |||
| LR chi2(17) | 1157.65 | 951.82 | |||
| Prob > chi2 | 0 | 0 | |||
| Pseudo R2 | 0.505 | 4703 | |||
| Log likelihood | -567.317 | 5335.965 | |||
Table A9
Maximum likelihood estimates – couples (Spain)
| Model component | Variable | Coef. | Std. Err. |
|---|---|---|---|
| Opportunity density | δ | ||
| Employee_Man | -0.2868366 | 0.2843099 | |
| Self-employed_Man | -0.7698504 | 0.2931603 | |
| Employee_Woman | -2.403139 | 0.252017 | |
| Self-employed_Woman | -2.585398 | 0.2813223 | |
| Part-time_Employee_Man | -0.1938884 | 0.1981381 | |
| Full-time_Employee_Man | 2.390778 | 0.1070763 | |
| Part-time_Self-employed_Man | -1.089852 | 0.2490981 | |
| Full-time_Self-employed_Man | 0.9119172 | 0.1280802 | |
| Part-time_Employee_Woman | 1.511822 | 0.2167088 | |
| Full-time_Employee_Woman | 2.692898 | 0.1672168 | |
| Part-time_Self-employed_Woman | -0.3884766 | 0.2749832 | |
| Full-time_Self-employed_Woman | 0.8462308 | 0.2033327 | |
| Income | γ | ||
| Household_Disposable_income | -0.0001841 | 0.0001271 | |
| Hosuhold_Disposable_income squared | 2.51E-08 | 8.12E-09 | |
| Household_size×Household_disposable_income | -0.0000236 | 0.0000156 | |
| Leisure | λ | ||
| Leisure_Male | -0.0294838 | 0.0239608 | |
| Leisure_Man squared | 0.0005993 | 0.0001227 | |
| Leisure_Woman | 0.0991669 | 0.0229826 | |
| Leisure_Woman squared | -0.0003914 | 0.0001435 | |
| Leisure_Man X Household_disp_income | 5.62E-06 | 9.76E-07 | |
| Leisure_Woman X Household_disp_income | 1.22E-06 | 7.46E-07 | |
| Leisure_Man X Age_Man | -0.0022498 | 0.0009384 | |
| Leisure_Woman X Age_Woman | -0.0043625 | 0.0007961 | |
| Leisure_Man X Age_Man squared | 0.0000224 | 0.0000103 | |
| Leisure_Woman X Age_Woman squared | 0.0000589 | 9.11E-06 | |
| Leisure_Man X No. Children | -0.0015521 | 0.0013717 | |
| Leisure_Woman X No. Children | 0.0036569 | 0.0011625 | |
| Leisure_Man X No. Children0-6 | 0.0034279 | 0.0019022 | |
| Leisure_Man X No. Children7-10 | -0.0022426 | 0.0020741 | |
| Leisure_Woman X No. Children0-6 | 0.0013244 | 0.0016922 | |
| Leisure_Woman X No. Children7-10 | 0.0020022 | 0.0017517 | |
| Leisure_Woman X Leisure_Man | 0.00032 | 0.0000585 | |
| Other | |||
| N.observations (N. couples*49 alternatives) | 244755 | ||
| N.couples | 4995 | ||
| LR chi2(32) | 13049.94 | ||
| Prob > chi2 | 0 | ||
| Pseudo R2 | 0.3357 | ||
| Log likelihood | -12914.672 |
Table A10
Maximum likelihood estimates – singles (Spain)
| Male | Female | ||||
|---|---|---|---|---|---|
| Model component | Variable | Coef. | Std. Err. | Coef. | Std. Err. |
| Opportunity density | δ | δ | |||
| Employee | -1.30198 | 0.428921 | -1.7268 | 0.428239 | |
| Self_employed | -1.41084 | 0.456916 | -1.59374 | 0.505891 | |
| Part-time_Employee | 0.607968 | 0.329195 | 1.895538 | 0.346785 | |
| Full-time_Employee | 2.496161 | 0.217392 | 3.236458 | 0.246681 | |
| Part-time_Self-employed | -1.10093 | 0.419394 | -0.78624 | 0.512791 | |
| Full-time_Self-employed | 0.757978 | 0.25528 | 1.336878 | 0.331166 | |
| Income | γ | γ | |||
| Disposable income | 0.000391 | 0.000202 | 0.000249 | 0.000234 | |
| Disposable income squared | -2.86E-08 | 2.19E-08 | -4.02E-09 | 2.89E-08 | |
| Household size X Disp_income | 3.35E-05 | 4.41E-05 | 0.000166 | 5.63E-05 | |
| Leisure | λ | λ | |||
| Leisure | 0.091073 | 0.027093 | 0.060002 | 0.028202 | |
| Leisure2 | 7.25E-05 | 0.000216 | 0.000661 | 0.000213 | |
| Leisure X Disposable income | 2.92E-08 | 2.03E-06 | 2.06E-06 | 2.36E-06 | |
| Leisure X Age | -0.00465 | 0.000802 | -0.00588 | 0.000853 | |
| Leisure X Age squared | 5.79E-05 | 9.77E-06 | 6.94E-05 | 1.02E-05 | |
| Leisure X No. Children | 0.002815 | 0.0077 | 0.005045 | 0.002922 | |
| Leisure X No. Children 0-6 | -0.00077 | 0.015847 | 0.004662 | 0.006085 | |
| Leisure X No. Children 7-10 | -0.01601 | 0.021244 | 0.00168 | 0.005529 | |
| Other | |||||
| N.observations (N. single*7 alternatives) | 12530 | 12194 | |||
| N.single | 1790 | 1742 | |||
| LR chi2(17) | 2335.29 | 2421.22 | |||
| Prob > chi2 | 0 | 0 | |||
| Pseudo R2 | 0.3352 | 0.3571 | |||
| Log likelihood | -2315.53 | -2179.16 | |||
Table A11
Maximum likelihood estimates – couples (UK)
| Model component | Variable | Coef. | Std. Err. |
|---|---|---|---|
| Opportunity density | δ | ||
| Employee_Man | 0.1010326 | 0.3378421 | |
| Self-employed_Man | -0.6931103 | 0.3433464 | |
| Employee_Woman | -2.125809 | 0.2756313 | |
| Self-employed_Woman | -2.693189 | 0.3039796 | |
| Part-time_Employee_Man | -1.045434 | 0.2048579 | |
| Full-time_Employee_Man | 2.390656 | 0.1114932 | |
| Part-time_Self-employed_Man | -1.088571 | 0.24735 | |
| Full-time_Self-employed_Man | 1.330872 | 0.1382285 | |
| Part-time_Employee_Woman | 1.85452 | 0.2366666 | |
| Full-time_Employee_Woman | 2.886648 | 0.2010856 | |
| Part-time_Self-employed_Woman | 0.3428018 | 0.2863139 | |
| Full-time_Self-employed_Woman | 0.6378565 | 0.2530663 | |
| Income | γ | ||
| Household_Disposable_income | 0.0001122 | 0.0002534 | |
| Hosuhold_Disposable_income squared | -3.40E-08 | 1.75E-08 | |
| Household_size X Household_disposable_income | 0.0000397 | 0.000025 | |
| Leisure | λ | ||
| Leisure_Male | 0.0426497 | 0.0280003 | |
| Leisure_Man squared | 0.0004884 | 0.0001547 | |
| Leisure_Woman | 0.1642487 | 0.0289328 | |
| Leisure_Woman squared | -0.0006741 | 0.0001594 | |
| Leisure_Man X Household_disp_income | 9.12E-07 | 1.76E-06 | |
| Leisure_Woman X Household_disp_income | -7.02E-07 | 1.45E-06 | |
| Leisure_Man X Age_Man | -0.006004 | 0.0012687 | |
| Leisure_Woman X Age_Woman | -0.0071774 | 0.0013197 | |
| Leisure_Man X Age_Man squared | 0.0000731 | 0.0000171 | |
| Leisure_Woman X Age_Woman squared | 0.0000904 | 0.0000183 | |
| Leisure_Man X No. Children | 0.0023683 | 0.0016979 | |
| Leisure_Woman X No. Children | 0.0169523 | 0.0016992 | |
| Leisure_Man X No. Children0-6 | -0.0029332 | 0.0017903 | |
| Leisure_Man X No. Children7-10 | 0.0008209 | 0.001984 | |
| Leisure_Woman X No. Children0-6 | 0.0142435 | 0.0019016 | |
| Leisure_Woman X No. Children7-10 | 0.0034794 | 0.0020909 | |
| Leisure_Woman X Leisure_Man | 0.0006758 | 0.0000828 | |
| Other | |||
| N.observations (N. couples*49 alternatives) | 220843 | ||
| N.couples | 4507 | ||
| LR chi2(32) | 12926.1 | ||
| Prob > chi2 | 0 | ||
| Pseudo R2 | 0.3685 | ||
| Log likelihood | -11077.385 |
Table A12
Maximum likelihood estimates – singles (UK)
| Male | Female | ||||
|---|---|---|---|---|---|
| Model component | Variable | Coef. | Std. Err. | Coef. | Std. Err. |
| Opportunity density | δ | δ | |||
| Employee | -0.23213 | 0.467104 | -2.73527 | 0.381373 | |
| Self_employed | -0.73375 | 0.479139 | -3.96636 | 0.455567 | |
| Part-time_Employee | -0.48835 | 0.315075 | 2.234354 | 0.311484 | |
| Full-time_Employee | 2.423602 | 0.215381 | 3.217563 | 0.257497 | |
| Part-time_Self-employed | -1.83573 | 0.404768 | 1.149457 | 0.429612 | |
| Full-time_Self-employed | 0.850365 | 0.26129 | 1.745809 | 0.371801 | |
| Income | γ | γ | |||
| Disposable income | -8.1E-05 | 0.000262 | 0.001196 | 0.000448 | |
| Disposable income squared | 1.29E-08 | 3.04E-08 | -1.33E-07 | 6.24E-08 | |
| Household size X Disp_income | 1.13E-05 | 5.03E-05 | -1.9E-05 | 6.18E-05 | |
| Leisure | λ | λ | |||
| Leisure | 0.122021 | 0.027423 | 0.248225 | 0.030925 | |
| Leisure2 | 0.00039 | 0.000239 | -0.00026 | 0.00022 | |
| Leisure X Disposable income | 1.27E-06 | 2.44E-06 | -9.32E-06 | 4.05E-06 | |
| Leisure X Age | -0.0075 | 0.001001 | -0.01234 | 0.00121 | |
| Leisure X Age squared | 0.000102 | 1.47E-05 | 0.000166 | 1.74E-05 | |
| Leisure X No. Children | -0.00517 | 0.005611 | 0.015035 | 0.002616 | |
| Leisure X No. Children 0-6 | 0.020995 | 0.012061 | 0.026352 | 0.003583 | |
| Leisure X No. Children 7-10 | 0.013849 | 0.010819 | 0.004335 | 0.003571 | |
| Other | |||||
| N.observations (N. single*7 alternatives) | 13937 | 17549 | |||
| N.single | 1991 | 2507 | |||
| LR chi2(17) | 2736.7 | 3775.11 | |||
| Prob > chi2 | 0 | 0 | |||
| Pseudo R2 | 0.3532 | 0.3869 | |||
| Log likelihood | -2505.96 | -2990.84 | |||
Data and code availability
Please contact the authors for information on data and code availability.
Download links
A two-part list of links to download the article, or parts of the article, in various formats.