Homeownership Investment and Tax Neutrality: a Joint Assessment of Income and Property Taxes in Europe
- Herman Deleeck Centre for Social Policy, University of Antwerp, Belgium
Figures

Effective Marginal Tax Rates for homeownership and financial investment.. Source: Own calculations on the basis of EU-SILC/FRS and EUROMOD.

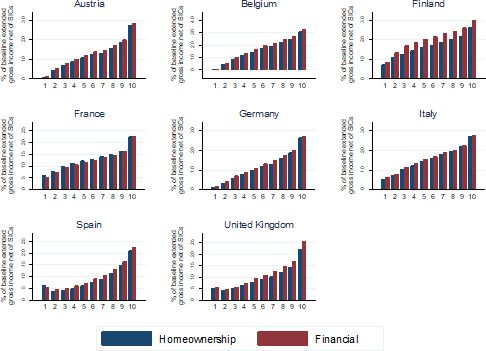
Average tax rates for homeownership and financialinvestment.. Source: Own calculations on the basis of EU-SILC/FRS and EUROMOD.
Tables
Income Taxation of investment returns, by investment type, 2012.
| Owner-occupied housing | Financial | Personal income tax | ||
|---|---|---|---|---|
| Tax on return | Mortgage Interest tax relief | Tax rate on return | Top marginal rate | |
| Austria | Exempt from PIT | YES, low amount allowed for low incomes | 20% | 50% |
| Belgium | Exempt from PIT | YES | 15% | 50% |
| Finland | Exempt from PIT | YES | Progressive with rate equal to 30% and 32% | 29.75% |
| France | Exempt from PIT | NO – abolished in 2010 (tax credit maintained for second properties) | 39% & 32% | 45% |
| Germany | Exempt from PIT | NO | PIT with deduction | 45% |
| Italy | Exempt from PIT | YES, with high limits | 12.5% | 43% |
| Spain | Exempt from PIT | Mortgage tax credit removed since 2012 (still compensation for house acquired before 2006). | 21% & 25% | 30.5% |
| United Kingdom | Exempt from PIT | NO (after lengthy phasing-out), maintained on other taxed properties. | 10% | 50% |
-
Source: Taxes in Europe database.
Property taxation on owner-occupied housing, 2012.
| Recurrent Taxation | Revenues (as % of GDP) | Latest values assessment | ||
|---|---|---|---|---|
| Austria | Real Estate Tax: federal and municipal rate on standard value of the property | 0.2 | 1973 | |
| Belgium | Real Estate Tax: regional and municipal rate on Cadastral Income | 1.22 | 1975 | |
| Finland | Real Estate Tax: municipal rate on taxable value of the property | 0.64 | 2011 | |
| France | Real Estate Tax: municipal rate on Cadastral Income | 1.33 | 1978 | |
| Germany | Real Estate Tax: federal and municipal rate on standard value of the property | 0.45 | 1964 | |
| Italy | Real Estate Tax: municipal rate on Cadastral Income | 1.51 | 1988 | |
| Spain | Real Estate Tax: municipal rate on Cadastral Income. | 1.09 | 1994 | |
| United Kingdom | NO | - | - | |
-
Source: Taxes in Europe database except in the case of Italy (official national tax revenues data).
Homeownership rates, 2010.
| Owned on mortgage | Owned outright | Total | |
|---|---|---|---|
| AT | 25.4 | 32.1 | 57.5 |
| BE | 41.6 | 30.2 | 71.8 |
| FI | 42.0 | 32.3 | 74.3 |
| ES | 33.2 | 46.7 | 79.9 |
| FR | 28.9 | 33.3 | 62.2 |
| DE | 27.8 | 25.5 | 53.3 |
| IT | 15.4 | 56.5 | 71.9 |
| UK | 41.3 | 27.7 | 69.0 |
-
Source: Own calculations on the basis of EU-SILC/FRS.
Budgetary size of homeownership bias, components and total, in % of counterfactual tax revenue, and absolute amount.
| Exempting IR (1) | MITRs (2) | Property tax on main residence (3) | Total homeownership bias (1)+(2)+(3) | Absolute amount (million € per year) | |
|---|---|---|---|---|---|
| As % of counterfactual tax revenuea | |||||
| AT | -6.35 | - - - | - - - | -6.35 | -1,906.2 |
| BE | -6.06 | -5.61 | 2.78 | -8.89 | -4,077.6 |
| FI | -17.90 | -0.16 | 1.10 | -16.96 | -5,178.2 |
| ES | -19.99 | -3.86 | 13.16 | -10.69 | -8,046.4 |
| FR | -5.23 | - - - | 7.20 | 1.98 | 3,776.1 |
| DE | -9.28 | - - - | 2.27 | -7.01 | -18,945.0 |
| IT | -5.2 | -0.78 | 2.21 | -3.78 | -7,403.8 |
| UK | -14.60 | - - - | - - - | -14.60 | -23,444.3 |
-
Notes a:Tax revenues corresponds to the sum of final personal income and property tax. Tax provision abolished in countries where existed. A negative (positive) amount represents a revenue loss (gain). The ‘- - -'‘ sign indicates no such policy exists in the country (or, as in the case of property tax in Austria, it is negligible in size)
-
Source: Own calculations on the basis of EU-SILC/FRS.
Progressivity of income taxes and property taxes, homeownership and financial investment.
| Baseline scenario: Taxation under actual homeownership investment rules | Alternative scenario: homeownership investment is taxed as financial investment | ||||
|---|---|---|---|---|---|
| Total | Components | Total | Components | ||
| Austria | Total taxes | 0.289 | 0.268 | ||
| Property tax | - | - | |||
| Income taxes | 0.289 | 0.268 | |||
| Belgium | Total taxes | 0.269 | 0.248 | ||
| Property tax | 0.049 | - | |||
| Income taxes | 0.279 | 0.248 | |||
| Finland | Total taxes | 0.162 | 0.133 | ||
| Property tax | 0.055 | - | |||
| Income taxes | 0.165 | 0.133 | |||
| France | Total taxes | 0.182 | 0.193 | ||
| Property tax | 0.044 | - | |||
| Income taxes | 0.194 | 0.193 | |||
| Germany | Total taxes | 0.290 | 0.271 | ||
| Property tax | 0.092 | . | |||
| Income taxes | 0.298 | 0.271 | |||
| Italy | Total taxes | 0.191 | 0.179 | ||
| Property tax | 0.019 | - | |||
| Income taxes | 0.196 | 0.179 | |||
| Spain | Total taxes | 0.261 | 0.253 | ||
| Property tax | -0.125 | - | |||
| Income taxes | 0.343 | 0.253 | |||
| UK | Total taxes | 0.263 | 0.262 | ||
| Property tax | - | - | |||
| Income taxes | 0.263 | 0.262 | |||
-
Source: Own calculations on the basis of EU-SILC/FRS and EUROMOD.
-
Notes: In the index computation, pre-tax income is extended original income (i.e. including imputed rent) plus benefits.
Data and code availability
The results presented here are based on EUROMOD version G1.0+. Originally maintained, developed and managed by the Institute for Social and Economic Research (ISER), since 2021 these responsibilities are taken over by the Joint Research Centre (JRC) of the European Commission, in collaboration with EUROSTAT and national teams from the EU countries. We make use of microdata from the EU Statistics on Incomes and Living Conditions (EU-SILC 2010) made available by Eurostat (59/2013-EU-SILC-LFS); the national EU-SILC PDB data for Spain, Italy, Austria made available by respective national statistical offices; and the Family Resources Survey (2012) for the UK made available by the Department of Work and Pensions via the UK Data Service.