The Development of a Microsimulation Model (MitoMOD) to Estimate the Economic Impact of Mitochondrial Disease in Adults
- Centre for Economic Impacts of Genomic Medicine, Macquarie Business School, Australia
- Kolling Institute, Royal North Shore Hospital, Australia
- National Centre for Social and Economic Modelling (NATSEM), Australia
Abstract
Mitochondrial diseases (MITO) are serious and debilitating conditions, often multisystemic and requiring life-long monitoring and treatment of symptoms to reduce the risk of a life-threatening episode or acute illness. The disease is caused by mutations either in the mitochondrial DNA (mtDNA) or nuclear DNA (nDNA), resulting in impaired production of cellular energy from the affected mitochondrial organelles. MITO closely resembles other conditions due to its wide clinical presentation and genetic heterogeneity. While mitochondrial diseases are relatively common serious conditions with likely large medical and social costs to patients, carers and government, there is no microsimulation model of the impacts of this condition. Further, there is relatively little data on the medical costs of mitochondrial diseases and almost no data on social costs. What data there is on health costs has serious limitations and costs may be significantly underestimated. We aim to address this gap with the development of a microsimulation model called MitoMOD to estimate the costs of mitochondrial diseases using a cohort of clinically diagnosed adult patients with mitochondrial diseases as the base population. In this paper, we describe the construction of MitoMOD which is designed to capture economic impacts on adults clinically diagnosed with mitochondrial diseases, their carer and government. To date, this is the first microsimulation model of its kind.
Introduction
Mitochondrial diseases (MITO) are a group of rare inherited genetic neurological disorders where mutations in the mitochondrial DNA (mtDNA) or nuclear DNA (nDNA) result in impaired production of cellular energy (Cohen et al., 2018). MITO typically affects organs that have high energy demands such as the brain, liver, endocrine pancreas, skeletal muscles and the heart (Martikainen and Chinnery, 2015). Depending on the number and type of organ(s) affected, the clinical manifestation of MITO can vary among patients (Alston et al., 2021). Patients may also experience non-specific symptoms, such as fatigue or exercise intolerance, along with more defined symptoms such as seizures, stroke-like events, diabetes, cardiovascular disease, cognitive decline, deafness and blindness (Krieg et al., 2016). In adults, MITO is often a progressive multisystem disorder, with frequent and long-term monitoring and treatment of symptoms needed to reduce the risk of an acute illness or life-threatening episode (Mattman et al., 2011; Sue, 2010). MITO is often misdiagnosed or misinterpreted as the clinical features closely resemble other diseases, making it a challenge for clinicians to diagnose (Martikainen and Chinnery, 2015). In a study of 210 MITO patients, 55% received an alternative diagnosis before receiving the final definitive diagnosis of MITO and out of these 55%, 32% were misdiagnosed more than once (Grier et al., 2018). The participants in this study report seeking eight different physicians, on average, before receiving the correct diagnosis of MITO (Grier et al., 2018). Investigating family history of an inherited condition may not be a reliable guide as MITO can occur de novo in the maternal germline, giving rise to a sporadic disease (Martikainen and Chinnery, 2015). There is no known cure for MITO (Grier et al., 2018).
Studies suggest the prevalence of MITO in the general population ranges from 1 in 200 to 1 in 520 (Bitner-Glindzicz et al., 2009; Elliott et al., 2008; Vandebona et al., 2009; Manwaring et al., 2007). An Australian study suggested that at least 1 in 250 people carry one of the more common mutations in mitochondrial DNA that puts them at risk of developing MITO (Sue, 2010). A similar UK prevalence study reported a prevalence rate of 1 in 200, in good agreement with our Australian prevalence rate (Elliott et al., 2008).
There have been a number of microsimulation models of other neurological disorders including multiple sclerosis, Parkinson’s disease, epilepsy, dementia and traumatic brain and spinal injury (Finès et al., 2016; Sullivan et al., 2020; Rutter et al., 2022). However, there are no microsimulation models of MITO. This is important, as, given the range and severity of symptoms of MITO and its relatively high prevalence, it likely has high health and social costs.
Further, there are significant limitations to the limited data available to populate a microsimulation model of MITO (Cohen et al., 2018; McCormack et al., 2017; Buajitti et al., 2022). For example, given that most cases of MITO are often misdiagnosed, with diagnosis typically occurring only after a long diagnostic odyssey, MITO is typically not included in national population health surveys. There are a small number of studies reporting health costs for MITO, but these generally do not cover the full range of health costs, do not include social costs and are not robust in terms of their clinical diagnosis (Cohen et al. (2018); McCormack et al. (2017); Buajitti et al. (2022)). Thus, the authors note significant limitations. ICD-9 codes used do not capture all disease subtypes and patients with other disorders may be misclassified as having a diagnosis of MITO (Cohen et al. (2018); McCormack et al. (2017); Buajitti et al. (2022). Conversely, because the choice of the ICD terminology does not require a high level of clinical certainty that a patient has MITO, there could be patients included in the database that were suspected of having MITO but never had the clinical evidence to justify that choice of the specific ICD codes (Cohen et al. (2018); McCormack et al. (2017)). Advances in recognising MITO phenotypes and genotypes identified using whole genome sequencing (WGS) has led to the number of MITO variants identified recently increasing exponentially (Schon et al., 2020). However, for most families and affected individuals, WGS remains expensive and limited in availability (Schon et al., 2020) and thus data including a molecular diagnosis are generally not readily available.
We aim to build a microsimulation model to identify the financial impact of MITO to patients, their families and to government. This paper outlines the development of a static microsimulation model of MITO using data from participants attending a clinic dedicated to supporting adults clinically diagnosed with MITO who had been recruited into our Economic and Psychosocial Impacts of Caring for Families Affected by Mitochondrial Disease (EPIC-MITO) study, with many of the participants also having a molecular diagnosis as a result of genomic testing. To our knowledge, this is the first microsimulation model of patients with MITO.
Methods
1. Recruitment
The participants of our study were recruited from the neurogenetics clinic at the Royal North Shore Hospital in Sydney, Australia. The neurogenetics clinic at the Royal North Shore Hospital provides diagnostic support to people around Australia aged 18 years and above and affected family members who are clinically diagnosed with MITO. In addition to the diagnostic support, one of the clinic’s primary areas of research is MITO. Participants were invited into our study during their routine visit to the clinic. Each participant, including their carer, if applicable, that consented to the study were asked to complete a questionnaire. The questionnaire was administered by our genetic counsellor or MITO researchers either through a phone call or face-to-face session. The questionnaire covered an extensive array of topics such as information about their primary residence, employment history, employment status, reliance on transfer payments (welfare payments, benefits and allowances), utilisation of health services and treatments (including complimentary health services and treatments, special remedies and diets, non-prescription pharmaceutical drugs), respite care, savings and assets, and use of assistive technologies and modifications to the house or car, and health status (such as for mental health disorders that include depression, nervous tension/stress, anxiety, phobias, psychosis, dementia and attention deficit disorder/hyperactivity). Data on hospitalisations, use of prescribed medicines and medical services and treatments from the participants in our study were linked into the model. The quality of life among the study participants and carers were assessed using the AQoL-8D instrument. Other assessments include the level of connectedness to others from the participants in our study and the level of relationship satisfaction among those that are partnered.
Participants were recruited between September 2018 and November 2021. Out of the 107 participants we recruited into the study, 96 participants and 24 carers completed the questionnaire. Out of the 96 participants who completed the questionnaire, the majority were females and aged between 45-60 years old (Table 1). The average age of the participants in our study is 53 years old. Out of the 57 study participants that are partnered, 28% indicated their partner is their carer (Table 1). Most of the carers that were part of this study were females, reside with the study participant and aged between 61 to 74 years of age (Table 2). The average age of the carers in our study is 64.
Study Participant’s Descriptive Statistics
| Frequency | Percent | |
|---|---|---|
| Participant’s Age | ||
| 18-30 | 7 | 7.3 |
| 31-44 | 23 | 24.0 |
| 45-60 | 29 | 30.2 |
| 61-74 | 27 | 28.1 |
| 75 and over | 10 | 10.4 |
| Participant’s Gender | ||
| Female | 61 | 63.5 |
| Male | 35 | 36.5 |
| Number of Participants with a Carer | ||
| No Carer | 69 | 73.4 |
| Patient Has a Carer | 25 | 26.6 |
| Number of Participants Partnered | ||
| Not Partnered | 38 | 40.0 |
| Partnered | 57 | 60.0 |
| Number of Participants Whose Spouse is the Carer | ||
| The Participant’s Spouse is not the Carer | 41 | 71.9 |
| The Participant’s Spouse is the Carer | 16 | 28.1 |
Descriptive Statistics of the Carers in EPIC-MITO
| Frequency | Percent | |
|---|---|---|
| Carer’s age | ||
| 30-44 | 2 | 8.3 |
| 45-60 | 7 | 29.2 |
| 61-74 | 8 | 33.3 |
| =>75 | 7 | 29.2 |
| Carer’s Gender | ||
| Female | 14 | 58.3 |
| Male | 10 | 41.6 |
| Number of Carers that are Partnered | ||
| Not Partnered | 2 | 8.3 |
| Partnered | 22 | 91.7 |
| Number of Carers that live with the Participant | ||
| Lives with the Participant | 21 | 87.5 |
| Does not live with the Participant | 3 | 12.5 |
2. Microsimulation Model Structure
We built a static microsimulation model called MitoMOD which comprises a base population and four main components (Figure 1). The base population consists of the survey responses from the participants in our study. MitoMOD was developed using SAS 9.4 (SAS Institute Inc).
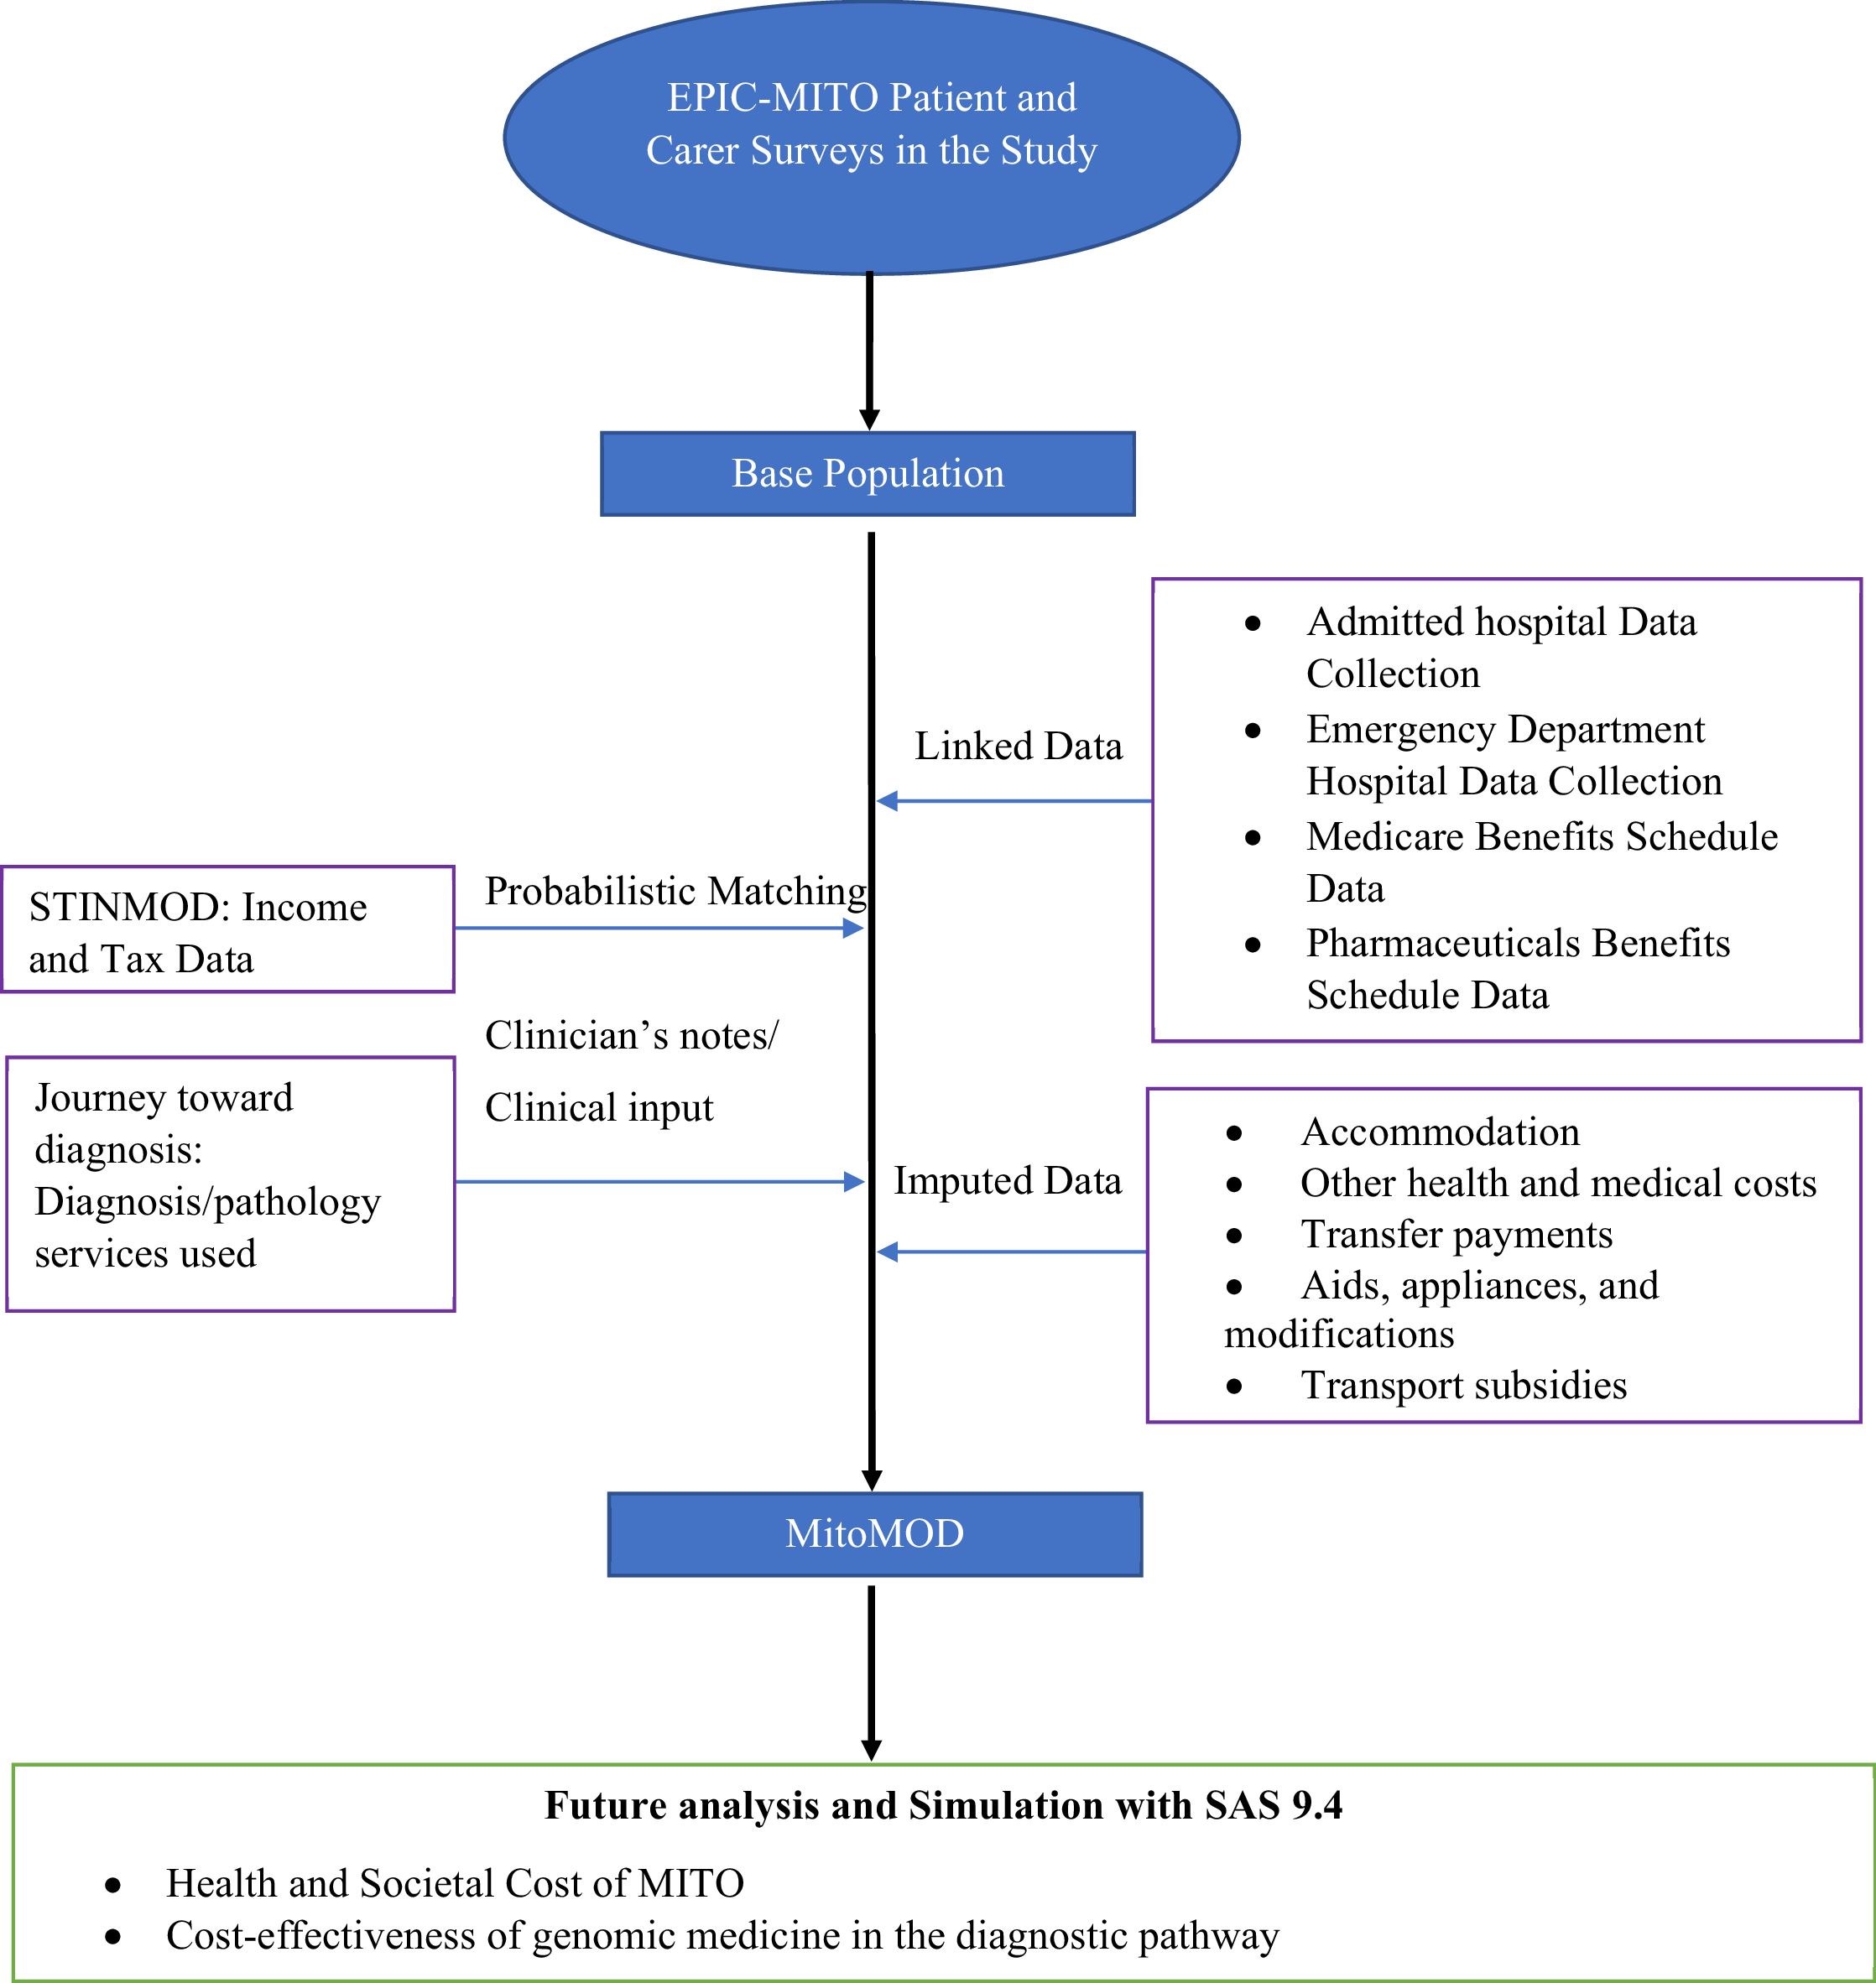

MitoMOD Microsimulation Model
2.1. Linked Data
2.1.1. Hospital and Emergency Department Admissions
Hospitals in Australia are co-funded by Australia’s Federal government (Commonwealth government) and state governments. Using hospital admissions data linked to participants in our study through the Centre of Health Record Linkage (CHeReL), hospital costs were estimated by retrieving the Australian Refined-Diagnosis Related Group (AR-DRG) codes that are used for each hospital separation under the Australian state of New South Wales Admitted Patient Data Collection (APDC). For each AR-DRG retrieved, we assigned the average length of stay and average costs obtained from the National Hospital Cost Data Collection (Independent Hospital Pricing Authority (IHPA), 2020). The cost of emergency department (ED) admissions was estimated using the Urgency Related Group (AR-URG) code in-lieu of the AR-DRG codes (Independent Hospital Pricing Authority, 2019). We estimated private hospital admissions by assigning the Hospital Casemix Protocol average cost estimates to each AR-DRG (Australian Department of Health, 2020).
Briefly, CHeReL provides linked data in the following steps: 1) Two separate files, the identifier information and content information, are created to be stored and handled separately to protect the privacy of individuals; 2) The identifier information is used to ensure the exact individual is identified and distinguished, and an encrypted arbitrary Person Number is used in place of the identifier information; 3) When the arbitrary Person Number is decrypted, a Project specific Person Number (PPN) is applied to each individual for each research project and used for content requested; 4) The data is released to the requester and can be used in a research project without the researcher accessing identified information about the individual (Centre for Health Record Linkage (CHeReL), 2022). In this study, all study participants we provided to CHeReL were matched successfully.
2.1.2. Medicare
The study participant’s health services and treatments (including hospital outpatient services) and use of pharmaceutical drugs were estimated based on linked Medicare data. Medicare is Australia’s universal health insurance scheme where eligible Australian residents can access various health care items and pharmaceutical drugs via a subsidy. The Medicare Benefits Schedule (MBS) and Pharmaceutical Benefits Schedule (PBS) lists all the available medical services and treatments, and pharmaceutical drugs that are subsidised, respectively. For an individual to access the subsidised MBS or PBS item, their Medicare number must be provided beforehand to the medical service or treatment provider or pharmacist. This Medicare number, unique to the individual, is the identifier information in the Medicare data linkage process.
2.2. Imputed Costs
Costs were obtained for some health and social costs within MitoMOD, while other costs were imputed. Table 3 provides a list of costs and their source for MitoMOD.
Cost and sources used in MitoMOD
| Item | Assigned cost (annual unless otherwise specified) | Perspective |
|---|---|---|
| Health care | ||
| Inpatient | AR-DRG (Linked data) | Government |
| Emergency department | URG (Linked data) | Government |
| Alternative medicines and services | Self-reported | Private |
| Healthcare services and treatments, pharmaceutical drugs, outpatient consultations | MBS and PBS Medicare (Linked data) | Government and Patient |
| Travel costs, meals, accommodation relating to hospital visits | Self-reported | Patient |
| Special diets, remedies, and OTC medication | Self-reported | Patient |
| Accommodation | ||
| Residential care | $16,973. Income and assets mean tested (for those earning no more than $$27,754 per year) | Government and Patient |
| Residential care - basic daily fee | $18,038 | |
| Respite care (in-home and out-of-home) | $13,024 | |
| Public housing | 25-30% less than market rent | |
| Welfare | ||
| Age pension, Disability pension, Youth allowance, Newstart (Unemployment benefit), Department of Veteran’s Affairs (DVA) pension, Parenting payment, Mobility allowance, AuStudy, Family Tax Benefit, Rent assistance, Carer Payment, Carer allowance, Sickness benefit, Other | Self-reported or estimated based on rates retrieved and methods for income and asset testing from Services Australia | Government, Patient and Carer |
| Employment | ||
| Patient’s employment | Self-reported or synthetically matched to estimate what they could have earnt if they did not have Mito or had to care for the patient | Government, Patient and Carer |
| Patient’s spouse employment | ||
| Carer’s employment | ||
| Carer’s spouse employment | ||
| Assistive technologies, modifications to home or car, transport subsidy | ||
| Assistive technologies: Walking aids/crutches, standard wheelchair, electric wheelchair, electric mobility scooter, visual aids (includes glasses), lifting devices, rails, hearing aids, orthotics/special shoes, others | Self-reported | Government and Patient |
| Home Modifications: Stairs, external areas, hallways/entrances, kitchen, living room, rails, bedroom/s, bathroom/s, other home modification | ||
| Car modification | ||
| Transport Subsidies: Bus service, taxi transport subsidy scheme, other | ||
2.2.1. Out-of-Pocket Medical costs
Some health care resources may not fall under Medicare, such as complementary medicines, special diets, remedies, non-prescription pharmaceutical drugs and alternative medicines. We asked study participants about the use of the health care resources that were not part of linked Medicare data and costs were included as out-of-pocket (OOP) medical costs. Where costs were not provided, they were imputed from publicly available sources such as recommended fees from professional bodies.
2.2.2. Accommodation Costs
We questioned the participants in our study on the information about their primary residence, including if they lived in a residential care facility (RCF), public housing, utilised respite care or used community services. RCFs are a type of accommodation for those who cannot live independently in their own home and is mostly used by the elderly (aged 65 and above) or those with a long-term disability. We retrieved the annual average cost of residential care in Australia and assigned it to participants who indicated they live in RCFs as permanent residents (Grove, 2019) (Table 3).
Respite care provides temporary relief for carers, where patients are cared for by another person during the carer’s absence. Respite care can range from several hours (either as in-home care or out-of-home care) to staying at a RCF or respite care accommodation for several days. We estimated the cost of respite care for the participants in our study using costs provided by the Australian Government Department of Health (Australian Government Department of Health, 2020).
Public or social housing is where accommodation is provided to a tenant that is on a very low income and cannot afford to pay private market rent. Public housing tenants generally pay rent (rental rebate) that is 25-30% less than the private market rental price and the government contributes the remainder (rent subsidy). We asked participants and carers if they reside in public housing and imputed the rental rebate and rent subsidy into our model based on responses from the survey.
2.2.3. Transfer Payments
Eligible Australian residents can access a variety of transfer payments offered by the Commonwealth government, including Carer Allowance or Carer Payment to financially assist informal carers who are unable to participate in paid employment. We estimated the annual transfer payments received among the participants and carers in our study based on the information provided on the types of transfer payments they received, and the amount received from each transfer payment specified.
2.2.4. Lost Income, Lost Taxes and Lost Assets
Lost income is the income the study participant could have earnt if they did not have MITO or the carer could have earnt if they did not have to care for a person with MITO. Lost income is based on the total taxable income per annum from all sources (wages, superannuation, transfer payments). Lost assets are the assets the participants in our study could have accumulated if they did not have MITO or did not need to care for a person with MITO. Lost taxes are defined as the taxes the government could have received from the participants and carers in our study if they had been employed.
We estimated lost income, taxation and wealth of the participants in our study by comparing their income, tax paid and wealth with counterfactual income, taxation and welfare payments of individuals with similar demographic characteristics from the Static Income Model (STINMOD), a static microsimulation model of Australia’s tax and transfer system (Lambert et al., 1994). STINMOD was developed and regularly updated by the National Centre for Social and Economic Modelling (NATSEM). STINMOD+, being the latest version. The model was widely used by various Australian government departments to assess the impact of major government reforms such as cash transfers and income tax on individuals and households (Schofield et al., 2009). Participants in our study were matched to those in STINMOD+ based on their age, sex, highest education attained and state of residence. These matching variables were chosen as they are associated with income but unlikely or unable to be altered by adult-onset MITO. Each participant in our study were matched to 1000 counterfactual records with similar demographic characteristics in STINMOD+ using unrestrictive random sampling method (i.e. sampling with replacement), generating 1000 counterfactual datasets. Lost income is then estimated by finding the difference between the counterfactual income and the current income the participant in our study receives. The distribution of mean lost income based on 1000 counterfactual datasets was analysed and the 95% uncertainty intervals were estimated based on the percentile method. The same counterfactual datasets were used to estimate lost taxes and lost assets.
We estimated the income lost, taxes lost, and assets lost for the spouses of the participants and carers in our study in the same way as for study participants.
2.2.5. Transport Subsidies, Assistive Technologies and Modifications
In Australia, there are several transport subsidies available for those with a long-term disability to assist them with their commuting needs. All the participants in our study were asked to list the type(s) of transport subsidy and the amount they received in the last twelve months. Similarly, we asked the study participants to provide a list of all the assistive technologies (aids, appliances, and modifications to the car or home) over the last decade and the cost of each item, including whether it was subsidised or an OOP cost. Some examples of assistive technologies include visual aids, hearing aids, scooters, wheelchairs, electric wheelchairs, and walking sticks.
2.3 Weighting
The cost estimates in our study were weighted to reflect the prevalence of MITO in the Australian population based on a previously reported Australian community prevalence study showing at least 1 in 250 adults harbour mutations to the mtDNA gene, meaning roughly 90,000 people are at risk of developing MITO (Table 4) (Sue, 2010). Importantly, all individuals who were identified in this study were found to have symptoms reflecting their mitochondrial disorder regardless of whether or not they had previously been diagnosed.
Estimated population with MITO in the General Population and the estimated number in MitoMOD by Age and Sex
| Age Group | Females | Males | ||||||
|---|---|---|---|---|---|---|---|---|
| No. in our study* | No. in General Population† | Estimated No. with MITO in the general population | Weighted Estimate - Develop MITO | No. in our Study* | No. in the General Population† | Estimated No. with MITO in the General Population | Weighted Estimate - Develop MITO | |
| 18-44 | 17 | 4,596,124 | 18,384 | 10,873 | 13 | 4,607,904 | 18,432 | 14,083 |
| 45-59 | 19 | 2,440,246 | 9,761 | 12,152 | 7 | 2,348,074 | 9,392 | 7,583 |
| 60-84 | 25 | 2,717,076 | 10,868 | 15,989 | 15 | 2,522,983 | 10,092 | 16,250 |
| Total | 61 | 9,753,446 | 39,014 | 39,014 | 35 | 9,478,961 | 37,916 | 37,916 |
-
*
Based on current available dataset.
-
†
Source: Australian Bureau of Statistics(Australian Bureau of Statistics, 2021)
-
‡
Note that the youngest age group is relatively under-represented due to the long diagnostic odyssey resulting in delay in diagnosis that patients with MITO face.
The weighted estimate by age and sex is calculated using the following equation:
where,
Ni,s = weighted estimate of the number of individuals with mitochondrial disorder with sex “s” in the ith age group
ni,s = the number of individuals in our survey with mitochondrial disorder with sex “s” in the ith age group
Pi,s = Australian population with sex “s” in the ith age group
Prev = prevalence of mitochondrial disorder in the Australian general population i.e. 1 in 250
Conclusion
This paper outlines the methods used in constructing a microsimulation model MitoMOD to estimate the cost of MITO using a broad perspective, including the health and societal costs of MITO to patients, carers and government, and using data collected from a cohort of clinically diagnosed adult MITO participants. We took a broad perspective anticipating a large range of economic and social impacts of MITO occurring at the patient, family, health service, and whole-of-government level. Our microsimulation model can be used in future studies to report the health and social costs of MITO and to estimate the cost-effectiveness of whole genome sequencing (WGS) compared to current diagnostic tests.
References
-
1
The genetics of mitochondrial disease: dissecting mitochondrial pathology using multi-omic pipelinesThe Journal of Pathology 254:430–442.https://doi.org/10.1002/path.5641
- 2
- 3
- 4
-
5
Prevalence of mitochondrial 1555A-->G mutation in European childrenThe New England Journal of Medicine 360:640–642.https://doi.org/10.1056/NEJMc0806396
-
6
Prevalence and health care costs of mitochondrial disease in Ontario, Canada: A population-based cohort studyPloS One 17:e0265744.https://doi.org/10.1371/journal.pone.0265744
- 7
-
8
A retrospective analysis of health care utilization for patients with mitochondrial disease in the United States: 2008-2015Orphanet Journal of Rare Diseases 13:1–11.https://doi.org/10.1186/s13023-018-0949-5
-
9
Pathogenic mitochondrial DNA mutations are common in the general populationAmerican Journal of Human Genetics 83:254–260.https://doi.org/10.1016/j.ajhg.2008.07.004
-
10
Development and implementation of microsimulation models of neurological conditionsHeal Reports 27:3–9.
-
11
Diagnostic odyssey of patients with mitochondrial disease: Results of a surveyNeurology. Genetics 4:e230.https://doi.org/10.1212/NXG.0000000000000230
- 12
- 13
- 14
-
15
Confirmed versus suspected: The social significance of a genetic or non-genetic diagnosis of mitochondrial diseaseMitochondrion 28:60–66.https://doi.org/10.1016/j.mito.2016.03.008
- 16
-
17
Population prevalence of the MELAS A3243G mutationMitochondrion 7:230–233.https://doi.org/10.1016/j.mito.2006.12.004
-
18
Mitochondrial disease: mimics and chameleonsPractical Neurology 15:424–435.https://doi.org/10.1136/practneurol-2015-001191
- 19
-
20
Hospitalizations for mitochondrial disease across the lifespan in the U.SMolecular Genetics and Metabolism 121:119–126.https://doi.org/10.1016/j.ymgme.2017.04.007
-
21
A Simple Method for Simulating Dementia Onset and Death within an Existing Demographic ModelMedical Decision Making 42:43–50.https://doi.org/10.1177/0272989X211016810
-
22
Health&WealthMOD: A Microsimulation Model Of The Economic Impacts Of Diseases On Older WorkersInternational Journal of Microsimulation 2:58–63.https://doi.org/10.34196/ijm.00018
-
23
Mitochondrial Diseases: A Diagnostic RevolutionTrends in Genetics 36:702–717.https://doi.org/10.1016/j.tig.2020.06.009
-
24
Mitochondrial disease: recognising more than just the tip of the icebergThe Medical Journal of Australia 193:195–196.https://doi.org/10.5694/j.1326-5377.2010.tb03864.x
-
25
The Social Value of Improvement in Activities of Daily Living among the Advanced Parkinson’s Disease PopulationForum for Health Economics & Policy 23:1–23.https://doi.org/10.1515/fhep-2019-0021
-
26
Prevalence of mitochondrial 1555A-->G mutation in adults of European descentThe New England Journal of Medicine 360:642–644.https://doi.org/10.1056/NEJMc0806397
Article and author information
Author details
Funding
No specific funding for this article is reported.
Acknowledgements
This study was supported by the National Health and Medical Research Council (NHMRC) (Grant ID: 1151906). We thank the NSW Ministry of Health for access to the health data, and the NSW Centre for Health Record Linkage for conducting record linkage. This research was carried out in accordance with the principles embodied in the Declaration of Helsinki.
Publication history
- Version of Record published: August 31, 2022 (version 1)
Copyright
© 2022, Schofield et al.
This article is distributed under the terms of the Creative Commons Attribution License, which permits unrestricted use and redistribution provided that the original author and source are credited.