The Development of a Microsimulation Model (MitoMOD) to Estimate the Economic Impact of Mitochondrial Disease in Adults
- Centre for Economic Impacts of Genomic Medicine, Macquarie Business School, Australia
- Kolling Institute, Royal North Shore Hospital, Australia
- National Centre for Social and Economic Modelling (NATSEM), Australia
Cite this article
as: D. Schofield, K. Lim, O. Tan, R. Shrestha, S. Haque, K. Crawley, S. West, A. Percival, J. Parmar, J. Kraindler, J. Li, R. Tanton, C. Sue; 2022; The Development of a Microsimulation Model (MitoMOD) to Estimate the Economic Impact of Mitochondrial Disease in Adults; International Journal of Microsimulation; 15(2); 102-111.
doi: 10.34196/ijm.00265
Figures
Figure 1
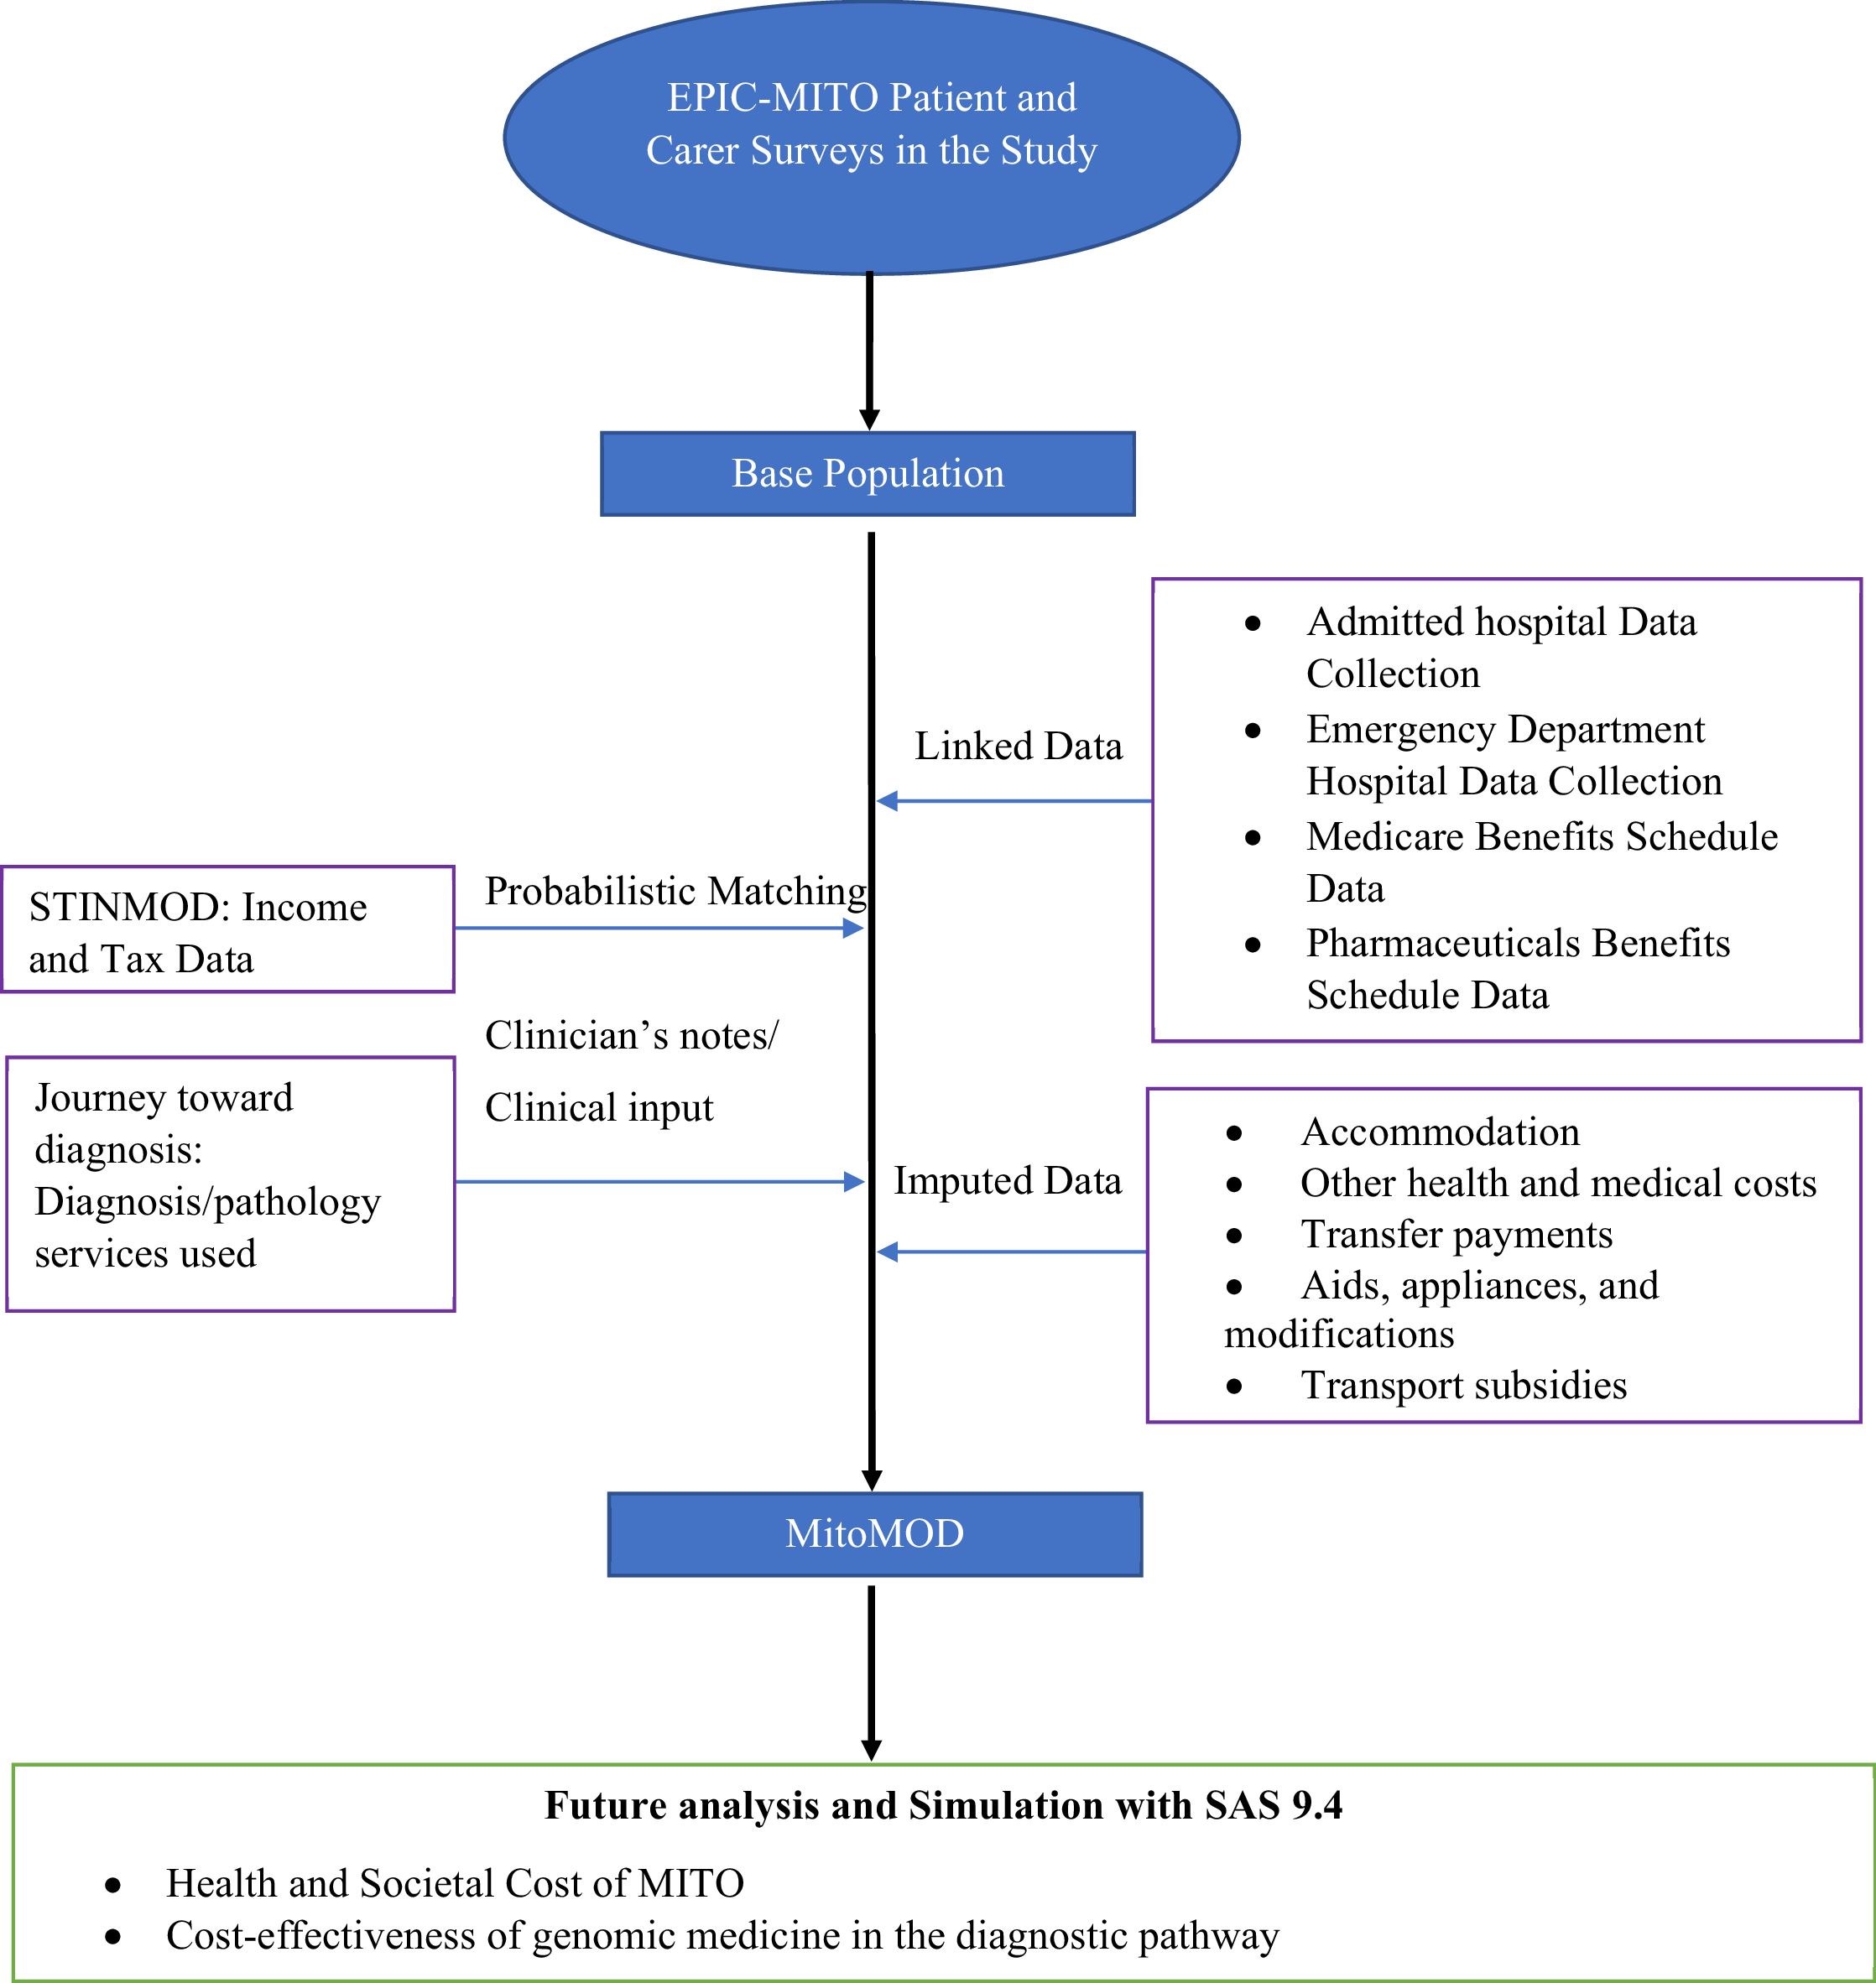

MitoMOD Microsimulation Model
Tables
Table 1
Study Participant’s Descriptive Statistics
| Frequency | Percent | |
|---|---|---|
| Participant’s Age | ||
| 18-30 | 7 | 7.3 |
| 31-44 | 23 | 24.0 |
| 45-60 | 29 | 30.2 |
| 61-74 | 27 | 28.1 |
| 75 and over | 10 | 10.4 |
| Participant’s Gender | ||
| Female | 61 | 63.5 |
| Male | 35 | 36.5 |
| Number of Participants with a Carer | ||
| No Carer | 69 | 73.4 |
| Patient Has a Carer | 25 | 26.6 |
| Number of Participants Partnered | ||
| Not Partnered | 38 | 40.0 |
| Partnered | 57 | 60.0 |
| Number of Participants Whose Spouse is the Carer | ||
| The Participant’s Spouse is not the Carer | 41 | 71.9 |
| The Participant’s Spouse is the Carer | 16 | 28.1 |
Table 2
Descriptive Statistics of the Carers in EPIC-MITO
| Frequency | Percent | |
|---|---|---|
| Carer’s age | ||
| 30-44 | 2 | 8.3 |
| 45-60 | 7 | 29.2 |
| 61-74 | 8 | 33.3 |
| =>75 | 7 | 29.2 |
| Carer’s Gender | ||
| Female | 14 | 58.3 |
| Male | 10 | 41.6 |
| Number of Carers that are Partnered | ||
| Not Partnered | 2 | 8.3 |
| Partnered | 22 | 91.7 |
| Number of Carers that live with the Participant | ||
| Lives with the Participant | 21 | 87.5 |
| Does not live with the Participant | 3 | 12.5 |
Table 3
Cost and sources used in MitoMOD
| Item | Assigned cost (annual unless otherwise specified) | Perspective |
|---|---|---|
| Health care | ||
| Inpatient | AR-DRG (Linked data) | Government |
| Emergency department | URG (Linked data) | Government |
| Alternative medicines and services | Self-reported | Private |
| Healthcare services and treatments, pharmaceutical drugs, outpatient consultations | MBS and PBS Medicare (Linked data) | Government and Patient |
| Travel costs, meals, accommodation relating to hospital visits | Self-reported | Patient |
| Special diets, remedies, and OTC medication | Self-reported | Patient |
| Accommodation | ||
| Residential care | $16,973. Income and assets mean tested (for those earning no more than $$27,754 per year) | Government and Patient |
| Residential care - basic daily fee | $18,038 | |
| Respite care (in-home and out-of-home) | $13,024 | |
| Public housing | 25-30% less than market rent | |
| Welfare | ||
| Age pension, Disability pension, Youth allowance, Newstart (Unemployment benefit), Department of Veteran’s Affairs (DVA) pension, Parenting payment, Mobility allowance, AuStudy, Family Tax Benefit, Rent assistance, Carer Payment, Carer allowance, Sickness benefit, Other | Self-reported or estimated based on rates retrieved and methods for income and asset testing from Services Australia | Government, Patient and Carer |
| Employment | ||
| Patient’s employment | Self-reported or synthetically matched to estimate what they could have earnt if they did not have Mito or had to care for the patient | Government, Patient and Carer |
| Patient’s spouse employment | ||
| Carer’s employment | ||
| Carer’s spouse employment | ||
| Assistive technologies, modifications to home or car, transport subsidy | ||
| Assistive technologies: Walking aids/crutches, standard wheelchair, electric wheelchair, electric mobility scooter, visual aids (includes glasses), lifting devices, rails, hearing aids, orthotics/special shoes, others | Self-reported | Government and Patient |
| Home Modifications: Stairs, external areas, hallways/entrances, kitchen, living room, rails, bedroom/s, bathroom/s, other home modification | ||
| Car modification | ||
| Transport Subsidies: Bus service, taxi transport subsidy scheme, other | ||
Table 4
Estimated population with MITO in the General Population and the estimated number in MitoMOD by Age and Sex
| Age Group | Females | Males | ||||||
|---|---|---|---|---|---|---|---|---|
| No. in our study* | No. in General Population† | Estimated No. with MITO in the general population | Weighted Estimate - Develop MITO | No. in our Study* | No. in the General Population† | Estimated No. with MITO in the General Population | Weighted Estimate - Develop MITO | |
| 18-44 | 17 | 4,596,124 | 18,384 | 10,873 | 13 | 4,607,904 | 18,432 | 14,083 |
| 45-59 | 19 | 2,440,246 | 9,761 | 12,152 | 7 | 2,348,074 | 9,392 | 7,583 |
| 60-84 | 25 | 2,717,076 | 10,868 | 15,989 | 15 | 2,522,983 | 10,092 | 16,250 |
| Total | 61 | 9,753,446 | 39,014 | 39,014 | 35 | 9,478,961 | 37,916 | 37,916 |
-
*
Based on current available dataset.
-
†
Source: Australian Bureau of Statistics(Australian Bureau of Statistics, 2021)
-
‡
Note that the youngest age group is relatively under-represented due to the long diagnostic odyssey resulting in delay in diagnosis that patients with MITO face.
Data and code availability
The simulation code and data remain proprietary as due to ethics, public distribution and access of patient and health data are not permitted. The corresponding authors can be contacted to discuss model development.
Download links
A two-part list of links to download the article, or parts of the article, in various formats.