Economic and Distributional Impacts of Covid-19 Economic Shocks on Women in Senegal
- EDEHN (Equipe D’Economie – le Havre Normandie), France
- LIND, Senegal
Cite this article
as: H. Maisonnave, F. Cabral, M. Henseler; 2022; Economic and Distributional Impacts of Covid-19 Economic Shocks on Women in Senegal; International Journal of Microsimulation; 15(3); 1-14.
doi: 10.34196/ijm.00267
Figures
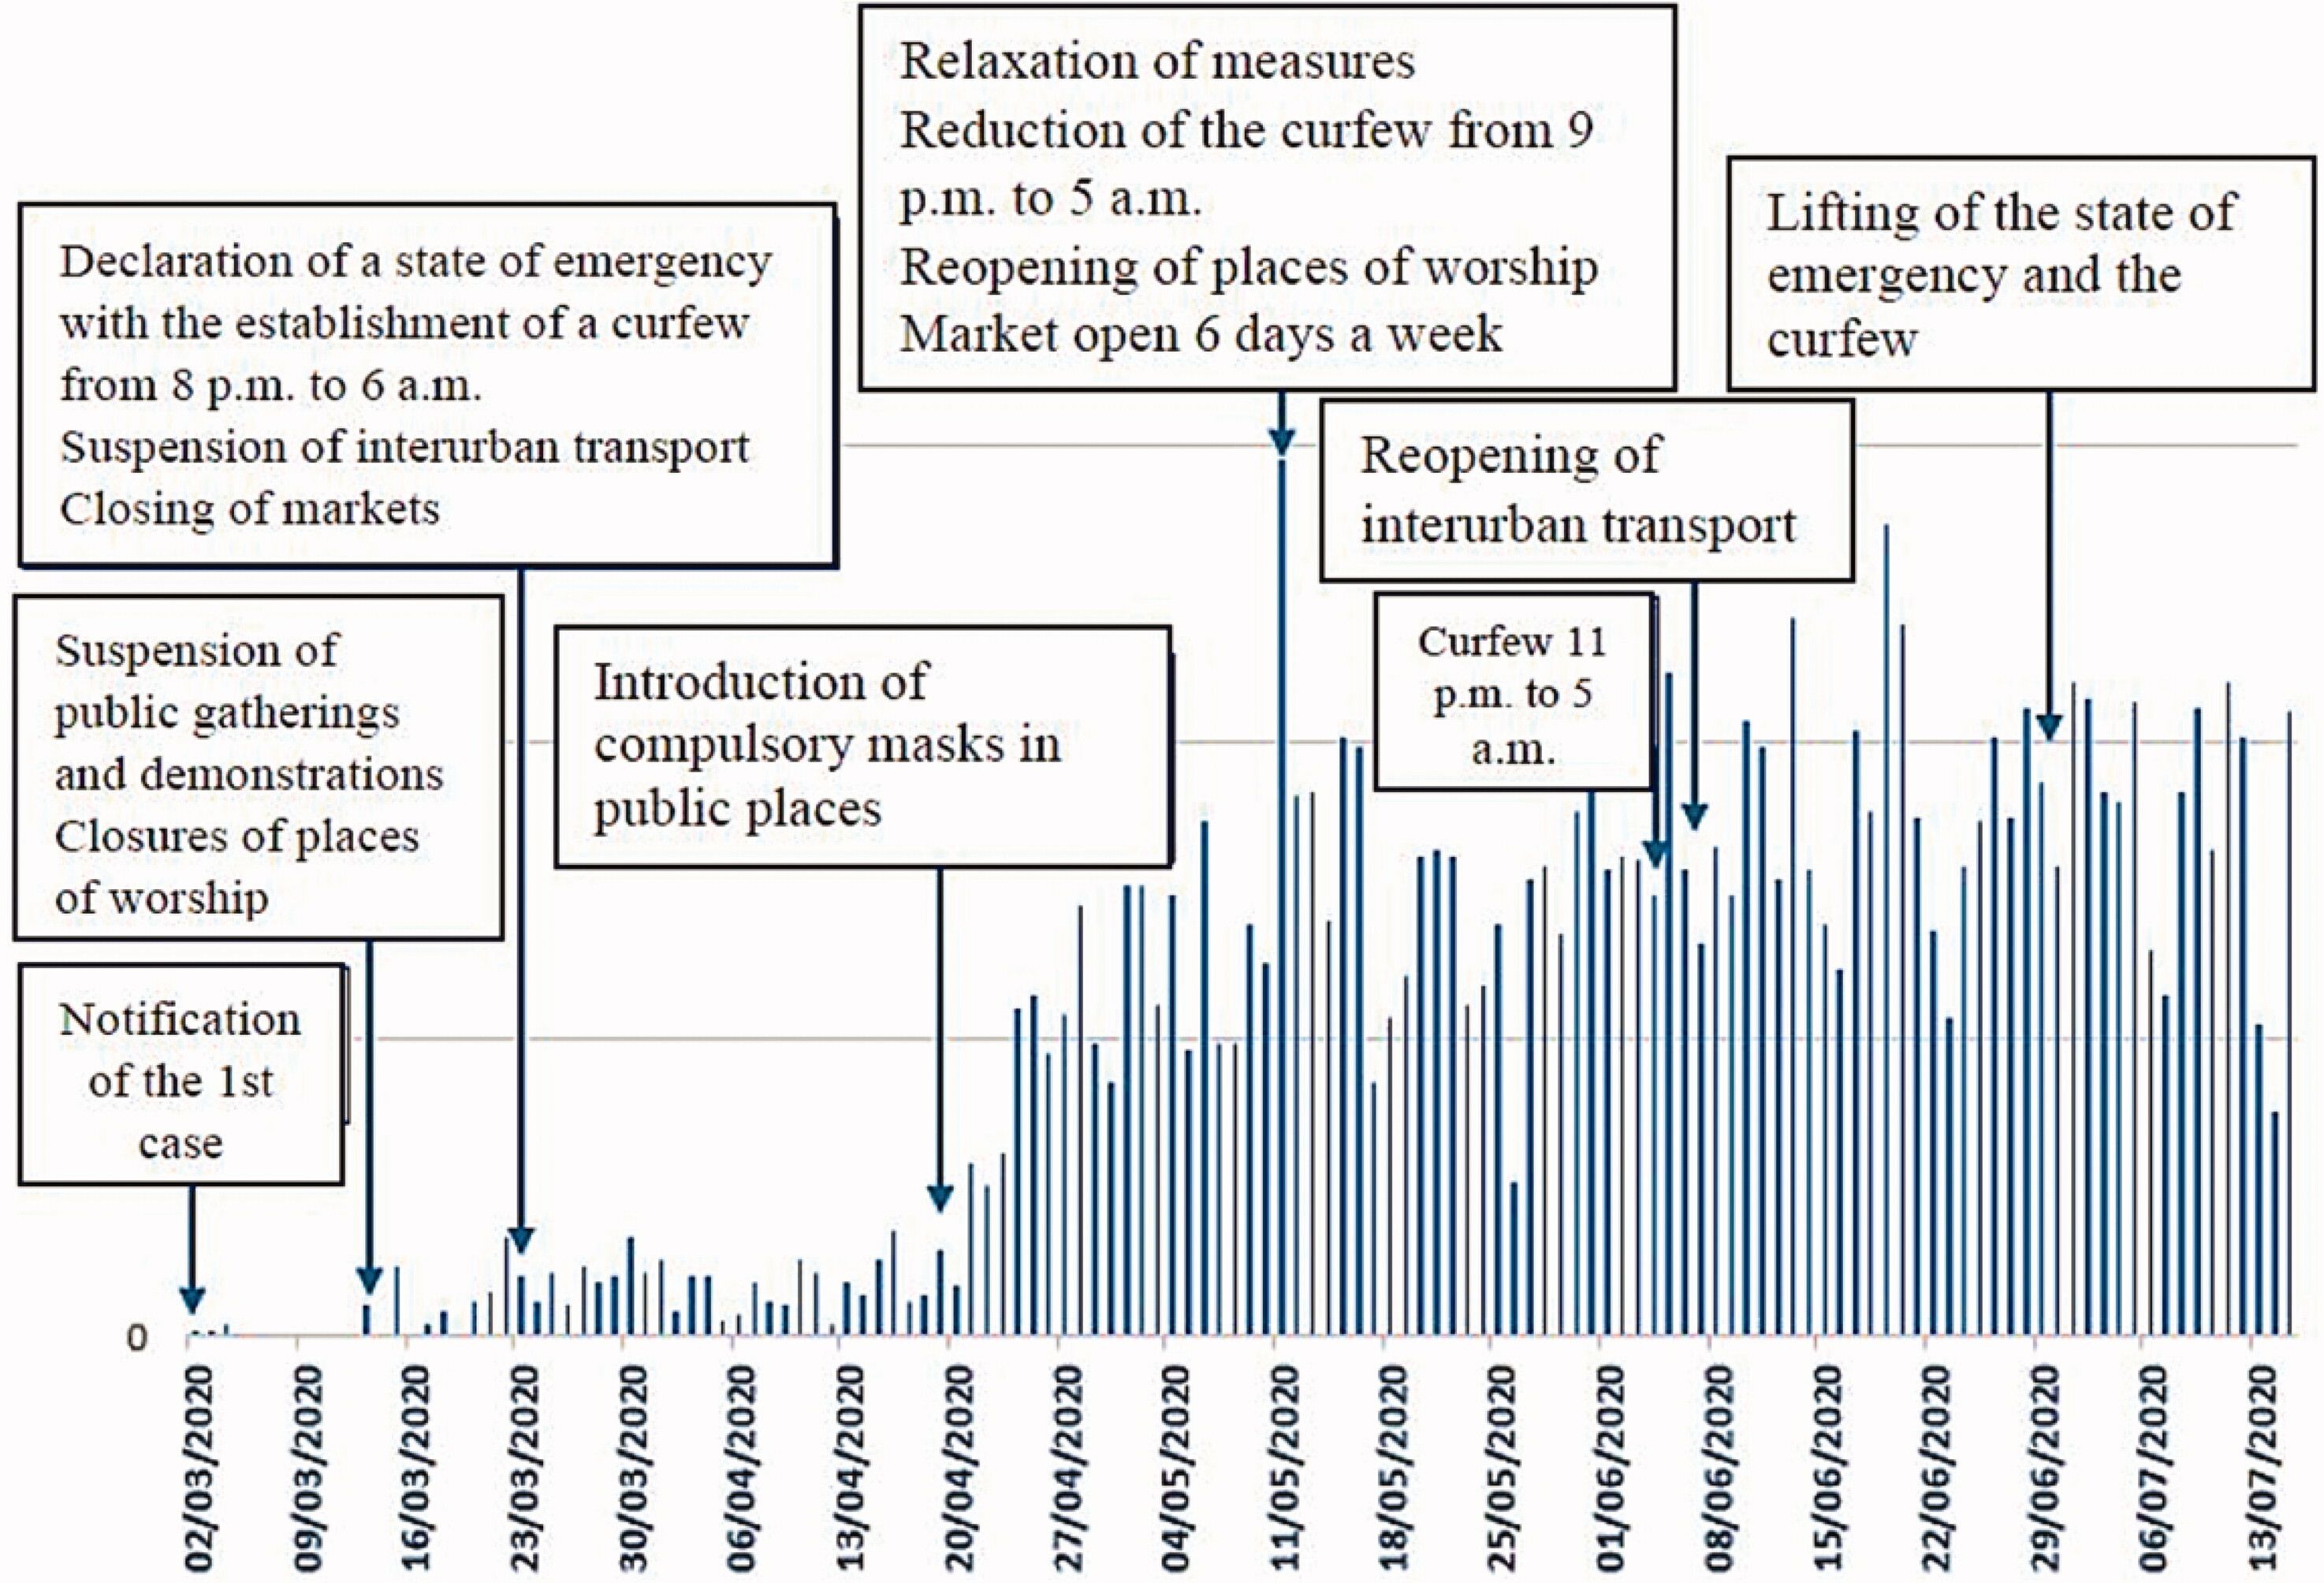
Figure 1

Number of Covid-19 cases and timing of Covid-19 response measures in Senegal in 2020 (Ridde and Faye, 2022, p. 38).
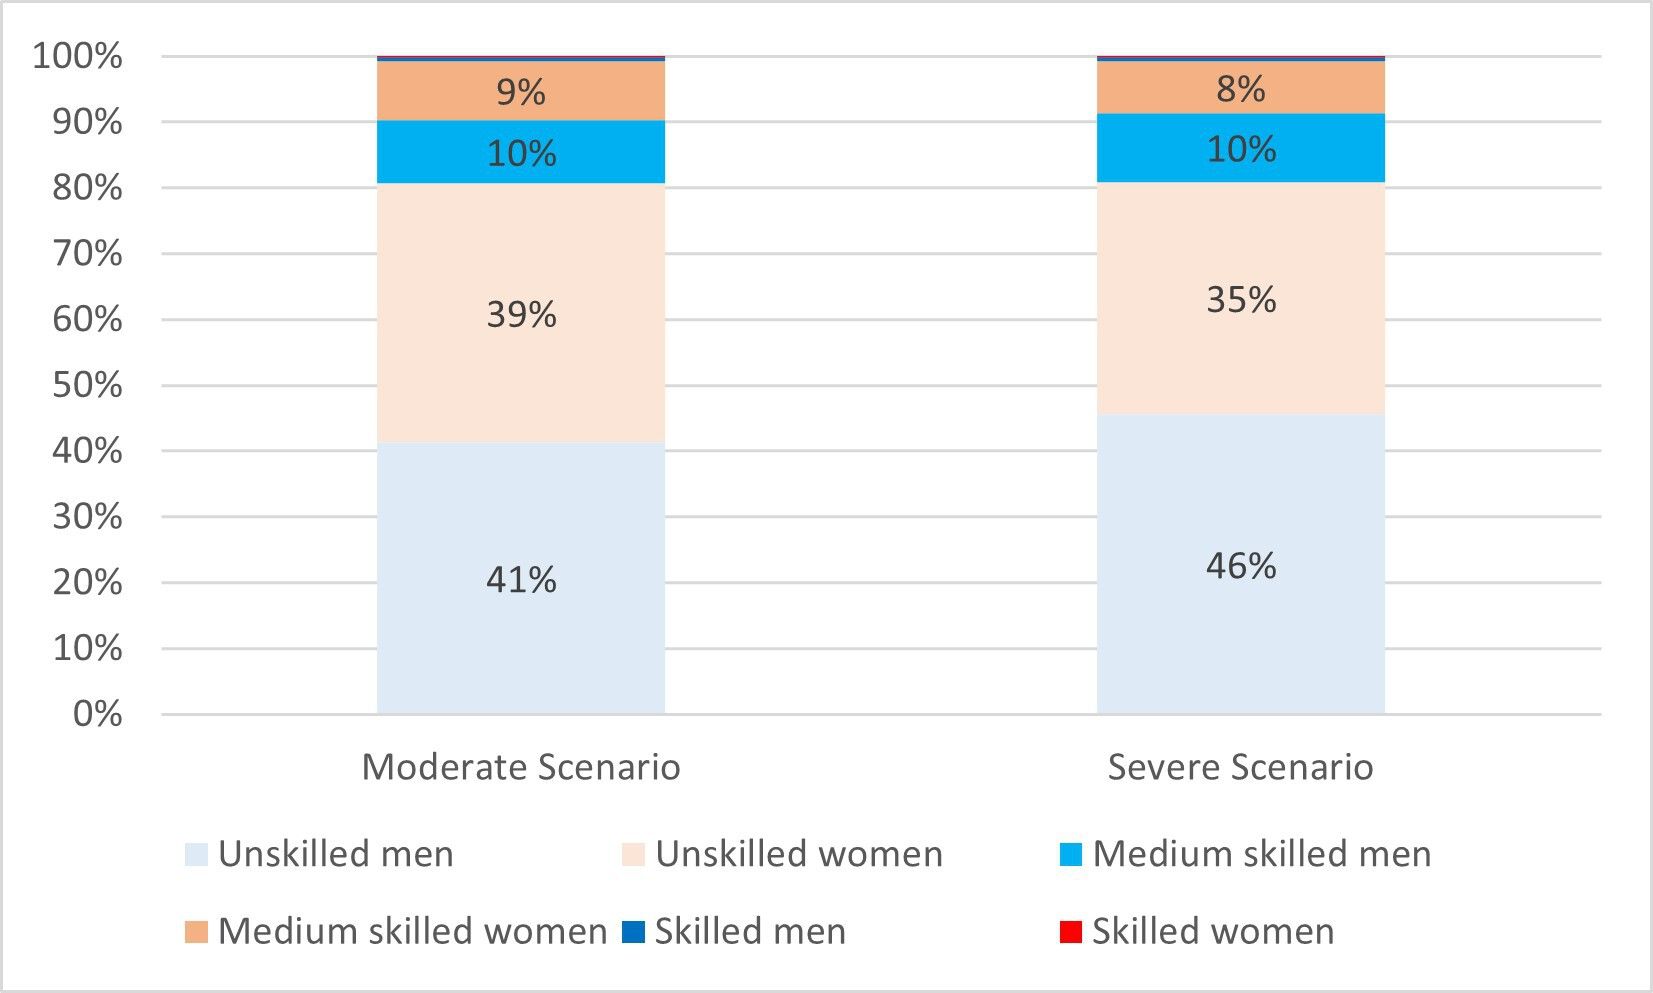
Figure 2
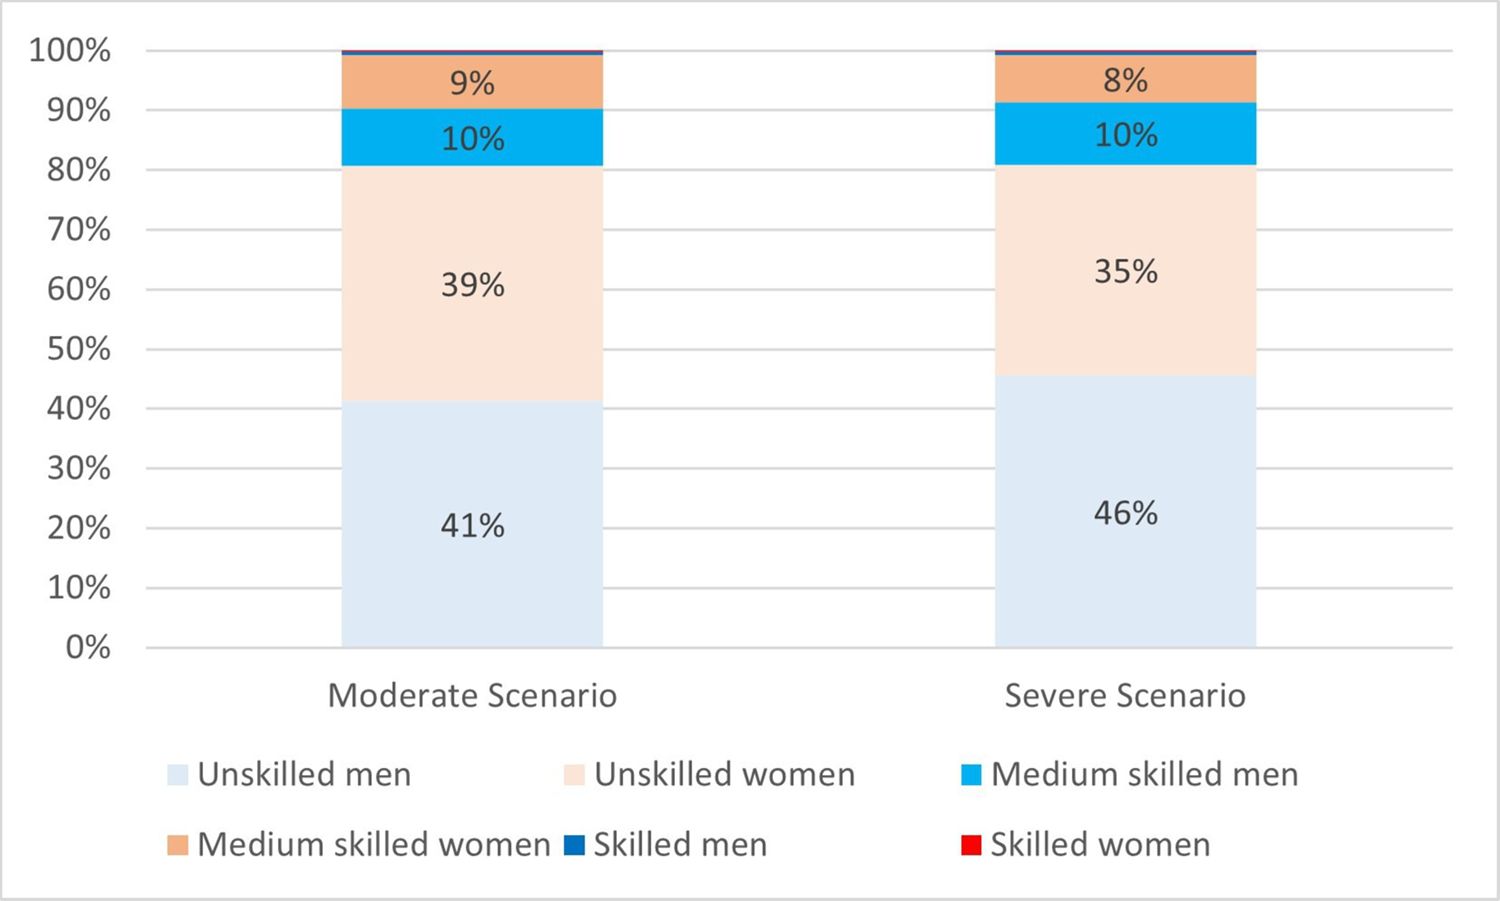
Share of labour types in decreased employment.. Source: Computation from the authors based on the micro-simulation results.
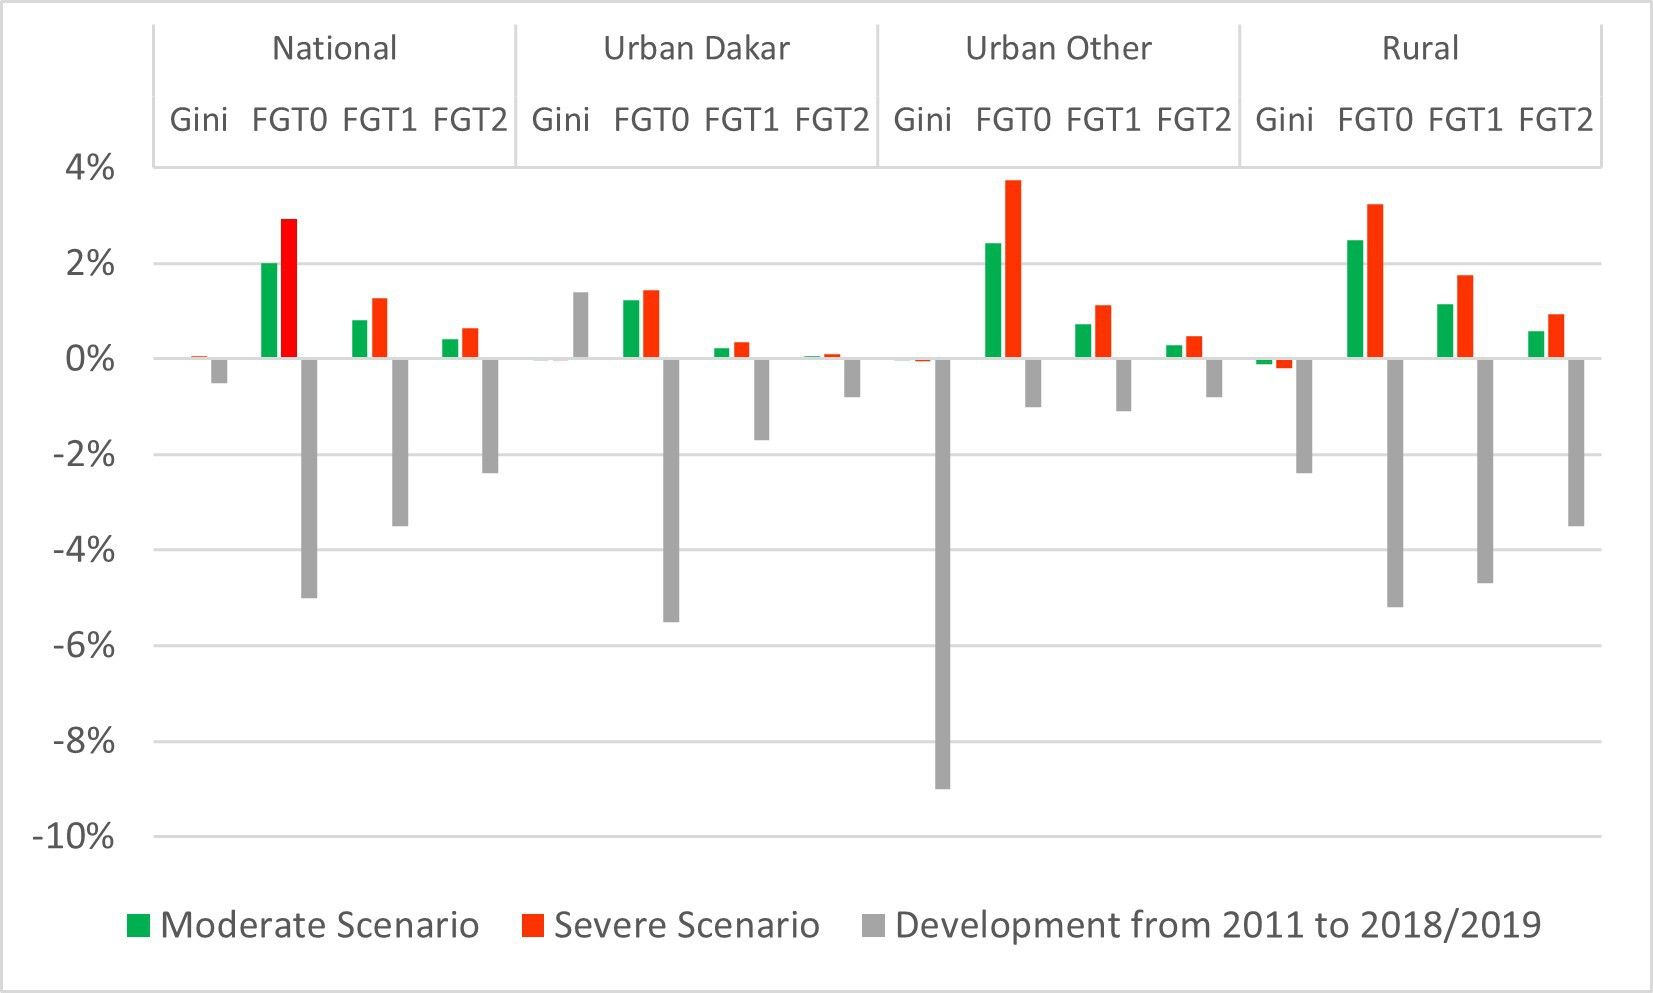
Figure 3
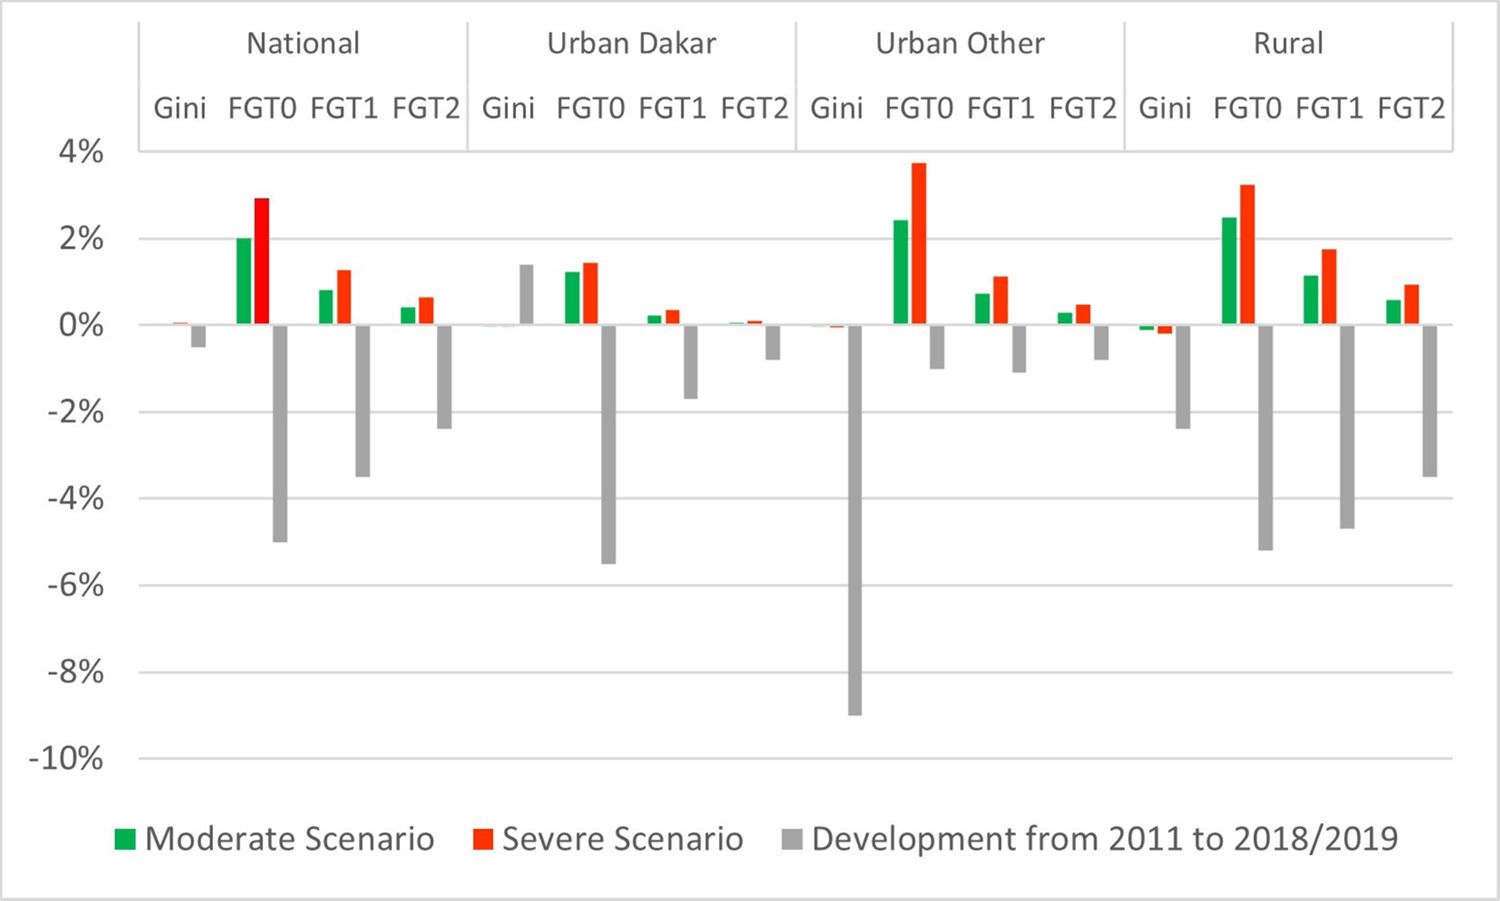
Changes in the Gini and FGT indexes for households in different regions (in p.p.)
Tables
Table 1
Distribution according to gender and level of education (%) and the distribution of education among women.
| Distribution among men and women | Level of education among women | |||
|---|---|---|---|---|
| Women % of total | Men % of total | Total | % of women | |
| Without education | 47 | 53 | 100 | 86.2 |
| Certificate of Primary Education (CEPE) | 44 | 56 | 100 | 7.4 |
| Junior Secondary Education Certificate | 36 | 64 | 100 | 3.7 |
| Secondary School-leaving certificate (BAC) | 30 | 70 | 100 | 1.6 |
| General Undergraduate degree University Diploma / | 23 | 77 | 100 | 0.6 |
| Degree/Master’s/Engineer/Doctorate | 23 | 77 | 100 | 0.5 |
| Overall | 46 | 54 | 100 | 100 |
-
Source: ANSD (2017).
Table 2
International trade
| Share of Exports per commodity (%) a | Share of imports (%) b | Rate of export (%) c | Penetration rate (%) d | |
|---|---|---|---|---|
| Agriculture | 8.1 | 5.9 | 8.7 | 10.3 |
| Industry | 65.8 | 84.2 | 23.4 | 39.0 |
| Market services | 26.1 | 9.8 | 9.2 | 5.9 |
| Non-market services | 0.0 | 0.0 | 0.0 | 0.0 |
| Total | 100 | 100 | 13.7 | 20.6 |
-
Source: Computation from the authors based on the Social Accounting Matrix (SAM) 2017 (a) export by sector/total export, (b) Import by sector/total export, (c) Export by sector/Production by sector, (d) Import of commodity/ (imports + locally produced commodity).
Table 3
Descriptive statistics of the consumtion per head for the regional samples, values in Million CFA franc
| Min. | 1st Quartile | Median | Mean | 3rd Quartile | Max. | |
|---|---|---|---|---|---|---|
| National | 0.051 | 0.279 | 0.428 | 0.652 | 0.717 | 16.123 |
| Urban Dakar | 0.254 | 0.734 | 1.149 | 1.537 | 1.888 | 16.123 |
| Urban Other | 0.068 | 0.337 | 0.498 | 0.666 | 0.756 | 14.332 |
| Rural | 0.051 | 0.218 | 0.310 | 0.391 | 0.456 | 5.157 |
Table 4
Simulated scenarios
| Moderate Scenario | Severe Scenario | |
|---|---|---|
| International channels | ||
| Decline in exports | Fishing and aquaculture production: - 52.5% Agro-food production: -8.4% Petroleum refinery products: -15% Chemical products: -22.9% Telecommunications services: -59% Air transport services: -30% Hospitality services: -78% Catering services: -20% | |
| Increase in exports | Agricultural and associated products: +6.2% Livestock products: +92.6% Extractive industry products: +5% Manufacturing industry products: +32.4% | |
| Lower international prices | Peanut oil: -8.2% Agri-food products: -2.6% Non-food industry products: -2.6% | |
| Decline in migrant remittances | -10% | -15% |
| Domestic channel | ||
| Declining productivity of sectors | highly affected sectors: -2% | highly affected sectors: - 3% |
| moderately affected sectors: -1% | moderately affected sectors: -2% | |
Table 5
Impact on macroeconomic variables (% change)
| Moderate | Severe | |
|---|---|---|
| Real GDP | -5.4 | -6.5 |
| Total investment | -7.0 | -8.8 |
| Consumer Price Index | -2.9 | -3.1 |
| Total employment | ||
| Male | -0.8 | -1.0 |
| Female | -0.7 | -0.8 |
| Real consumption of households located in | ||
| Dakar | -2.7 | -4.0 |
| urban regions | -3.2 | -5.0 |
| rural areas | -3.3 | -5.1 |
-
Source: CGE model results.
Table 6
Change in the number of employees per segment of the economy (No. of workers)
| Moderate | Severe | Moderate | Severe | |
|---|---|---|---|---|
| absolute change | relative changea | |||
| Formal sector | -9,866 | -11,960 | -0.3% | -0.3% |
| Informal sector | -44,489 | -54,282 | -1.2% | -1.5% |
| Total | -54,355 | -66,242 | -1.5% | -1.8% |
-
Source: results of the micro model.
-
(a) Referred to the total number of employees of 3,712,719.
Data and code availability
Please contact the authors for information on data and code availability.
Download links
A two-part list of links to download the article, or parts of the article, in various formats.