Simulations of Policy Responses and Interventions to Promote Inclusive Adaptation to and Recovery from the COVID-19 Crisis in Ghana
- Ashesi University, Ghana
- Université Laval, Canada
- Ministry of Finance, Ghana
- University of Ghana, Ghana
Figures

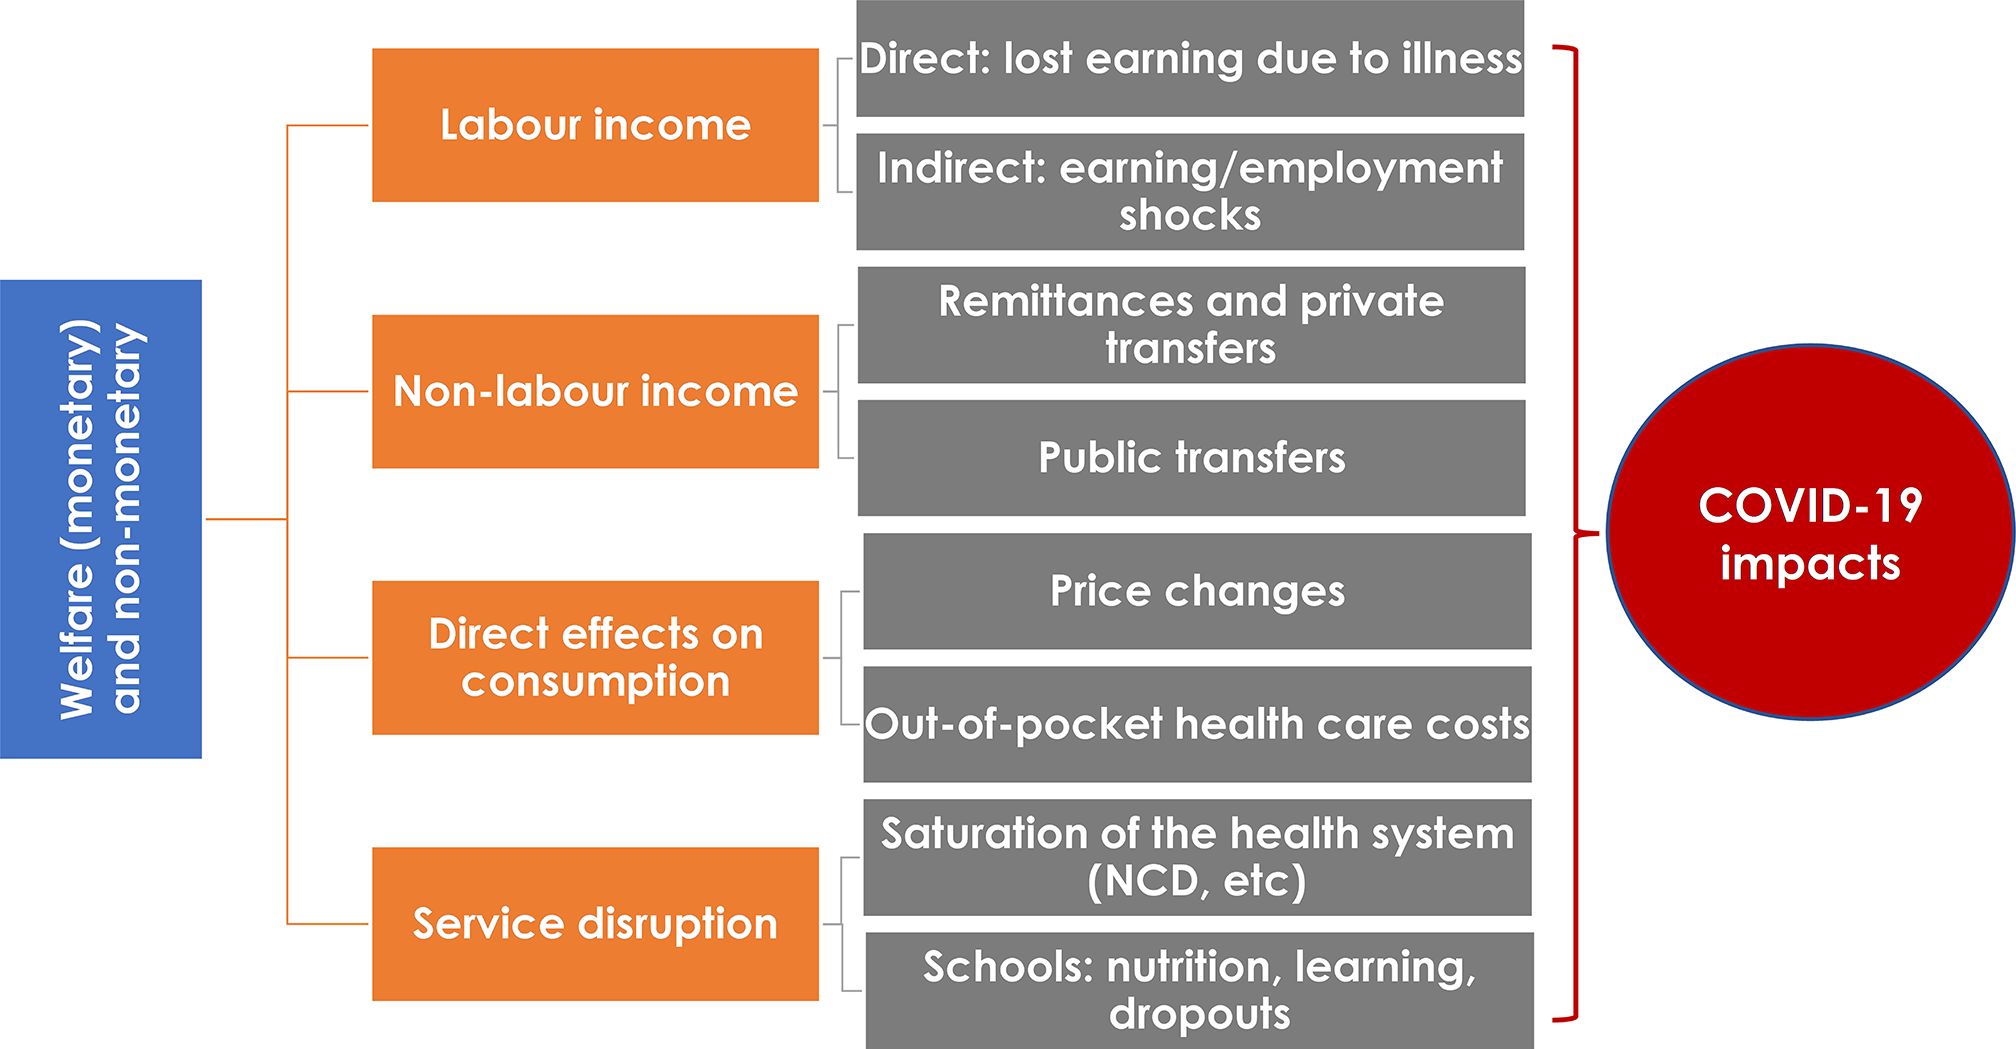
The channels through which COVID-19 impacts welfare in the short term. Source: Gentilini et al. (2020, p. 3), Figure 1.
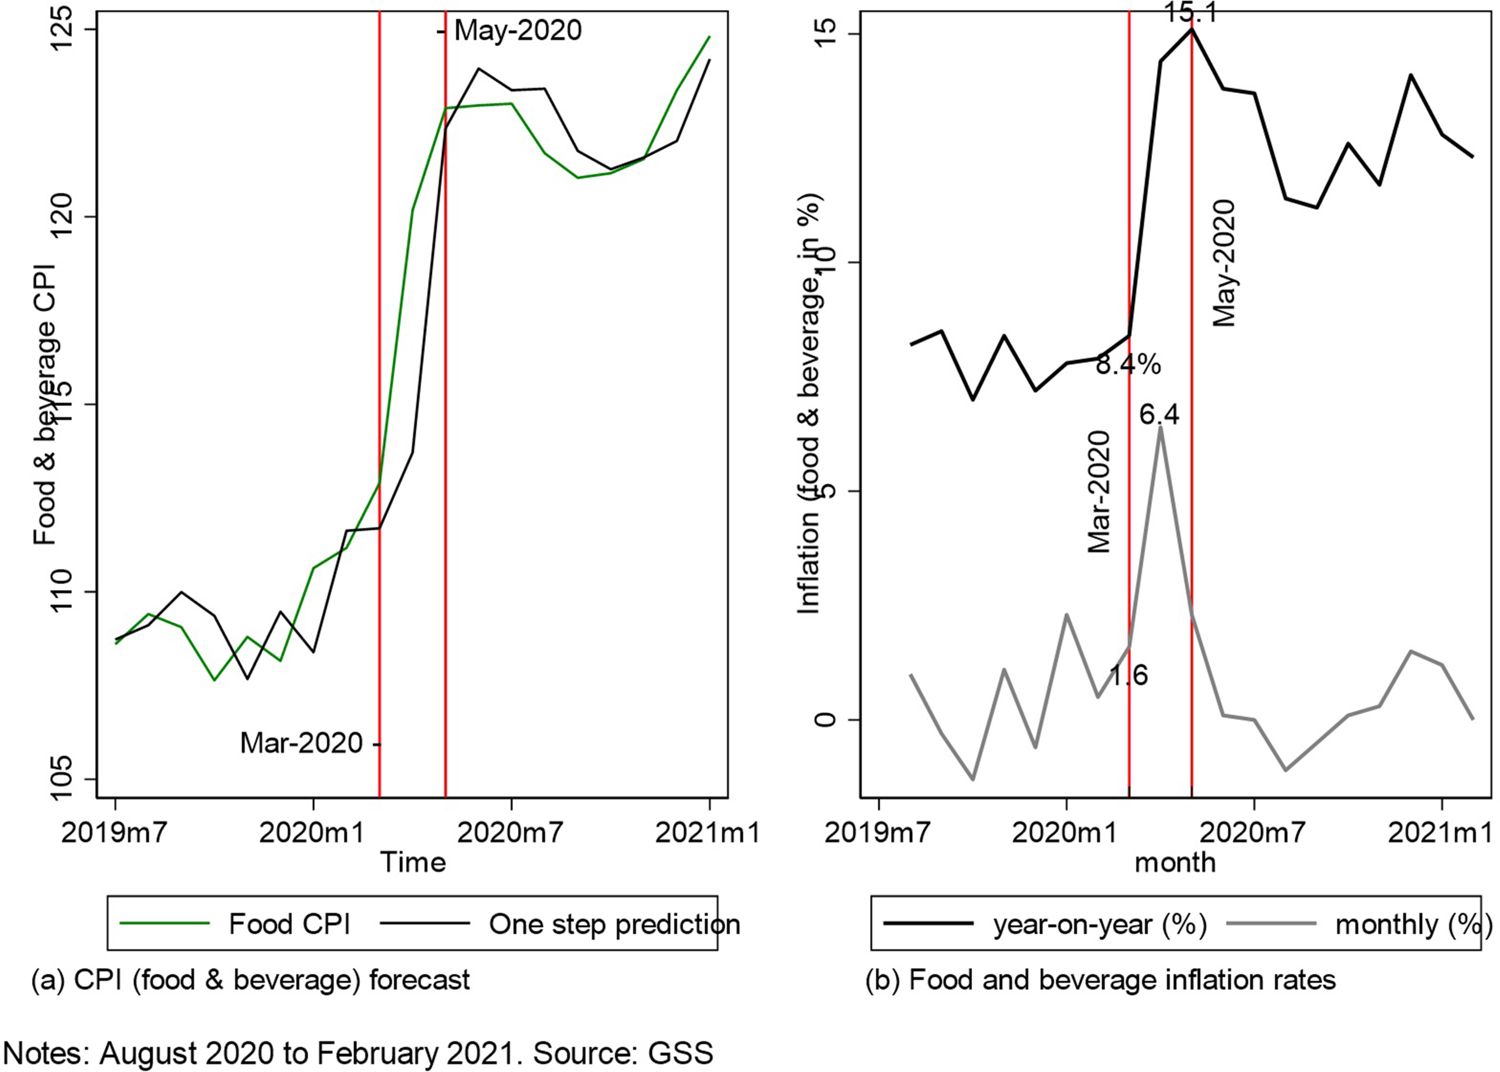
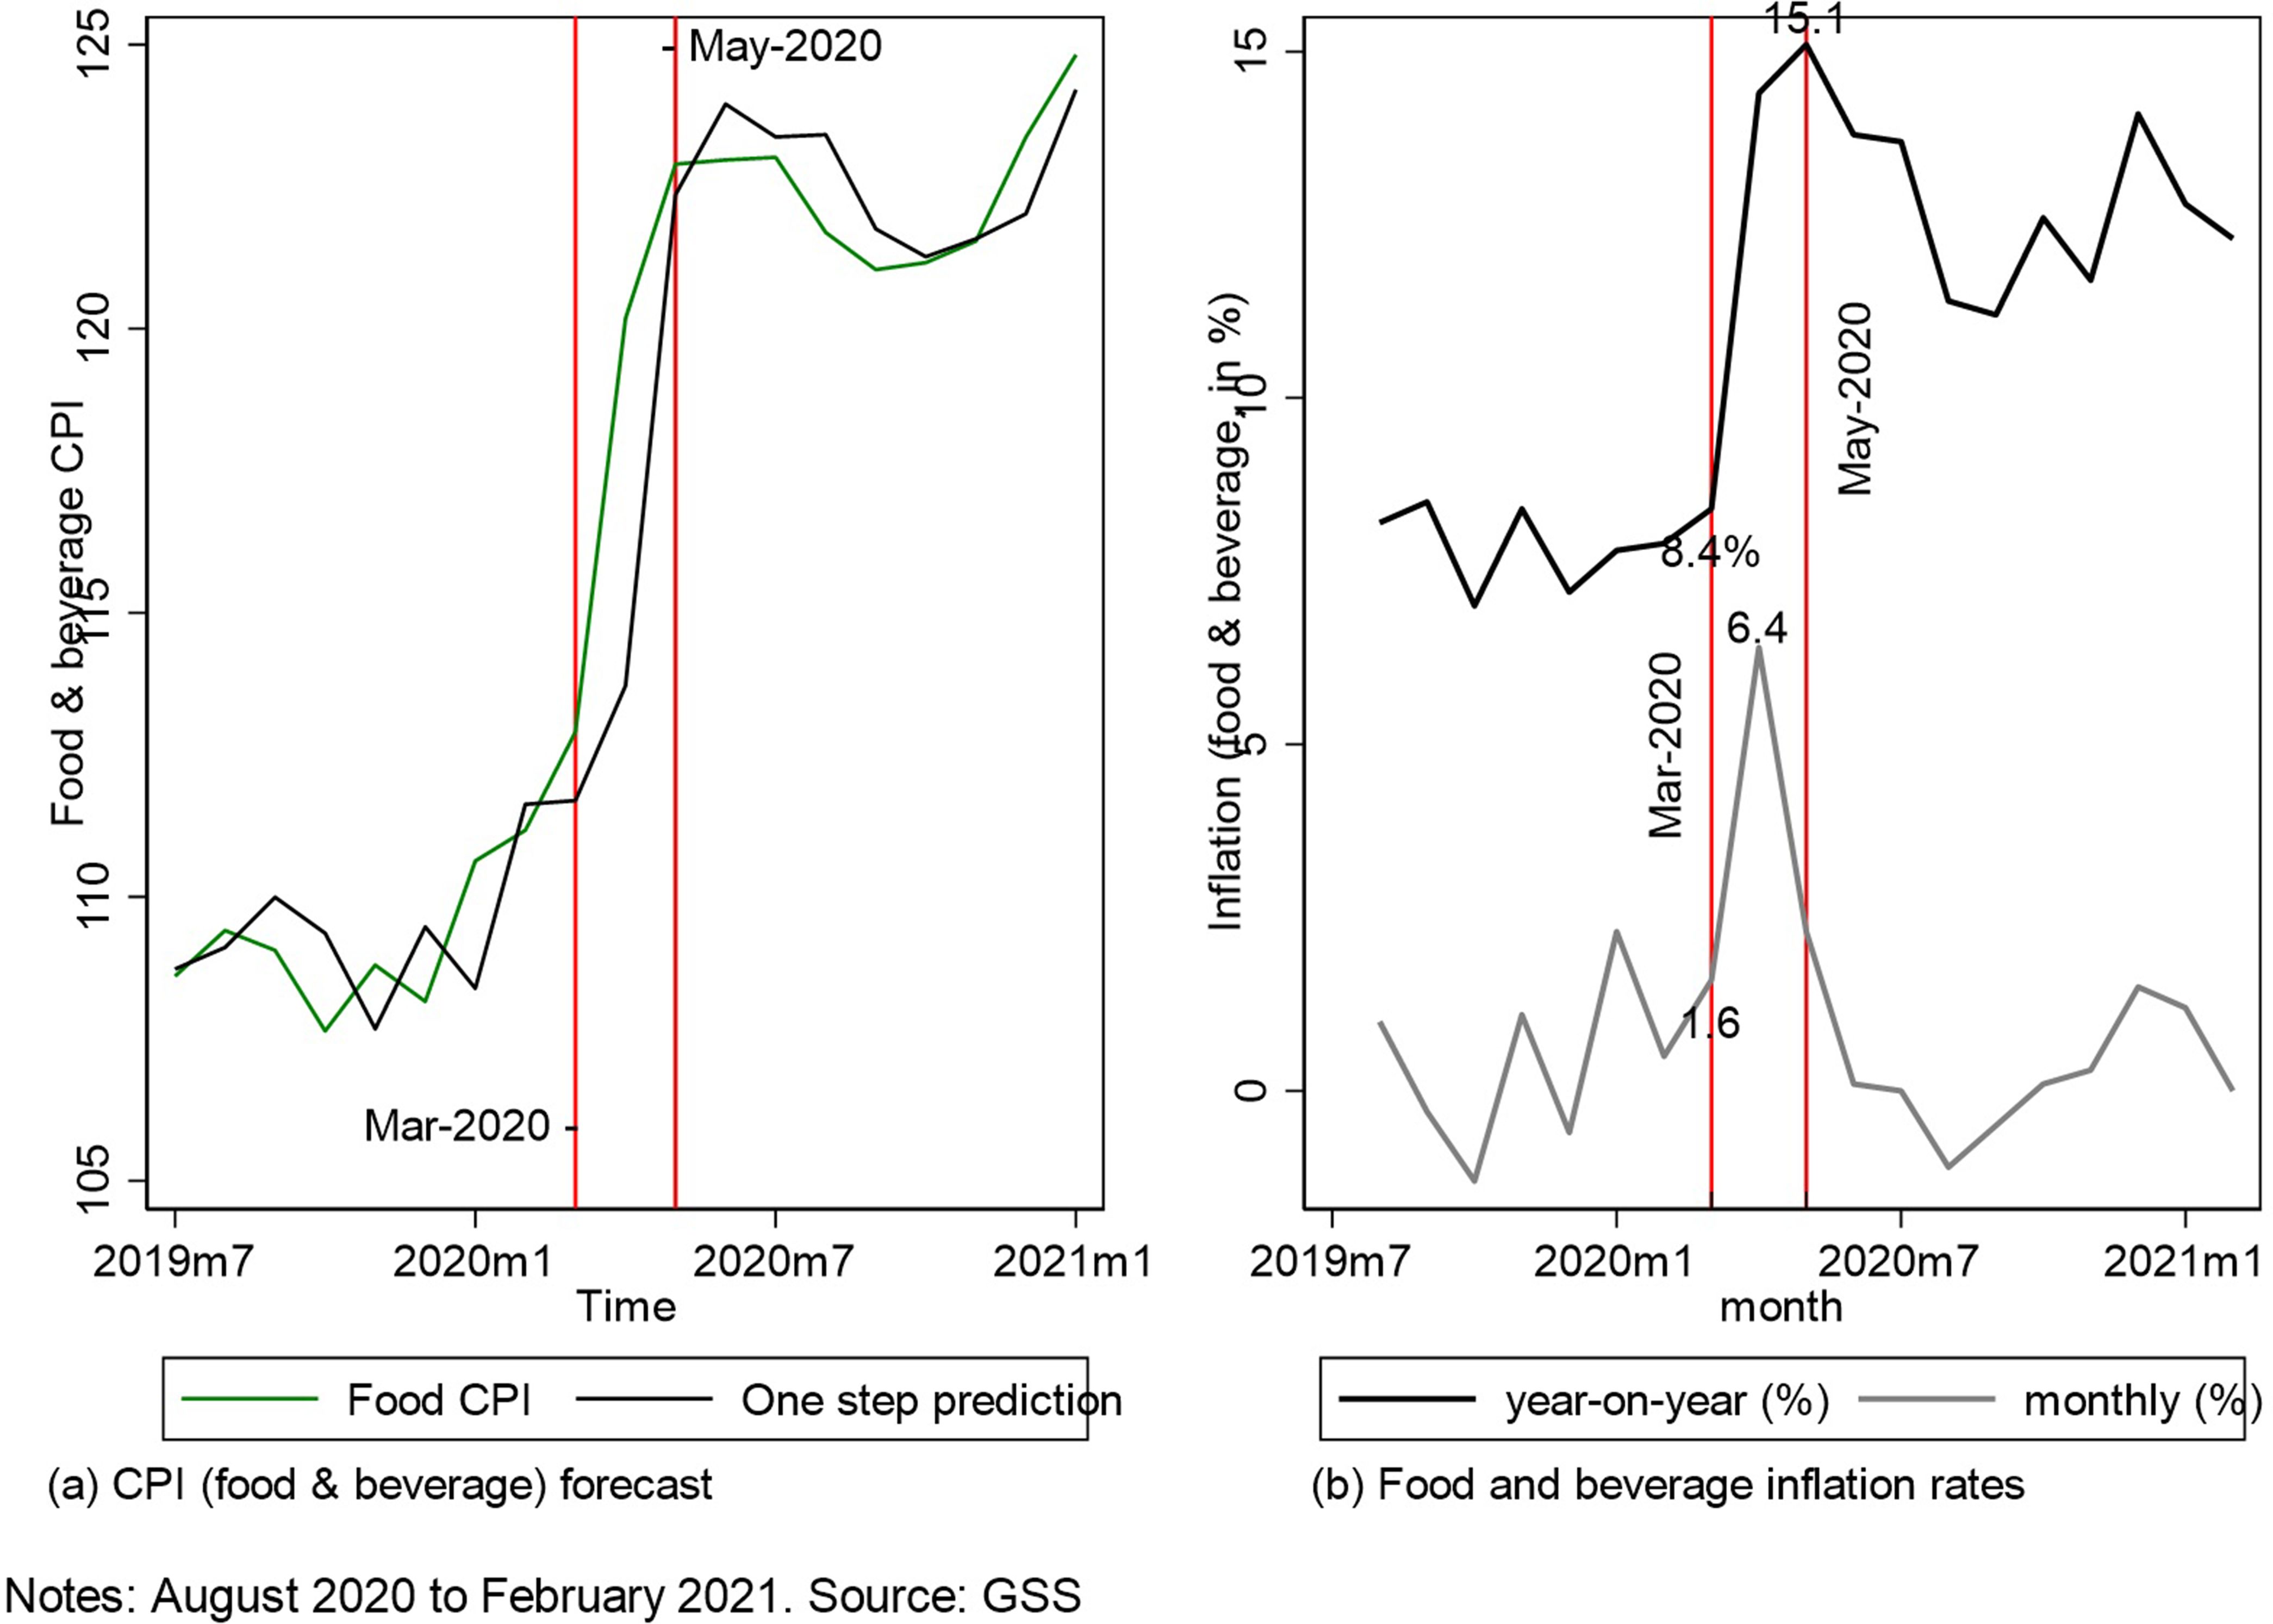
Forecasted versus actual inflation

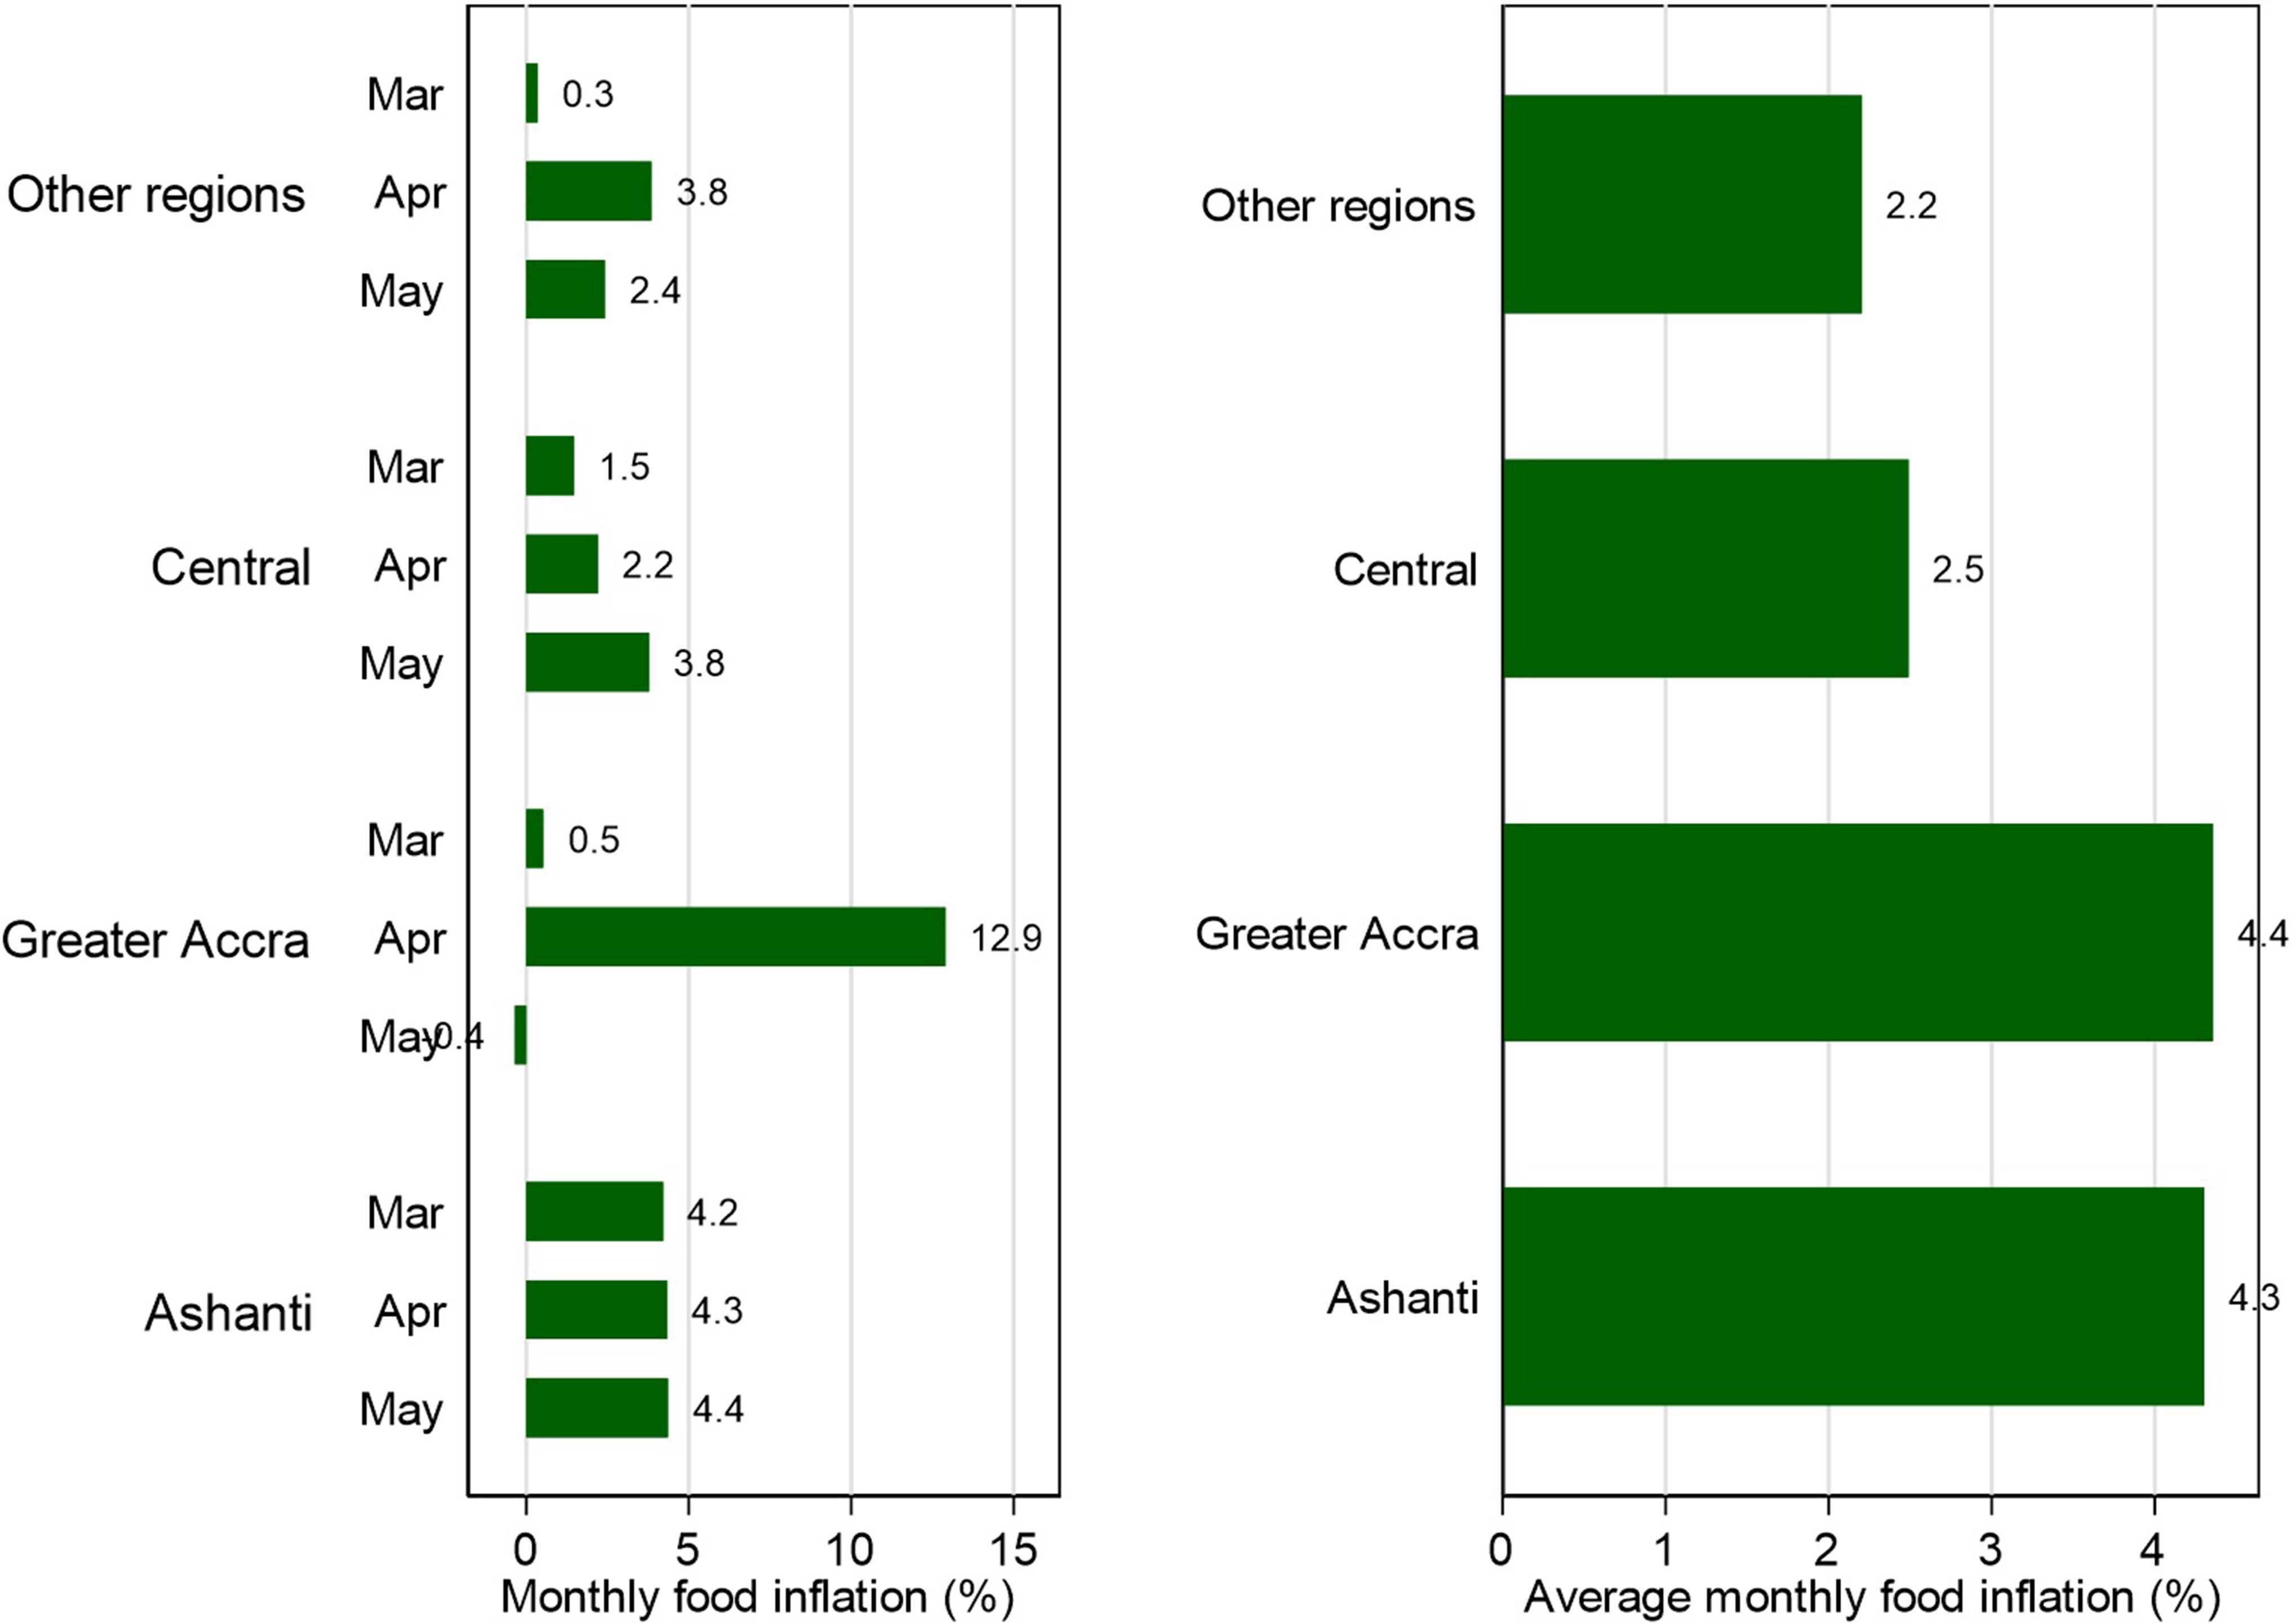
Regional inflation: Locked down versus non-locked down regions. Source: Authors’ calculation based on CPI data retrieved from www.statsghana.gov.gh

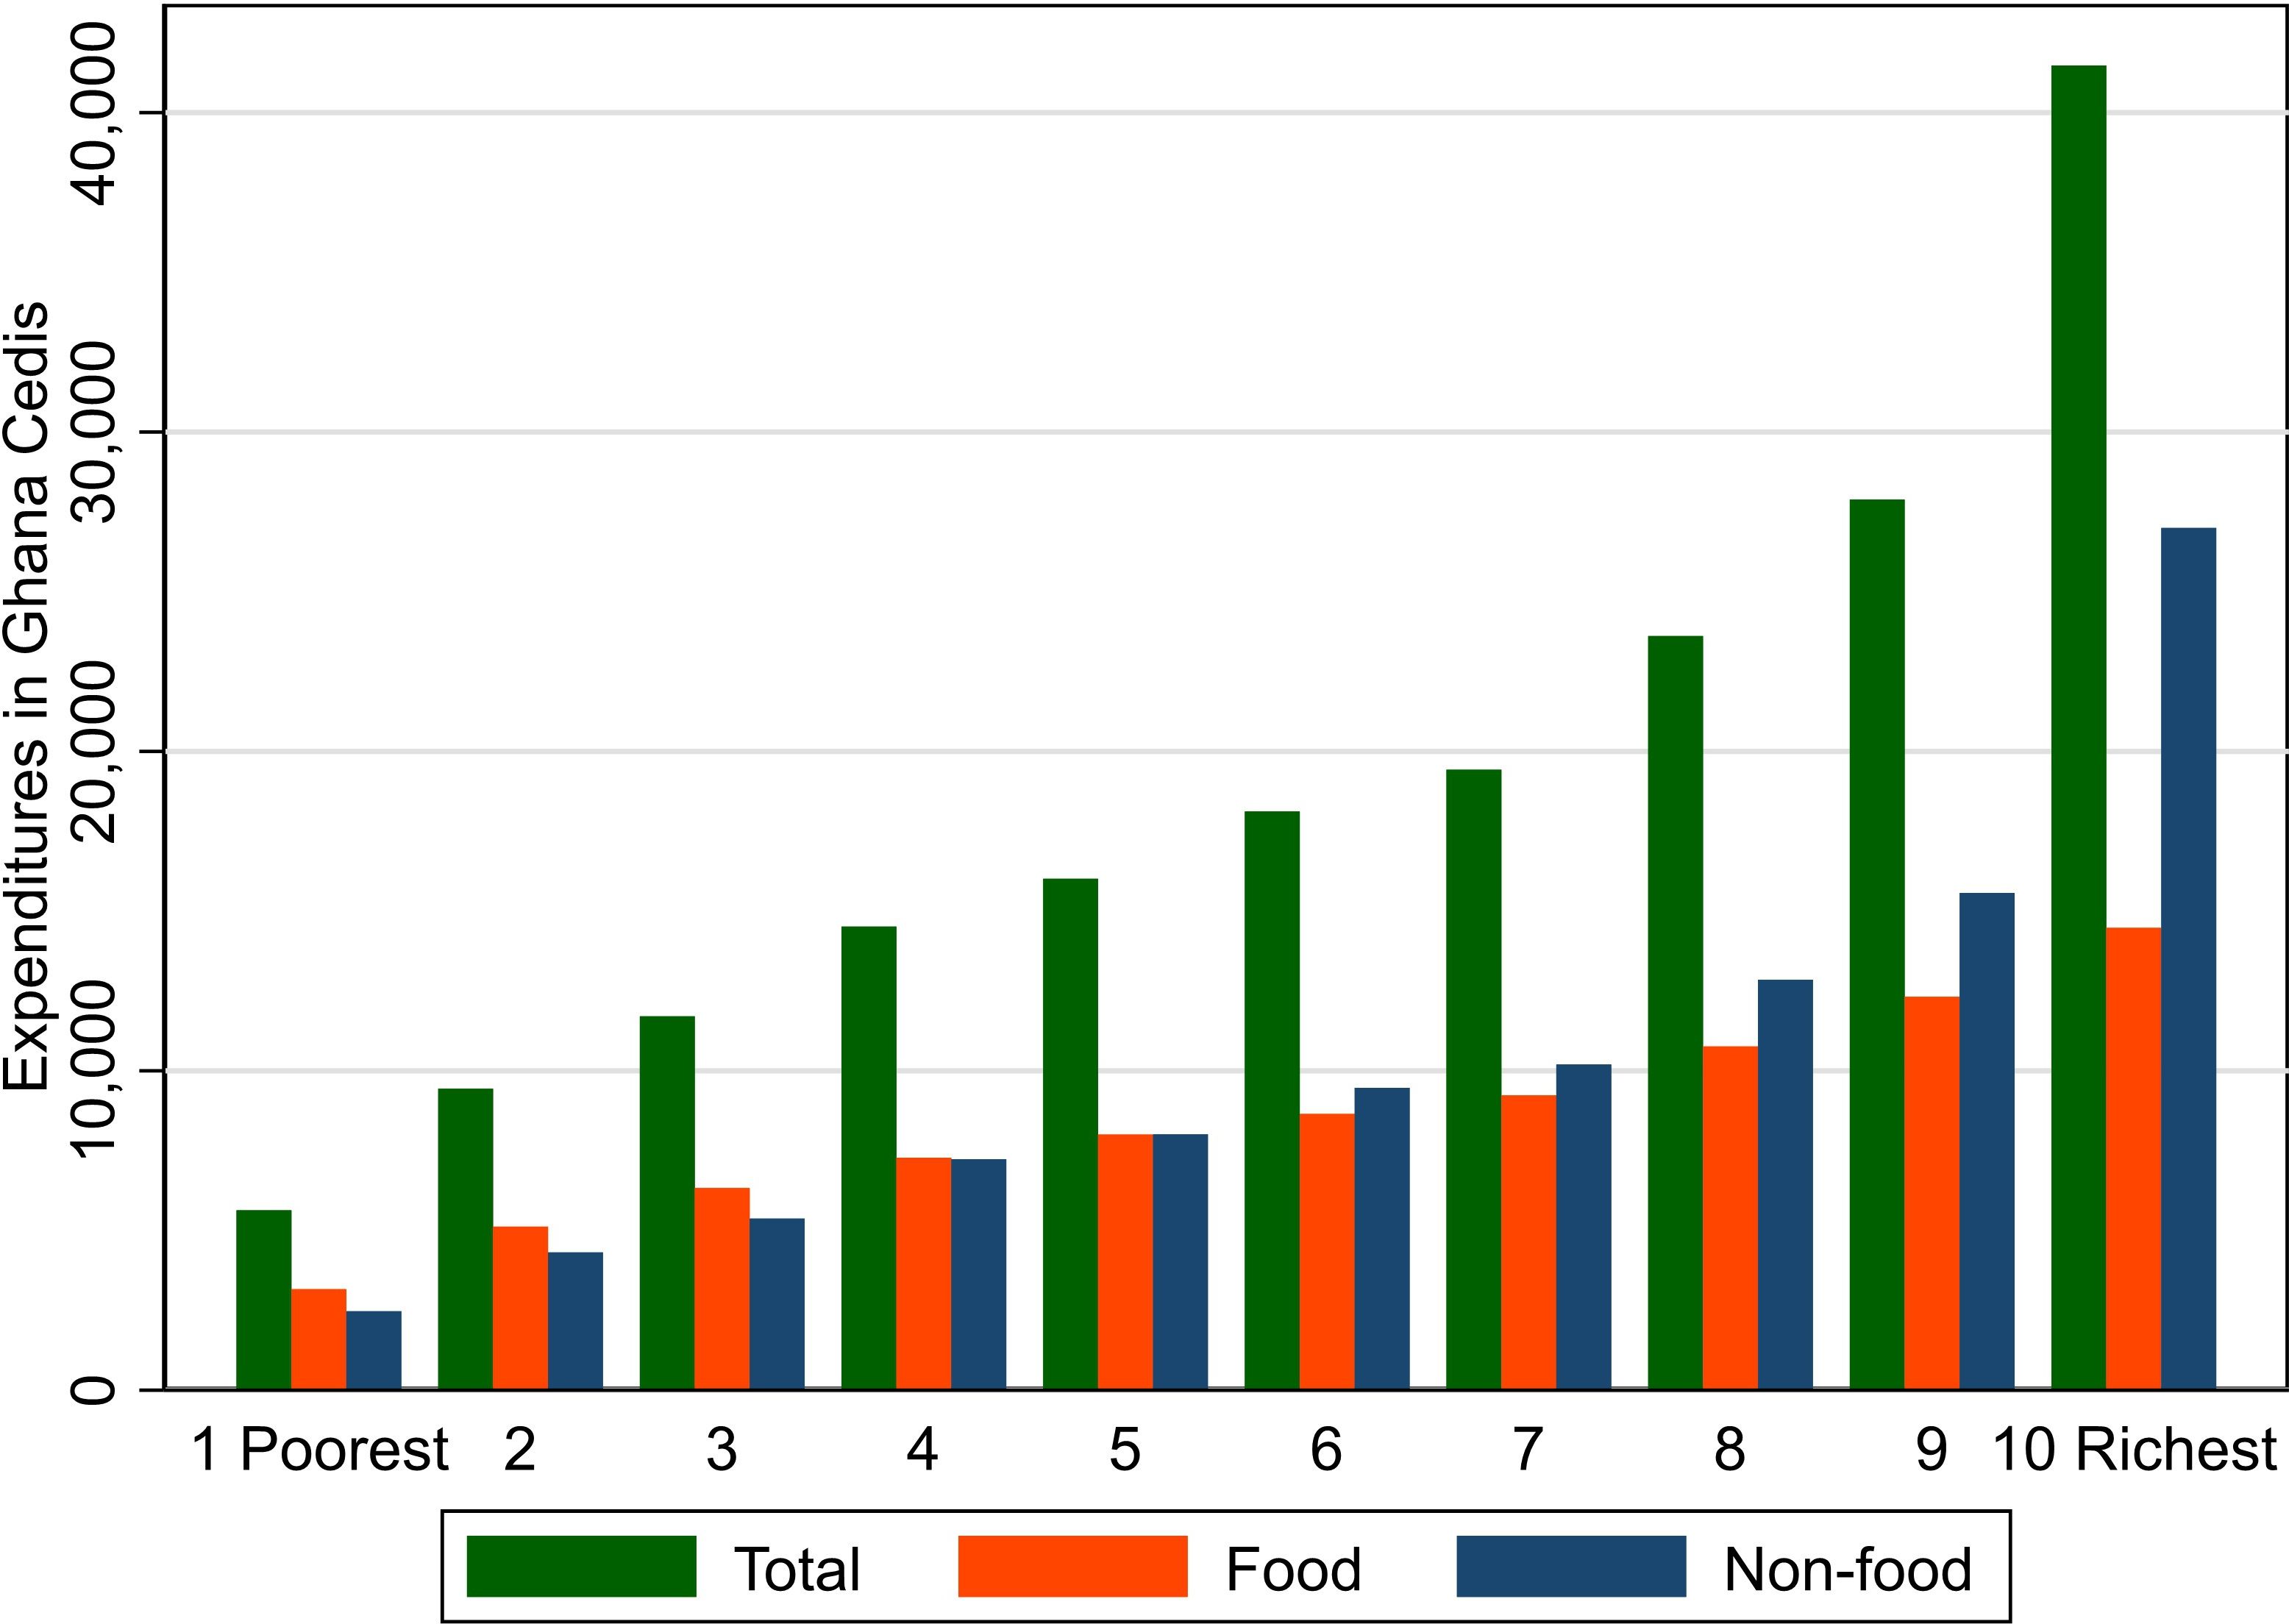
Average expenditures by decile. Source: Authors’ elaboration of GLSS7 survey by GSS

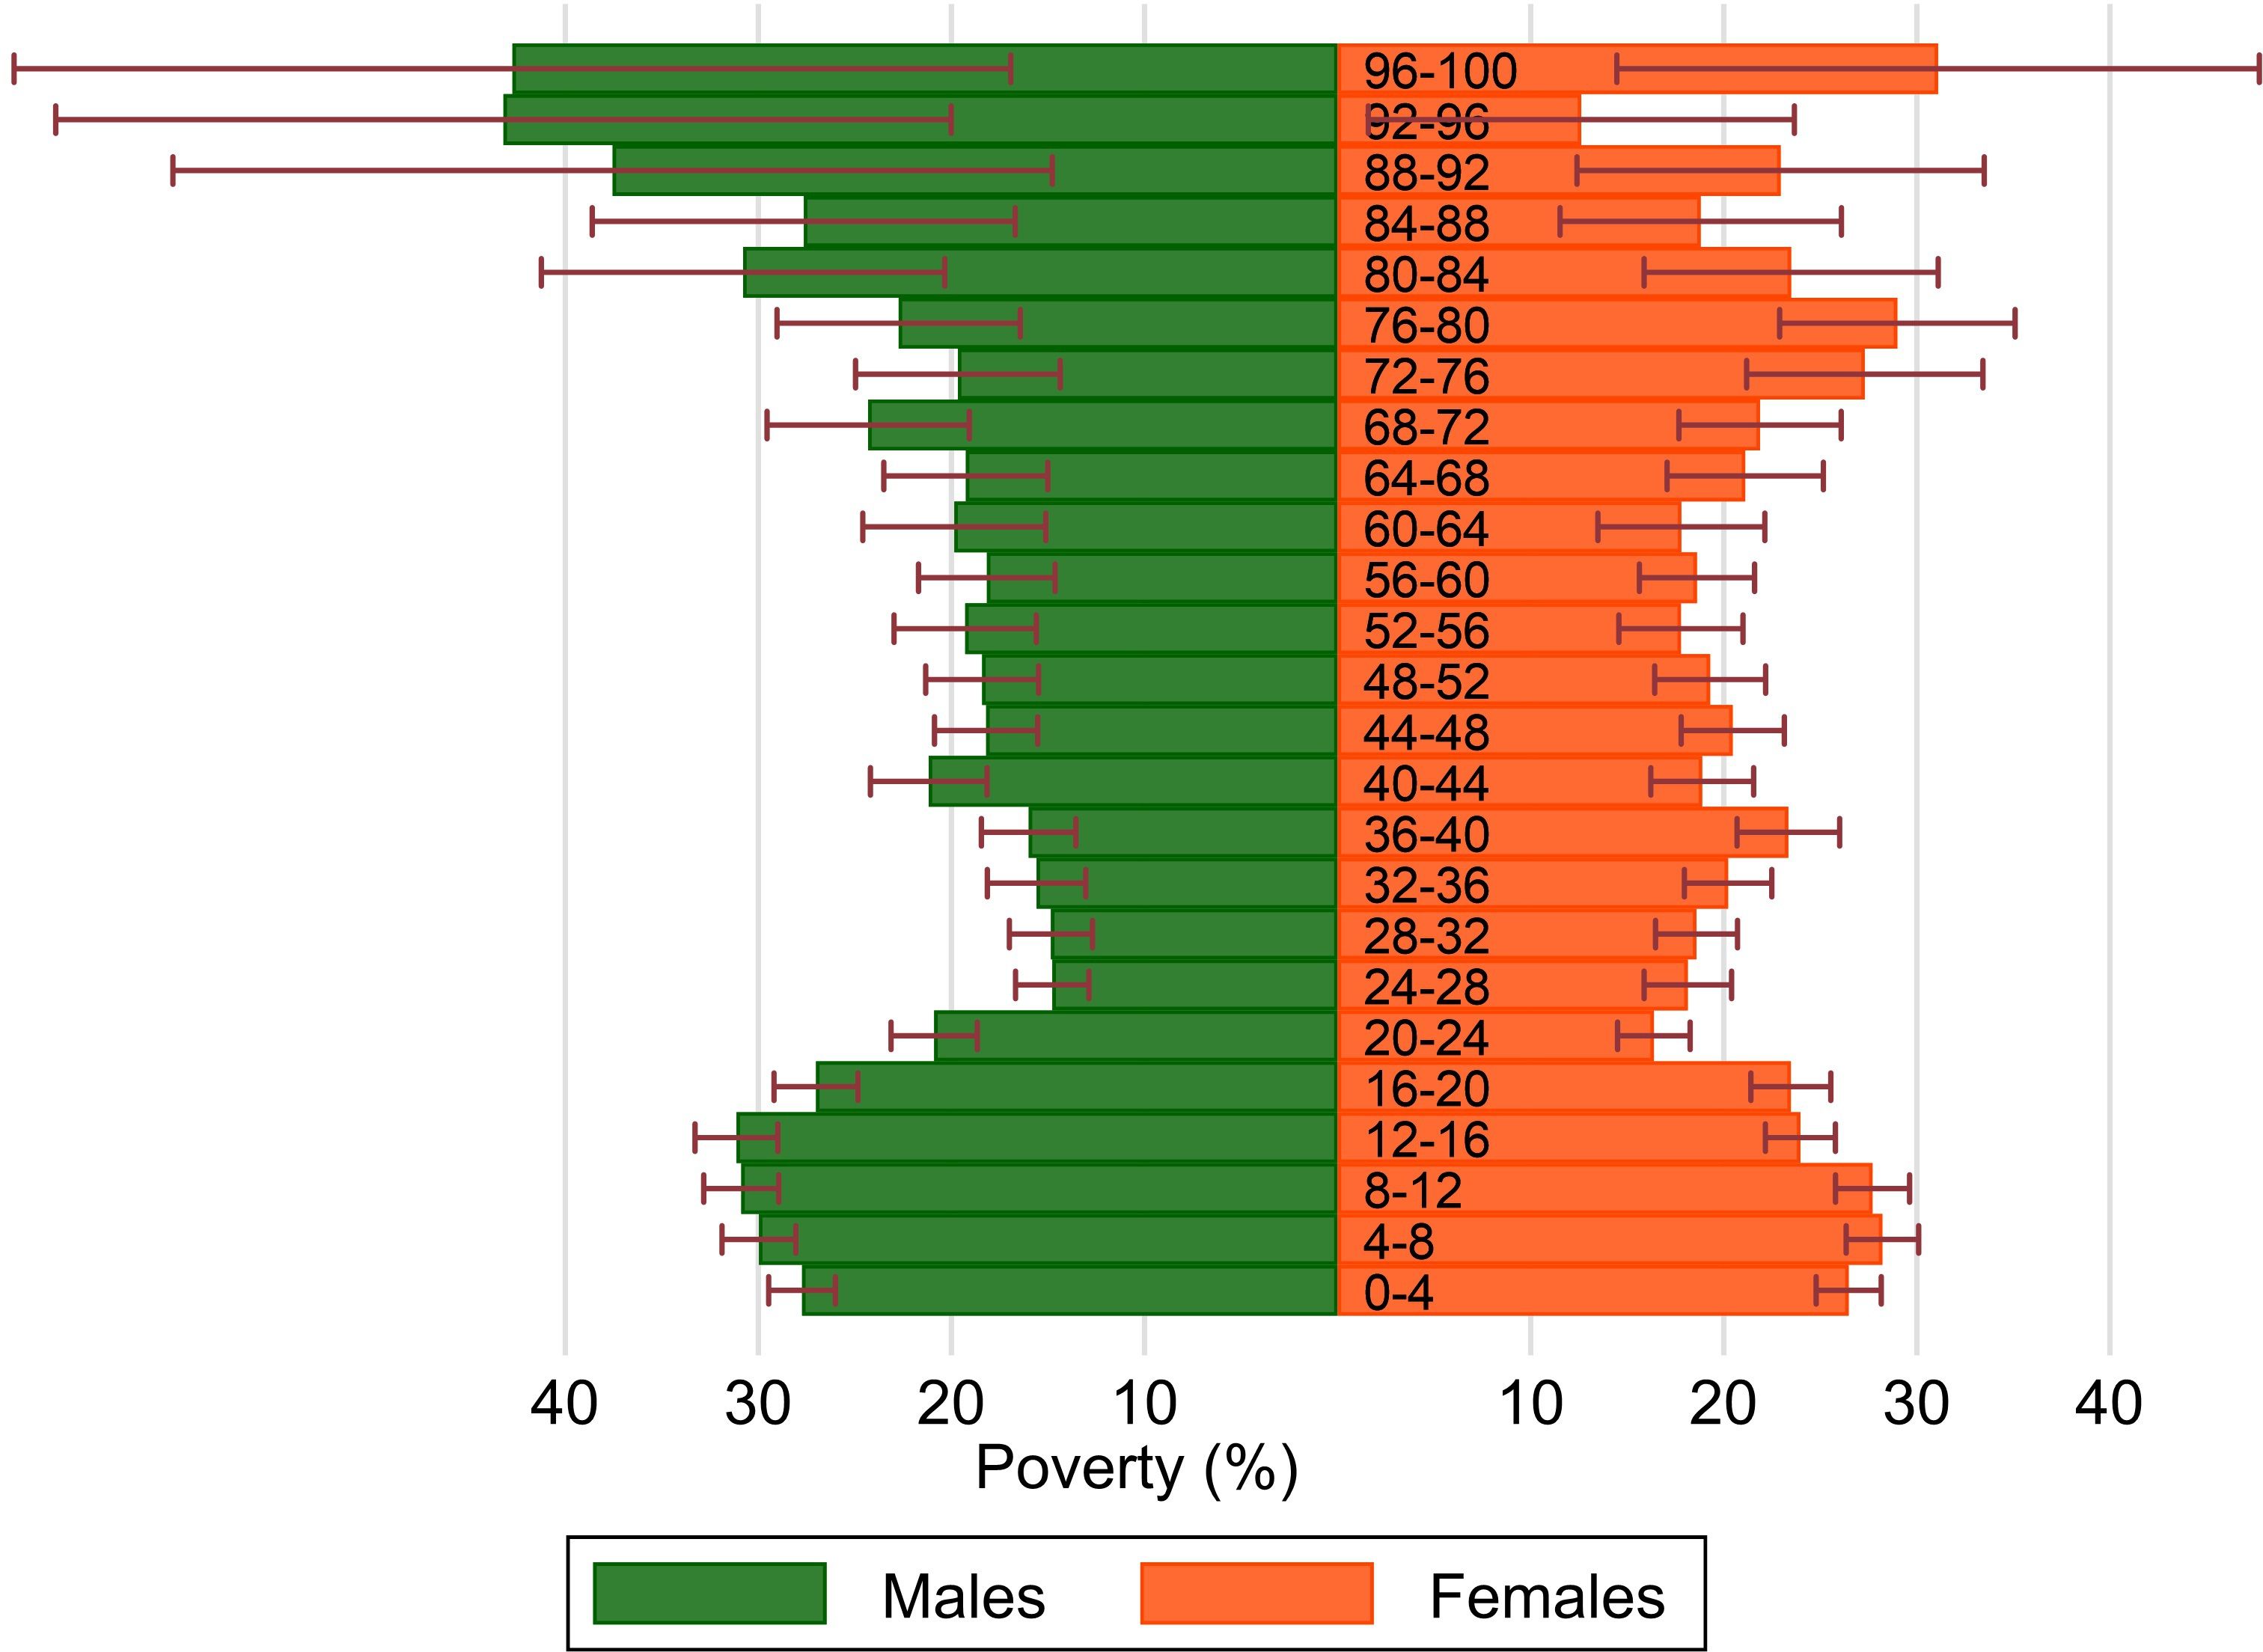
Distribution of poverty rates by age group. Notes: Apart from respondents aged 80 and over, of which there were 170 or fewer in each sex category, all other age categories had at least 183 male respondents and 320 female respondents. There were more than 1,124 respondents under age 40 in each sex category. Source: Authors’ own calculations based on GLSS7 survey by GSS.

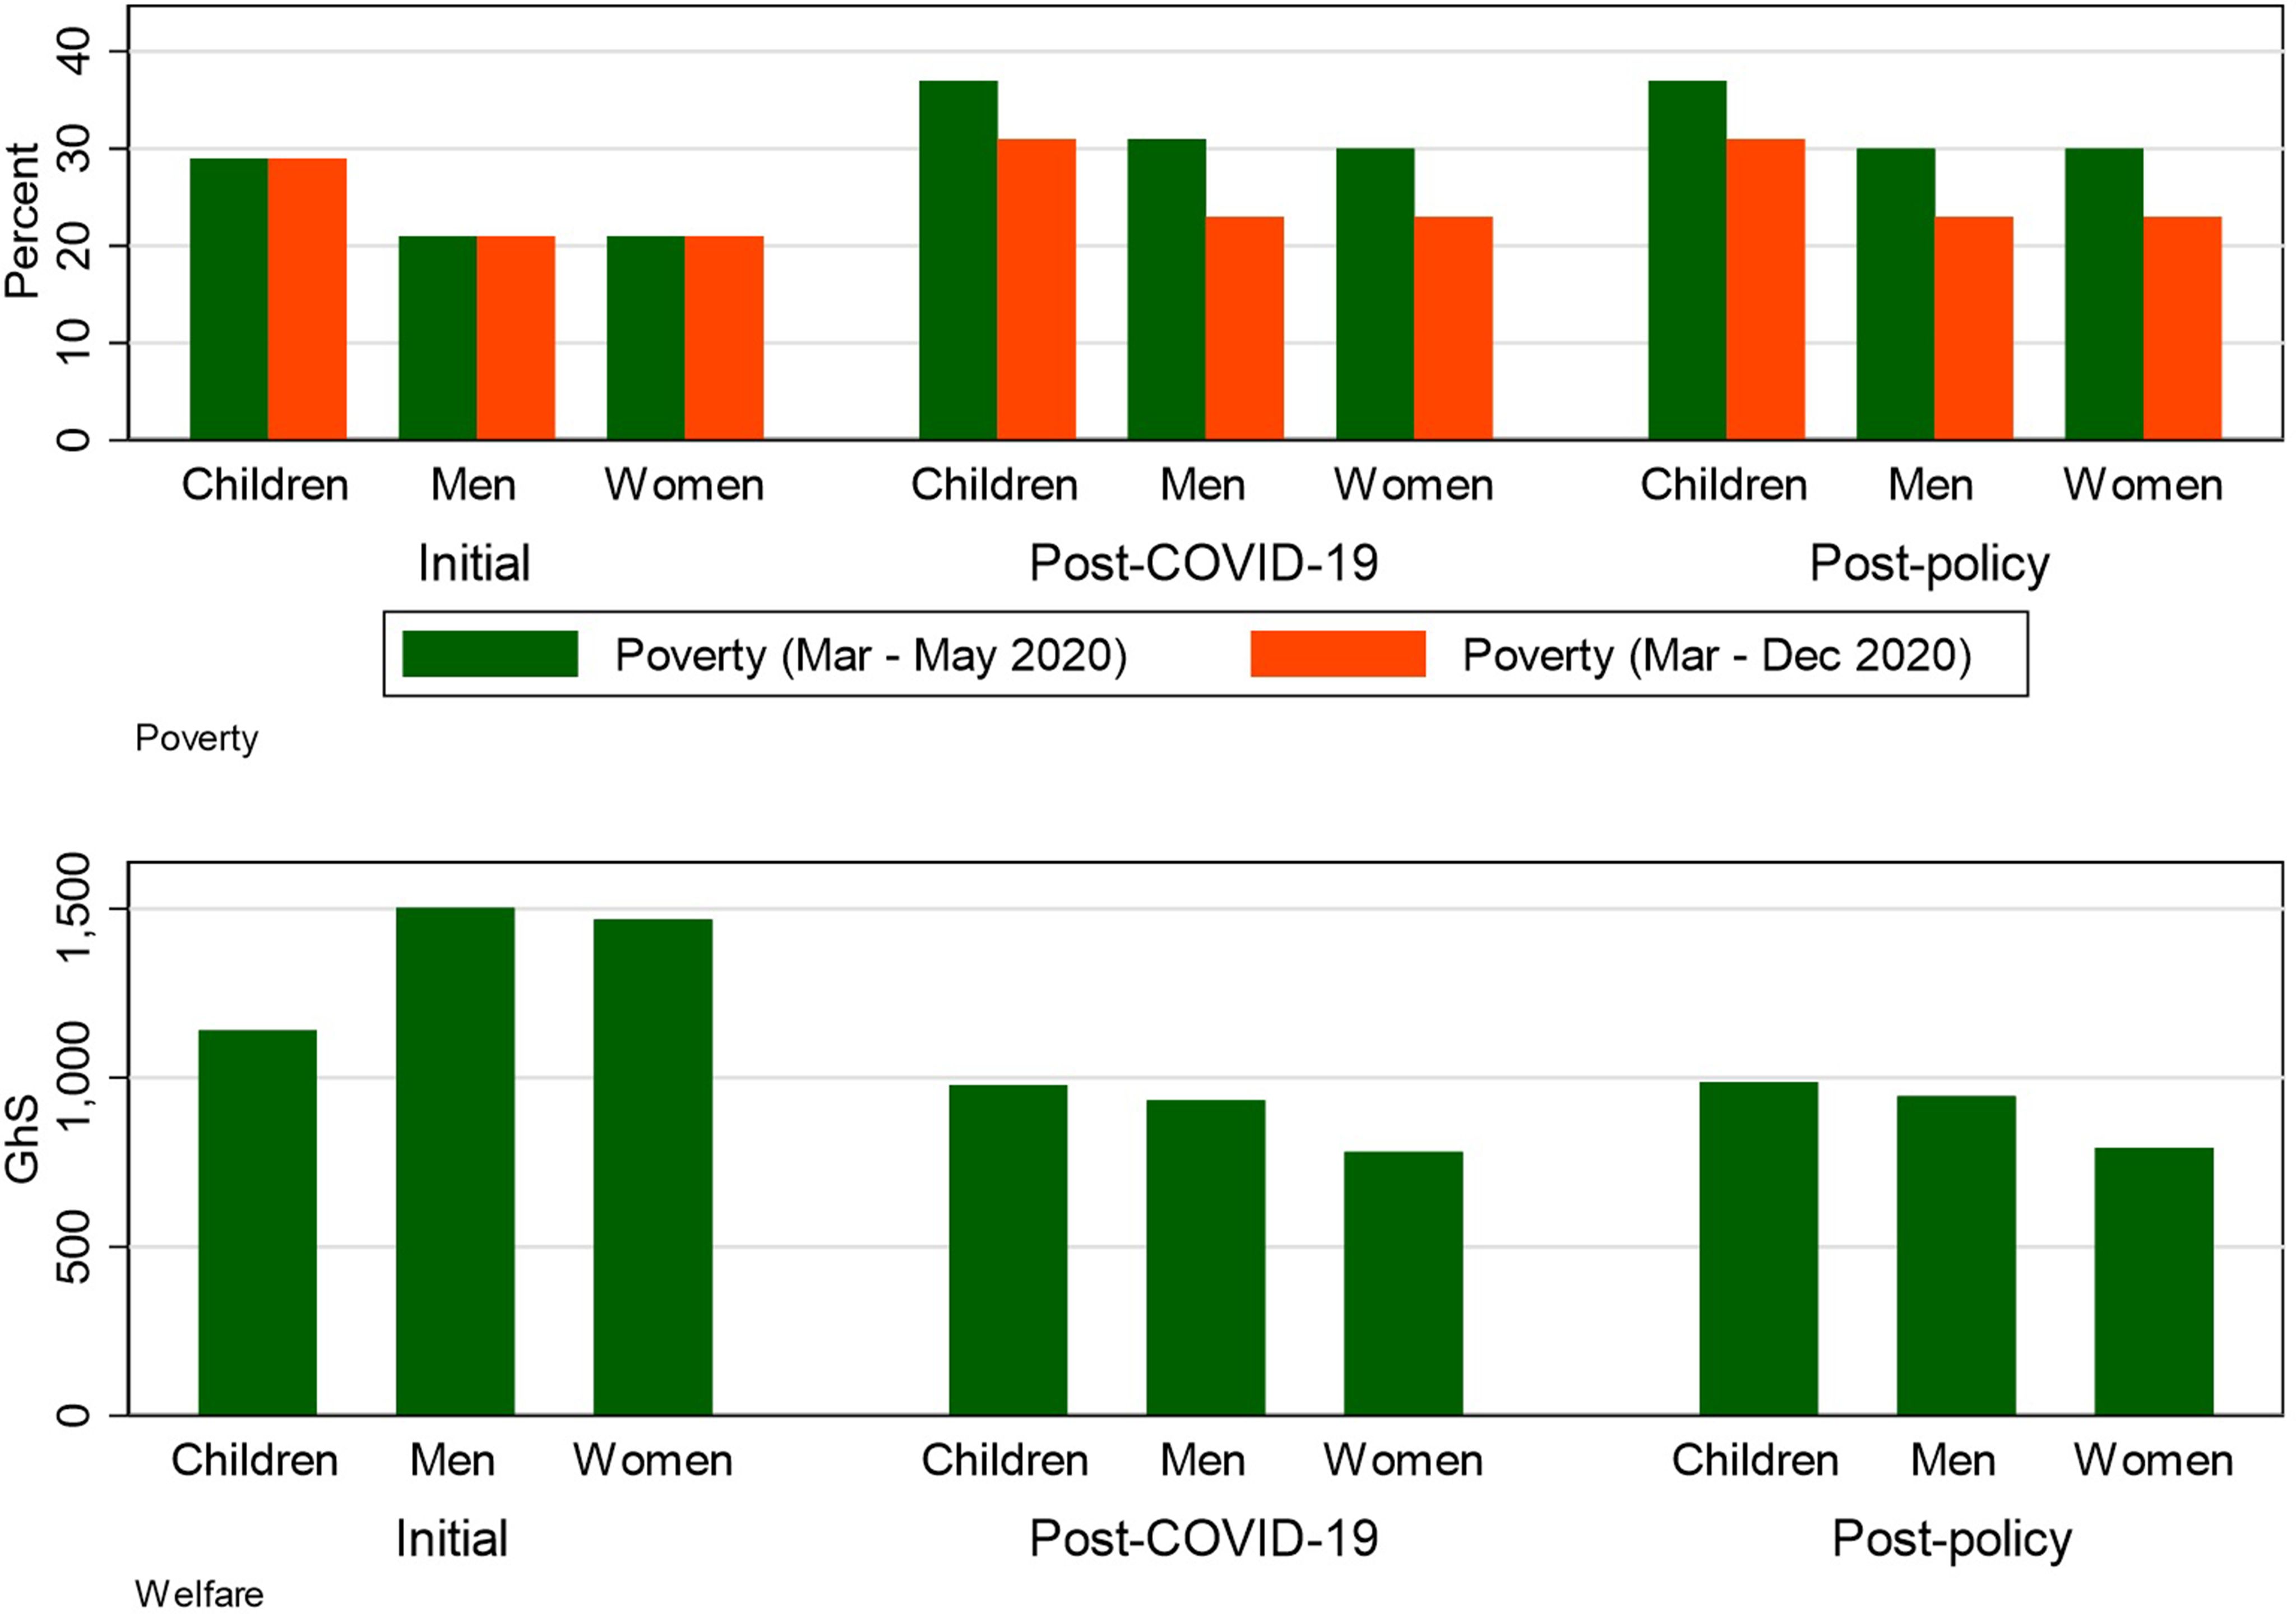
Summary of the impact of COVID-19 and selected policy responses. Notes: [1] “Post-policy” excludes the university fee subsidy. [2]- The bars represent the level of the welfare outcome, with “Initial” being the baseline outcome, “Post-COVID-19” being the level after COVID-19, and “Post-policy” being the level after COVID-19 and the implementation of the policies selected. [3] Poverty line = GHS 2326.596. Source: Authors’ own calculations based on GLSS7 survey by GSS.

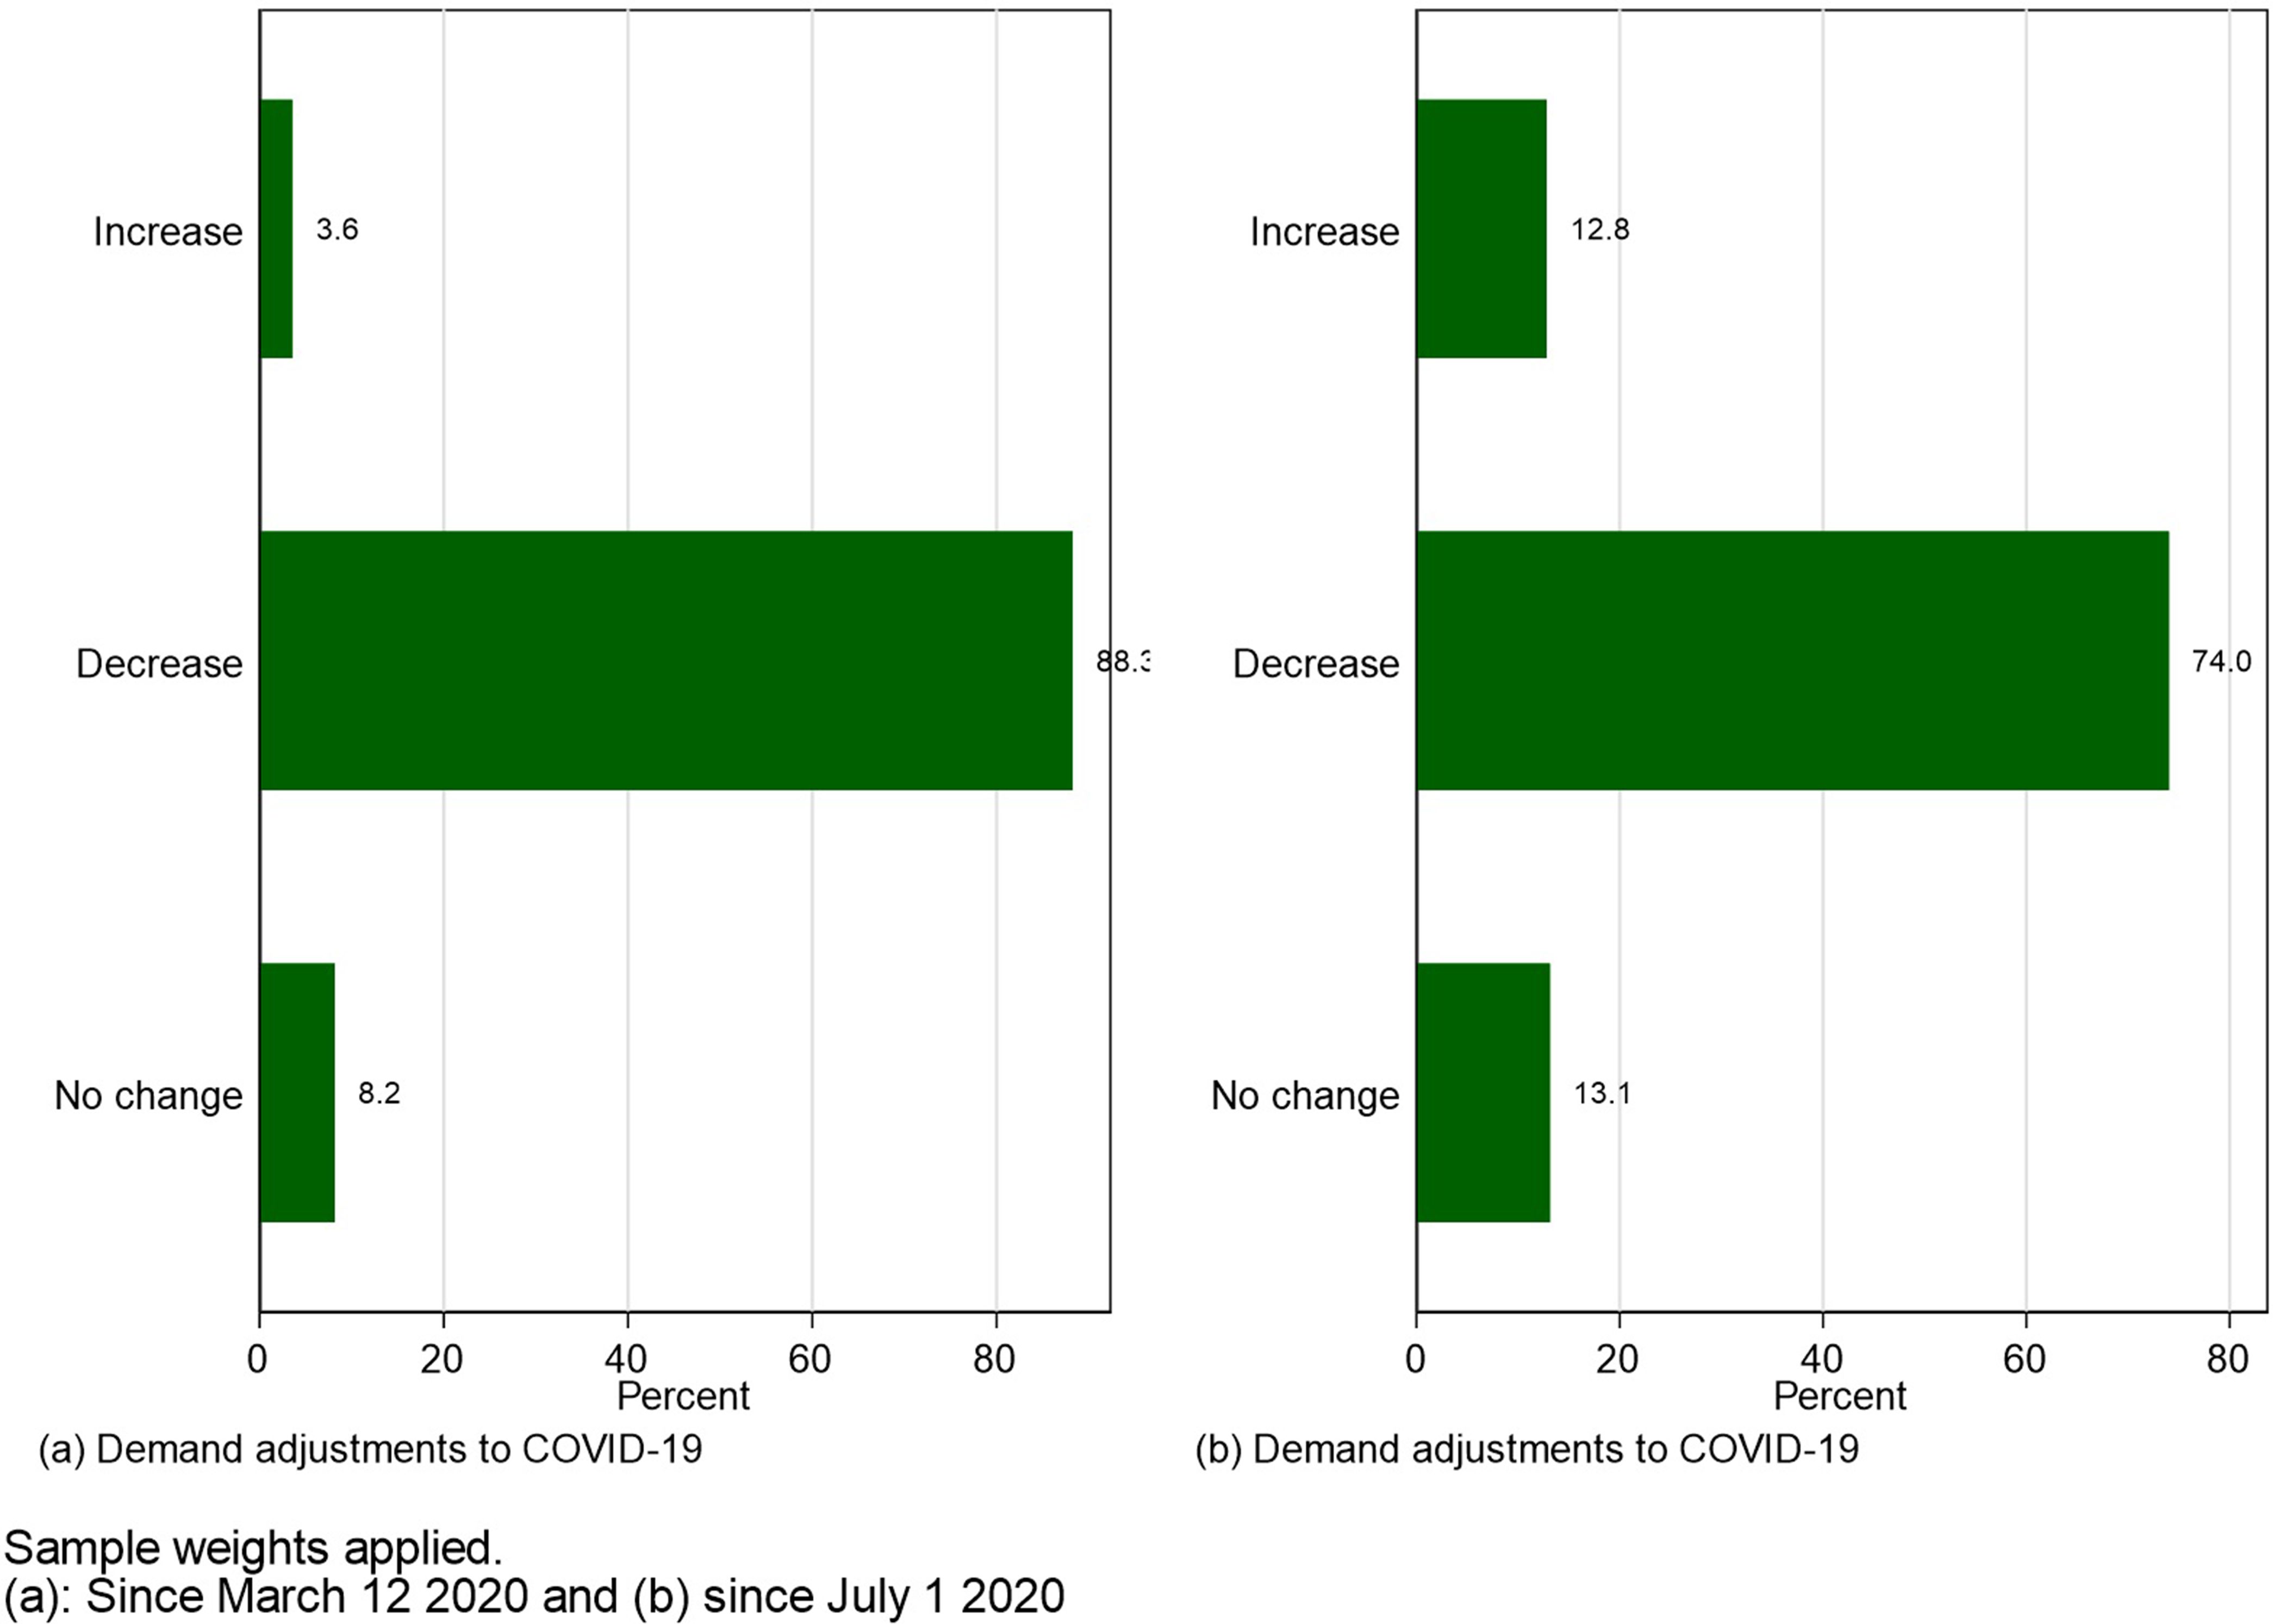
Demand adjustments due to COVID-19. Source: Authors’ own calculations based on GSS Covid-19 rapid surveys

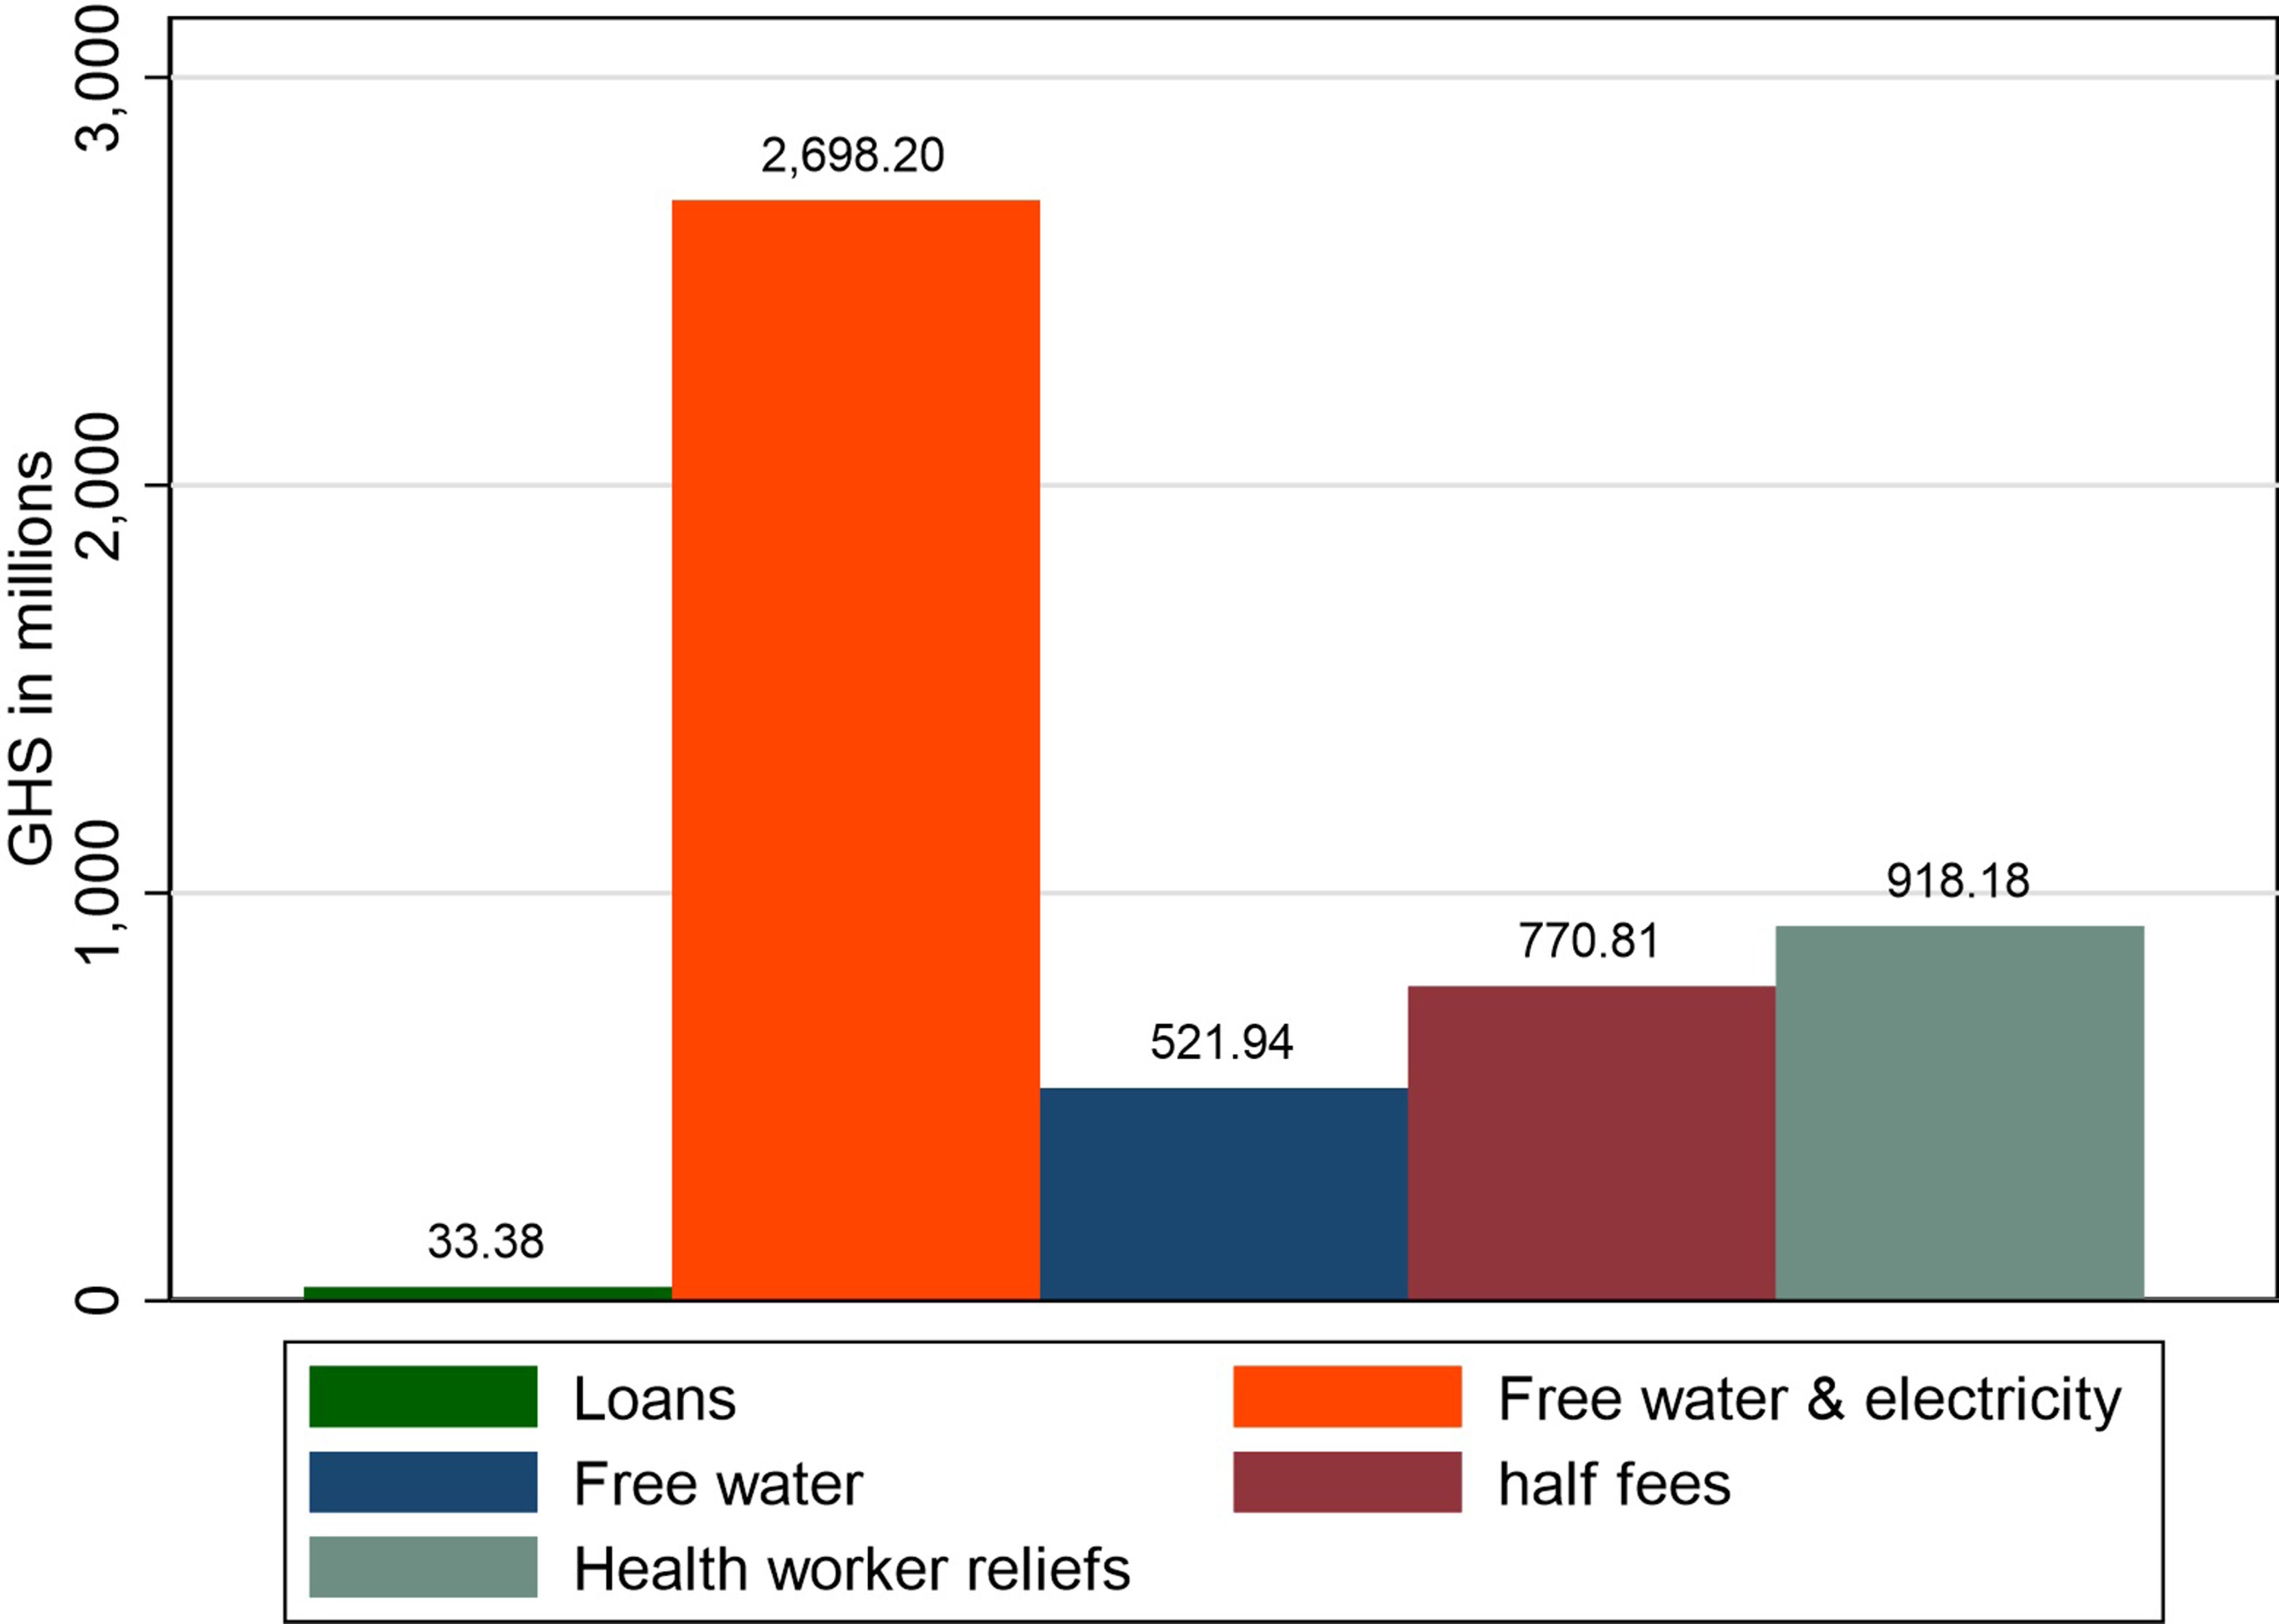
Costs of policies (in GHS). Source: Authors’ own calculations based on GLSS7 survey by GSS.

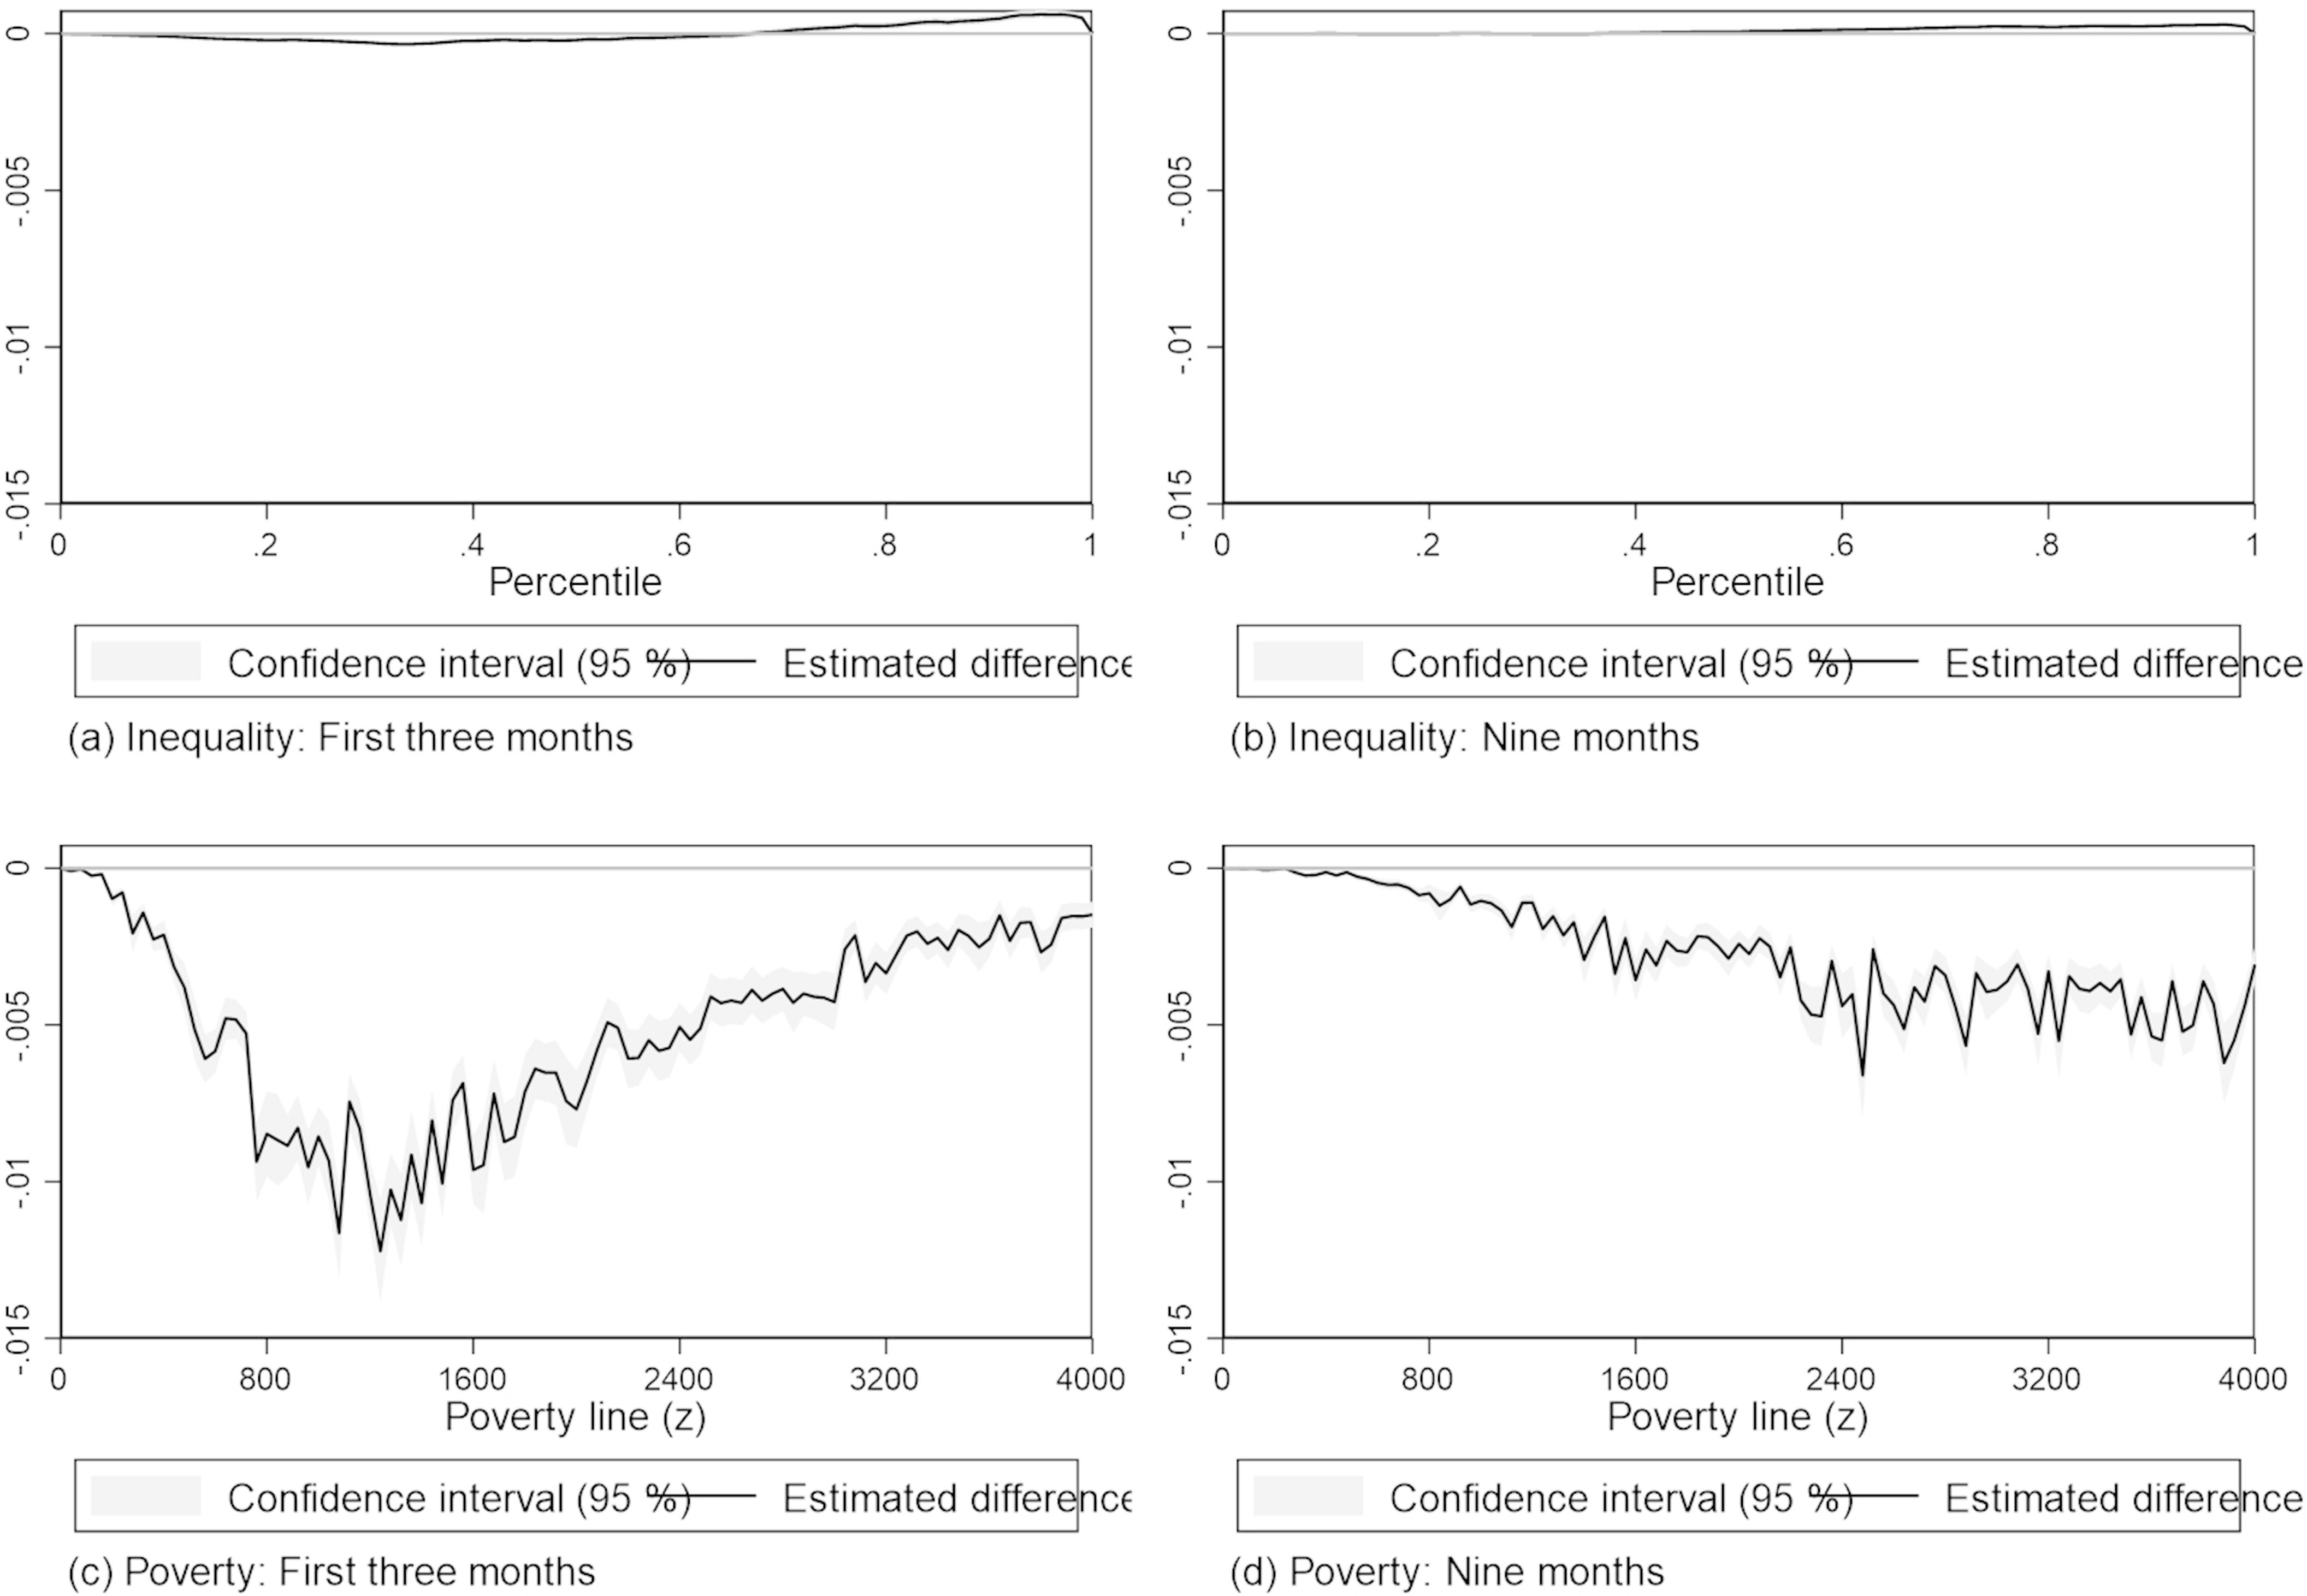
Free water and free electricity for lifeline customers. Source: Authors’ own calculations based on GLSS7 survey by GSS.

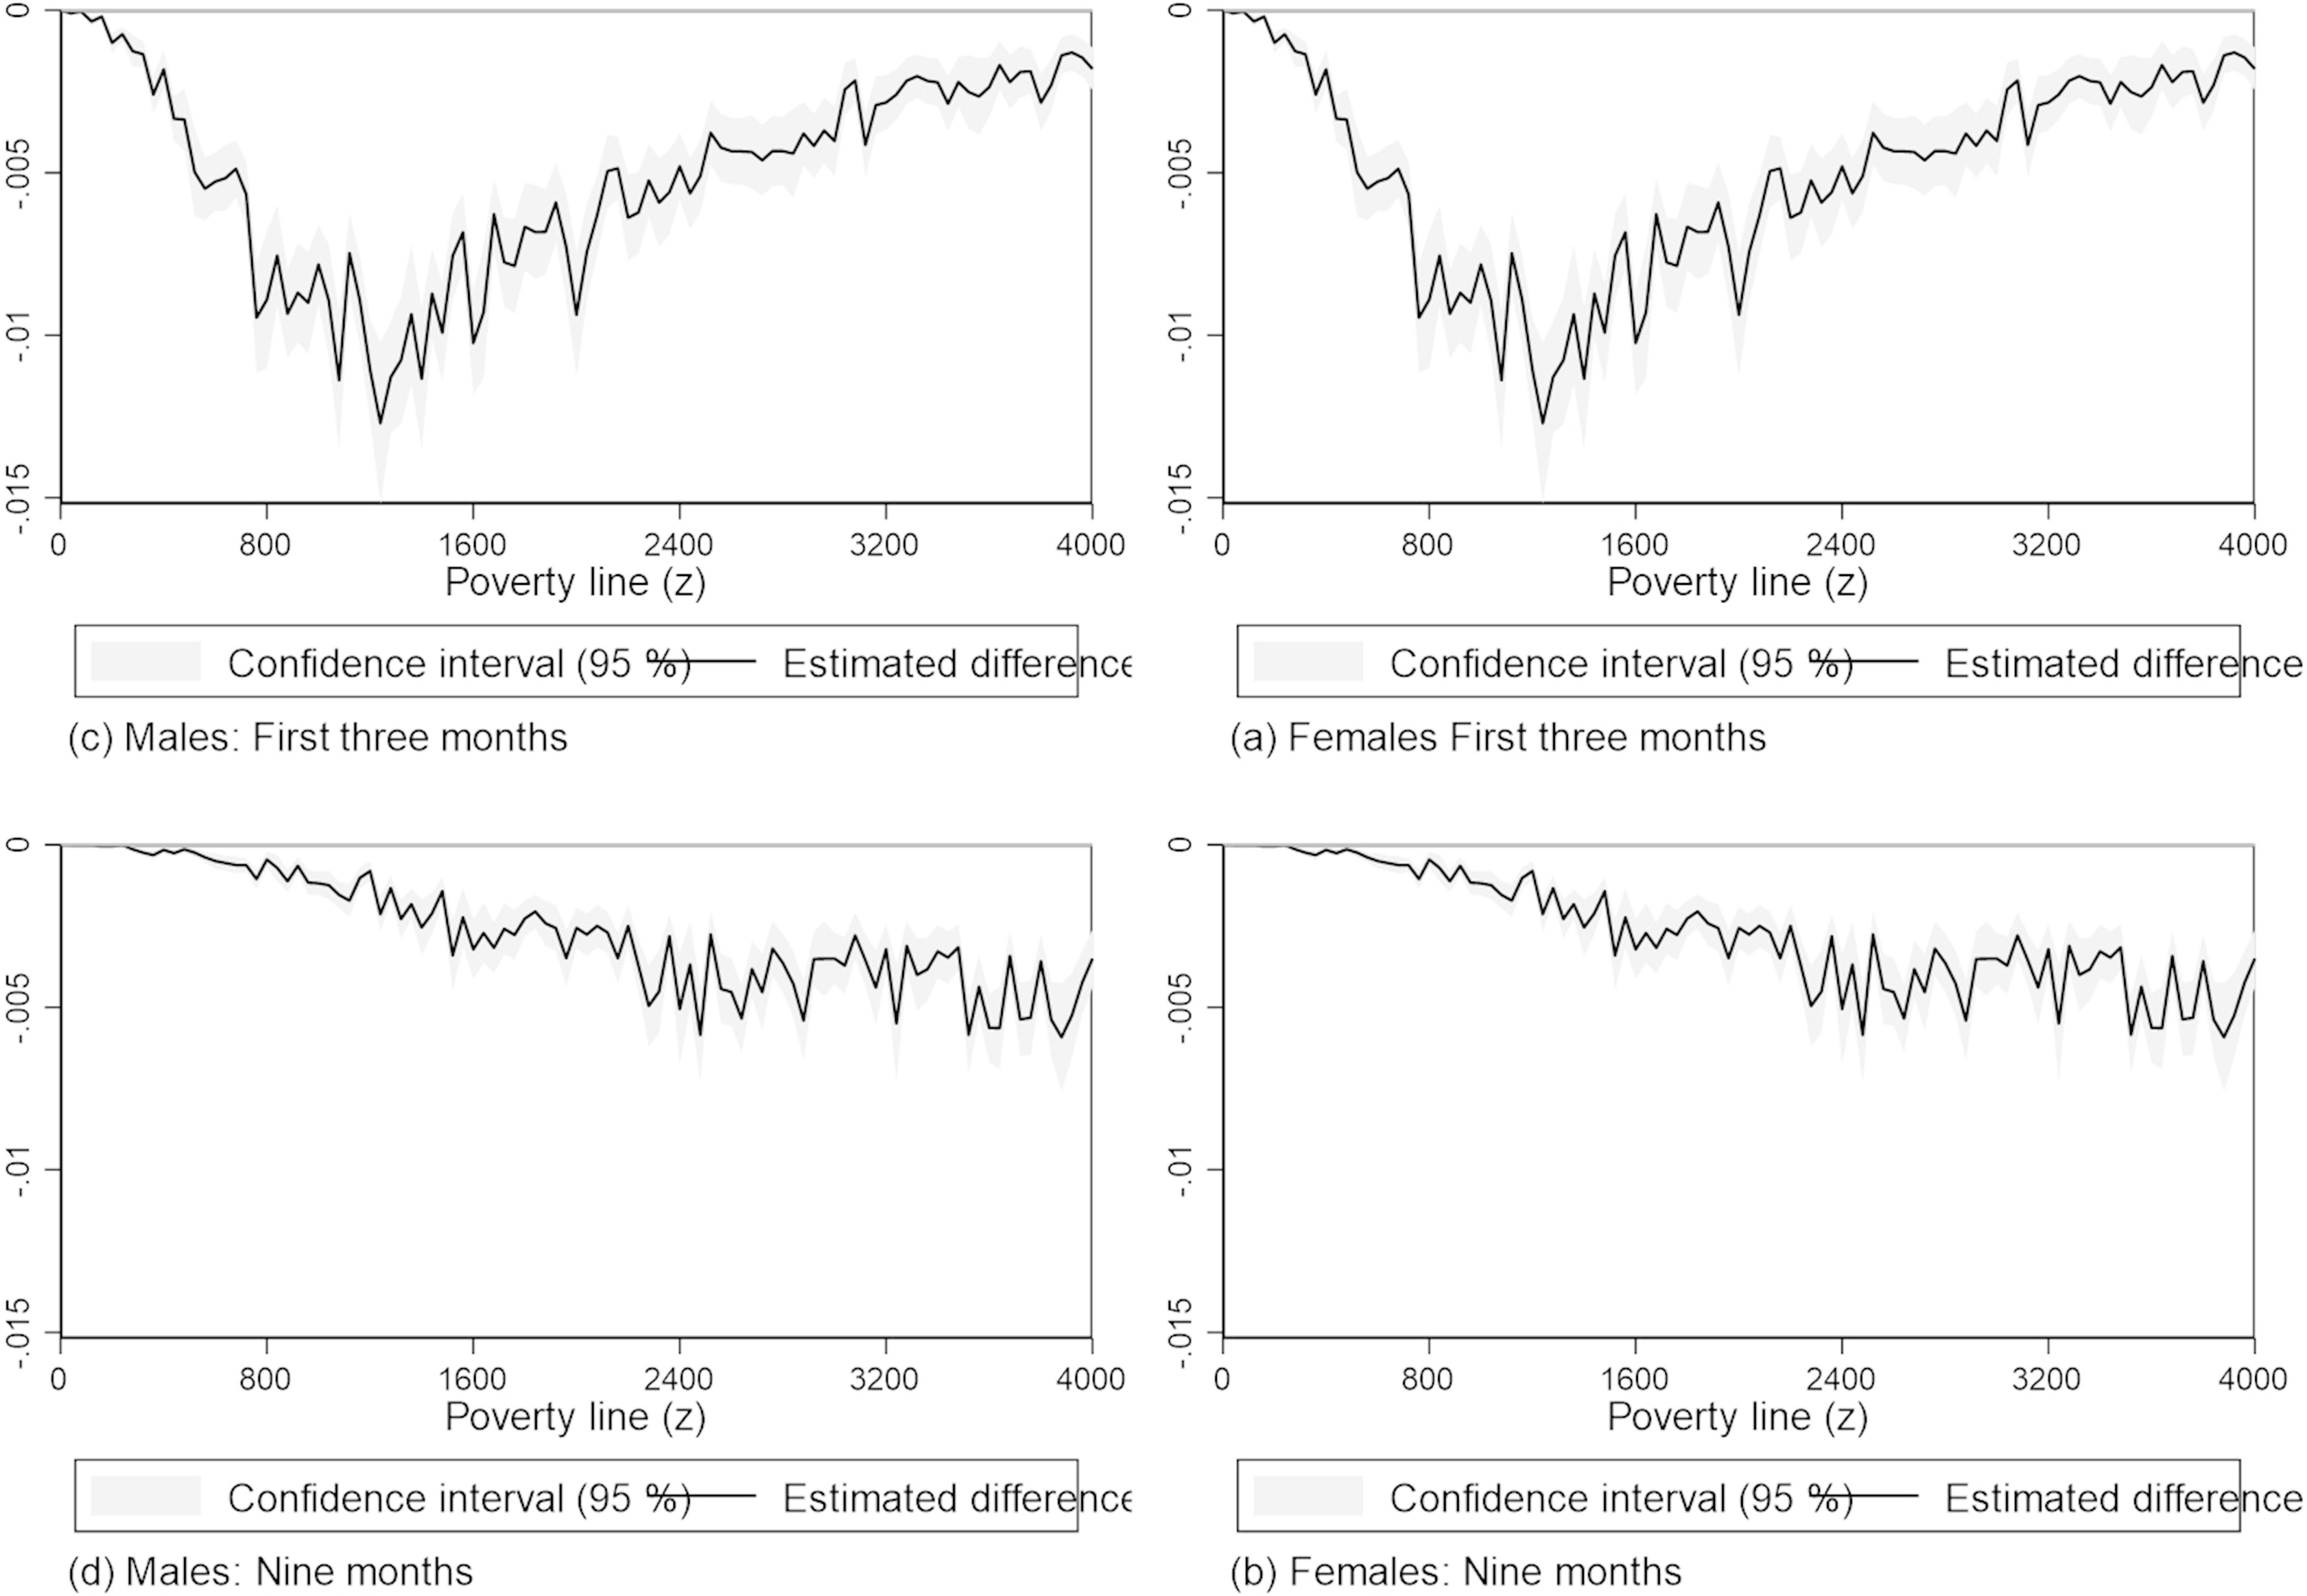
Free water and free electricity for lifeline customers by sex. Note: Comparison made based on the sex of the household head. Source: GLSS7
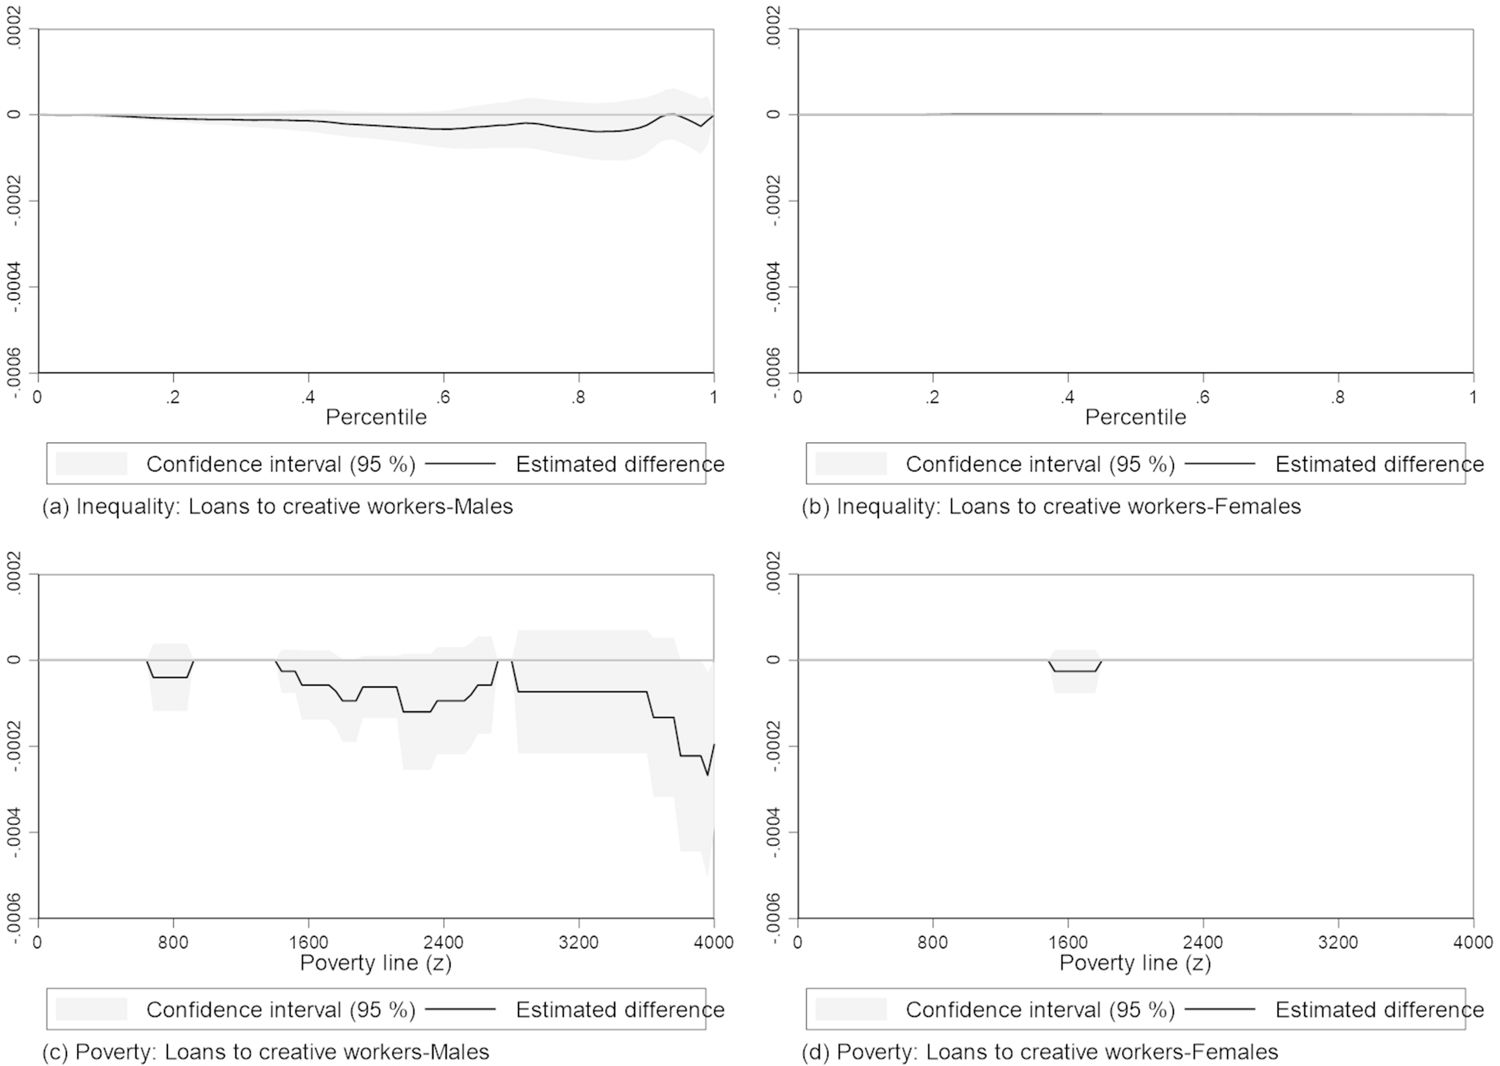
Simulation of loans to creatives. Source: Authors’ own calculations based on GLSS7 survey by GSS.

Simulation of health sector relief package. Source: Authors’ own calculations based on GLSS7 survey by GSS.
Tables
COVID-19’s impact on poverty and inequality – March to May 2020
| Initial | Scenario 1 | Scenario 2 | |||
|---|---|---|---|---|---|
| Outcomes | Level | Level | Change (%) | Level | Change (%) |
| No regional food CPI variation | |||||
| Welfare (GHS) | 1,372.58 | 903.69 | -34.16%** | 830.09 | -39.52%* |
| Number of poor (‘000s) | 7,255 | 10,033 | 2,778*** | 10,335 | 3,080*** |
| Poverty headcount (% points) | 23.41% | 32.37% | 8.96%*** | 33.35% | 9.94%*** |
| Gini | 0.43 | 0.88 | 0.44 | 1.01 | 0.58 |
| Adjusted using average food CPI variation: March to May 2020 | |||||
| Welfare (GHS) | 1,372.58 | 893.97 | -34.87%** | 819.23 | -40.31%** |
| Number of poor (‘000s) | 7,255 | 10,094 | 2,839*** | 10,407 | 3,151*** |
| Poverty headcount (% points) | 23.41% | 32.57% | 9.16%*** | 33.58% | 10.17%*** |
| Gini | 0.43 | 0.88 | 0.45 | 1.02 | 0.59 |
| Adjusted using food CPI variation: April 2020 | |||||
| Welfare (GHS) | 1,372.58 | 874.06 | -36.32%** | 796.99 | -41.93%** |
| Number of poor (‘000s) | 7,255 | 10,191 | 2,936*** | 10,503 | 3,247*** |
| Poverty headcount (% points) | 23.41% | 32.88% | 9.47%*** | 33.89% | 10.48%*** |
| Gini | 0.43 | 0.89 | 0.45 | 1.03 | 0.60 |
-
Notes: [1]- The poverty measurement is the headcount. [2]- * p < 0.10, ** p < 0.05, *** p < 0.01. [3]- Significance levels are reported only for the change statistic. [4]- Welfare is based on per adult equivalent consumption. [5] Poverty line = GHS 2326.596. Source: Authors’ own calculations based on GLSS7 survey by GSS.
Simulated effects of government policies for males and females
| Total | Males | Female | |||||||
|---|---|---|---|---|---|---|---|---|---|
| Initial | Simulated | Change | Initial | Simulated | Change | Initial | Simulated | Change | |
| 50% fee reduction (March–December) | 23.41 | 23.41 | -0.005 | 24.13 | 24.13 | -0.007 | 22.73 | 22.73 | -0.003 |
| Loans for creatives (March–December) | 23.41 | 23.41 | -0.004 | 24.13 | 24.13 | -0.006 | 22.73 | 22.73 | -0.003 |
| Water/electricity subsidies (March–May) | 23.41 | 22.87 | -0.545 | 24.13 | 23.52 | -0.608 | 22.73 | 22.24 | -0.486 |
| Water/electricity subsidies (March–December) | 23.41 | 23.11 | -0.302 | 24.13 | 23.78 | -0.354 | 22.73 | 22.48 | -0.253 |
| Health reliefs (March–December) | 23.41 | 23.40 | -0.008 | 24.13 | 24.13 | -0.006 | 22.73 | 22.72 | -0.011 |
| All three policies (March–December) | 23.41 | 23.10 | -0.315 | 23.41 | 23.10 | -0.315 | 22.73 | 22.46 | -0.267 |
-
Source: Authors’ own calculation based on GLSS7 survey by GSS.
COVID-19 and poverty headcount – men, women and children (March–May 2020)
| Populations | Male | Female | Child | ||||||||||||
|---|---|---|---|---|---|---|---|---|---|---|---|---|---|---|---|
| Initial | Scenario 1 | Policies | Initial | Scenario 1 | Policies | Initial | Scenario 1 | Policies | |||||||
| Groups: | Level | Level | Change | Level | Change | Level | Level | Change | Level | Change | Level | Level | Change | Level | Change |
| Household size | |||||||||||||||
| 1-3 members | 5.47% | 15.43% | 9.95%*** | 5.33% | -0.14%*** | 6.95% | 14.67% | 7.73%*** | 6.62% | -0.32%** | 10.03% | 16.17% | 6.14%*** | 9.31% | -0.72% |
| 4-6 members | 18.76% | 28.78% | 10.02%*** | 18.05% | -0.70%** | 18.27% | 28.24% | 9.97%*** | 17.82% | -0.45%*** | 20.44% | 29.98% | 9.54%*** | 20.10% | -0.33%*** |
| 7-9 members | 35.66% | 45.16% | 9.51%*** | 35.31% | -0.34%* | 35.67% | 45.20% | 9.53%*** | 35.44% | -0.23%* | 37.02% | 45.69% | 8.67%*** | 36.83% | -0.19%* |
| >9 members | 57.02% | 65.49% | 8.47%*** | 57.02% | 0.00% | 55.14% | 62.32% | 7.18%*** | 55.14% | 0.00% | 58.06% | 65.66% | 7.60%*** | 58.06% | 0.00% |
| Sex of household head | |||||||||||||||
| Male head | 21.11% | 30.79% | 9.68%*** | 20.74% | -0.37%** | 25.23% | 35.23% | 10.01%*** | 24.87% | -0.36%*** | 31.99% | 41.23% | 9.24%*** | 31.72% | -0.27%*** |
| Female head | 18.69% | 29.06% | 10.37%*** | 18.07% | -0.63%** | 14.62% | 22.07% | 7.45%*** | 14.31% | -0.31%*** | 21.13% | 28.67% | 7.54%*** | 20.79% | -0.34%* |
| Sector | |||||||||||||||
| Agriculture forestry & fishing | 40.17% | 50.34% | 10.17%*** | 39.97% | -0.20%** | 42.80% | 52.69% | 9.89%*** | 42.57% | -0.23%** | 48.40% | 57.39% | 8.99%*** | 48.31% | -0.09%** |
| Mining & quarrying | 12.58% | 2.20% | -10.37%* | 5.39% | -7.18% | 14.70% | 1.95% | -12.76%** | 10.60% | -4.10% | 19.33% | 4.42% | -14.91%** | 14.75% | -4.58% |
| Manufacturing | 9.23% | 16.22% | 6.99%*** | 9.01% | -0.22% | 11.02% | 16.40% | 5.38%*** | 10.35% | -0.67%* | 15.99% | 21.74% | 5.75%*** | 15.12% | -0.87% |
| Other manufacturing | 17.17% | 19.40% | 2.23% | 17.17% | 0.00% | 14.92% | 14.63% | -0.28% | 14.92% | 0.00% | 25.39% | 25.75% | 0.36% | 25.39% | 0.00% |
| Construction | 7.29% | 11.86% | 4.57%*** | 7.24% | -0.05% | 10.39% | 15.88% | 5.49%*** | 10.33% | -0.06% | 13.37% | 18.02% | 4.65%*** | 13.29% | -0.07% |
| Utility & gas | 4.39% | 6.29% | 1.90% | 4.39% | 0.00% | 5.56% | 8.91% | 3.35% | 5.56% | 0.00% | 0.00% | 1.33% | 1.33% | 0.00% | 0.00% |
| Trade & repairs | 6.12% | 14.65% | 8.53%*** | 5.85% | -0.26%* | 7.03% | 16.18% | 9.16%*** | 6.93% | -0.10%* | 9.13% | 17.53% | 8.40%*** | 9.06% | -0.07% |
| Restaurant & hotels | 9.32% | 18.14% | 8.82%*** | 9.19% | -0.13% | 7.13% | 15.95% | 8.82%*** | 6.95% | -0.19% | 11.08% | 15.87% | 4.78%** | 10.28% | -0.81% |
| Education | 5.62% | 52.06% | 46.43%*** | 4.74% | -0.88% | 4.99% | 46.71% | 41.71%*** | 4.42% | -0.57% | 8.27% | 50.10% | 41.83%*** | 8.00% | -0.27% |
| Entertainment & recreation | 9.89% | 12.90% | 3.01%** | 8.86% | -1.03% | 11.00% | 16.36% | 5.36%* | 10.34% | -0.66% | 24.07% | 27.33% | 3.26% | 20.50% | -3.57% |
| Other services | 6.89% | 17.34% | 10.45%*** | 6.53% | -0.36%* | 7.03% | 14.97% | 7.94%*** | 6.63% | -0.40%* | 8.56% | 17.36% | 8.80%*** | 8.28% | -0.28% |
| Area | |||||||||||||||
| Rural | 35.82% | 45.71% | 9.89%*** | 35.49% | -0.34%*** | 37.51% | 46.55% | 9.05%*** | 37.06% | -0.44%*** | 44.69% | 53.05% | 8.36%*** | 44.42% | -0.27%*** |
| Urban | 6.89% | 16.57% | 9.68%*** | 6.42% | -0.47%* | 6.83% | 15.82% | 8.98%*** | 6.59% | -0.25%** | 9.91% | 19.02% | 9.11%*** | 9.60% | -0.31%* |
| Lockdown | |||||||||||||||
| Not locked down | 29.68% | 41.02% | 11.35%*** | 29.12% | -0.55%** | 29.83% | 40.43% | 10.60%*** | 29.39% | -0.44%*** | 37.78% | 47.74% | 9.96%*** | 37.39% | -0.39%*** |
| Locked down | 5.86% | 13.02% | 7.16%*** | 5.70% | -0.16%* | 6.51% | 12.87% | 6.36%*** | 6.34% | -0.17% | 10.21% | 16.42% | 6.20%*** | 10.11% | -0.11% |
| Population | 20.76% | 30.54% | 9.78%*** | 20.35% | -0.40%*** | 21.09% | 30.10% | 9.01%*** | 20.75% | -0.34%*** | 28.58% | 37.29% | 8.71%*** | 28.29% | -0.29%*** |
-
Notes: [1]- The poverty measurement is the headcount. [2]- * p < 0.10, ** p < 0.05, *** p < 0.01. [3]- Significance levels are reported only for the change statistic. [4]- In p. p. [5]- Excludes the university fee subsidy. [6] Poverty line = GHS 2326.596. Source: Authors’ own calculations based on GLSS7 survey by GSS.
COVID-19 and poverty headcount – men, women and children (March–December 2020)
| Populations | Male | Female | Child | ||||||||||||
|---|---|---|---|---|---|---|---|---|---|---|---|---|---|---|---|
| Initial | Scenario 1 | Policies | Initial | Scenario 1 | Policies | Initial | Scenario 1 | Policies | |||||||
| Groups: | Level | Level | Change | Level | Change | Level | Level | Change | Level | Change | Level | Level | Change | Level | Change |
| Household size | |||||||||||||||
| 1-3 members | 5.47% | 7.31% | 1.84%*** | 5.33% | -0.14%*** | 6.95% | 8.52% | 1.58%*** | 6.62% | -0.32%** | 10.03% | 11.48% | 1.45%*** | 9.31% | -0.72% |
| 4-6 members | 18.76% | 21.26% | 2.50%*** | 18.05% | -0.70%** | 18.27% | 20.80% | 2.53%*** | 17.82% | -0.45%*** | 20.44% | 23.20% | 2.76%*** | 20.10% | -0.33%*** |
| 7-9 members | 35.66% | 38.88% | 3.23%*** | 35.31% | -0.34%* | 35.67% | 38.72% | 3.05%*** | 35.44% | -0.23%* | 37.02% | 39.82% | 2.80%*** | 36.83% | -0.19%* |
| >9 members | 57.02% | 59.11% | 2.09%** | 57.02% | 0.00% | 55.14% | 56.30% | 1.16% | 55.14% | 0.00% | 58.06% | 59.30% | 1.24% | 58.06% | 0.00% |
| Sex of household head | |||||||||||||||
| Male head | 21.11% | 23.37% | 2.27%*** | 20.74% | -0.37%** | 25.23% | 27.79% | 2.56%*** | 24.87% | -0.36%*** | 31.99% | 34.37% | 2.38%*** | 31.72% | -0.27%*** |
| Female head | 18.69% | 21.81% | 3.12%*** | 18.07% | -0.63%** | 14.62% | 16.33% | 1.71%*** | 14.31% | -0.31%*** | 21.13% | 23.73% | 2.59%*** | 20.79% | -0.34%* |
| Sector | |||||||||||||||
| Agriculture forestry & fishing | 40.17% | 43.49% | 3.31%*** | 39.97% | -0.20%** | 42.80% | 46.08% | 3.28%*** | 42.57% | -0.23%** | 48.40% | 51.50% | 3.11%*** | 48.31% | -0.09%** |
| Mining & quarrying | 12.58% | 3.28% | -9.29% | 5.39% | -7.18% | 14.70% | 4.04% | -10.66%** | 10.60% | -4.10% | 19.33% | 8.25% | -11.08%* | 14.75% | -4.58% |
| Manufacturing | 9.23% | 11.33% | 2.11%*** | 9.01% | -0.22% | 11.02% | 12.30% | 1.28%*** | 10.35% | -0.67%* | 15.99% | 17.63% | 1.64%*** | 15.12% | -0.87% |
| Other manufacturing | 17.17% | 16.53% | -0.65% | 17.17% | 0.00% | 14.92% | 13.81% | -1.10% | 14.92% | 0.00% | 25.39% | 24.65% | -0.74% | 25.39% | 0.00% |
| Construction | 7.29% | 8.74% | 1.45%** | 7.24% | -0.05% | 10.39% | 11.54% | 1.15%** | 10.33% | -0.06% | 13.37% | 14.69% | 1.32%* | 13.29% | -0.07% |
| Utility & gas | 4.39% | 4.39% | 0.00% | 4.39% | 0.00% | 5.56% | 5.56% | 0.00% | 5.56% | 0.00% | 0.00% | 0.00% | 0.00% | 0.00% | 0.00% |
| Trade & repairs | 6.12% | 7.93% | 1.82%*** | 5.85% | -0.26%* | 7.03% | 9.23% | 2.20%*** | 6.93% | -0.10%* | 9.13% | 11.61% | 2.48%*** | 9.06% | -0.07% |
| Restaurant & hotels | 9.32% | 11.68% | 2.36% | 9.19% | -0.13% | 7.13% | 9.31% | 2.17%** | 6.95% | -0.19% | 11.08% | 12.12% | 1.04% | 10.28% | -0.81% |
| Education | 5.62% | 12.86% | 7.24%*** | 4.74% | -0.88% | 4.99% | 11.61% | 6.61%*** | 4.42% | -0.57% | 8.27% | 16.95% | 8.68%*** | 8.00% | -0.27% |
| Entertainment & recreation | 9.89% | 10.61% | 0.72% | 8.86% | -1.03% | 11.00% | 11.91% | 0.91% | 10.34% | -0.66% | 24.07% | 24.07% | 0.00% | 20.50% | -3.57% |
| Other services | 6.89% | 8.89% | 2.00%*** | 6.53% | -0.36%* | 7.03% | 8.39% | 1.35%*** | 6.63% | -0.40%* | 8.56% | 10.34% | 1.78%*** | 8.28% | -0.28% |
| Area | |||||||||||||||
| Rural | 35.82% | 38.92% | 3.10%*** | 35.49% | -0.34%*** | 37.51% | 40.31% | 2.81%*** | 37.06% | -0.44%*** | 44.69% | 47.60% | 2.91%*** | 44.42% | -0.27%*** |
| Urban | 6.89% | 8.62% | 1.74%*** | 6.42% | -0.47%* | 6.83% | 8.57% | 1.73%*** | 6.59% | -0.25%** | 9.91% | 11.81% | 1.90%*** | 9.60% | -0.31%* |
| Lockdown | |||||||||||||||
| Not locked down | 29.68% | 32.68% | 3.01%*** | 29.12% | -0.55%** | 29.83% | 32.69% | 2.86%*** | 29.39% | -0.44%*** | 37.78% | 40.83% | 3.05%*** | 37.39% | -0.39%*** |
| Locked down | 5.86% | 7.22% | 1.36%*** | 5.70% | -0.16%* | 6.51% | 7.70% | 1.19%*** | 6.34% | -0.17% | 10.21% | 11.44% | 1.23%*** | 10.11% | -0.11% |
| Population | 20.76% | 23.15% | 2.39%*** | 20.35% | -0.40%*** | 21.09% | 23.32% | 2.23%*** | 20.75% | -0.34%*** | 28.58% | 31.03% | 2.44%*** | 28.29% | -0.29%*** |
-
Notes: [1]- The poverty measure is the headcount. [2]- * p < 0.10, ** p < 0.05, *** p < 0.01. [3]- Significance levels are reported only for the change statistic. [4]- In p. p. [5]- Excludes the university fee subsidy. [6] Poverty line = GHS 2326.596. Source: Authors’ own calculations based on GLSS7 survey by GSS.
COVID-19 and welfare (per adult equivalent consumption) – men, women and children
| Populations | Male | Female | Child | ||||||||||||
|---|---|---|---|---|---|---|---|---|---|---|---|---|---|---|---|
| Initial | Scenario 1 | Policies | Initial | Scenario 1 | Policies | Initial | Scenario 1 | Policies | |||||||
| Groups: | Level | Level | Change | Level | Change | Level | Level | Change | Level | Change | Level | Level | Change | Level | Change |
| Household size | |||||||||||||||
| 1-3 members | 2232.37 | 1739.06 | -22.10%*** | 2268.54 | 1.62%*** | 2139.02 | 1549.34 | -27.57%*** | 2189.39 | 2.35%*** | 1694.12 | 1431.86 | -15.48%*** | 1715.83 | 1.28%*** |
| 4-6 members | 1345.45 | 449.53 | -66.59% | 1360.09 | 1.09%*** | 1383.73 | 313.74 | -77.33% | 1399.7 | 1.15%*** | 1285.68 | 1105.85 | -13.99%*** | 1298.3 | 0.98%*** |
| 7-9 members | 977.25 | 831.02 | -14.96%*** | 983.2 | 0.61%*** | 954.84 | 813.53 | -14.80%*** | 962.65 | 0.82%*** | 905.55 | 780.96 | -13.76%*** | 911.53 | 0.66%*** |
| >9 members | 655.36 | 557.23 | -14.97%*** | 658.04 | 0.41%*** | 663.3 | 570.98 | -13.92%*** | 665.99 | 0.41%*** | 611.28 | 526.65 | -13.85%*** | 613.82 | 0.41%*** |
| Sex of household head | |||||||||||||||
| Male head | 1531.49 | 902.73 | -41.06%* | 1550.27 | 1.23%*** | 1310.77 | 453.29 | -65.42% | 1325.59 | 1.13%*** | 1087.08 | 928.38 | -14.60%*** | 1095.8 | 0.80%*** |
| Female head | 1326.22 | 1119.18 | -15.61%*** | 1345.71 | 1.47%*** | 1712.89 | 1293.6 | -24.48%*** | 1749.7 | 2.15%*** | 1256.97 | 1089.44 | -13.33%*** | 1271.35 | 1.14%*** |
| Sector | |||||||||||||||
| Agriculture forestry & fishing | 888.38 | 747.24 | -15.89%*** | 894.01 | 0.63%*** | 835.31 | 679.28 | -18.68%*** | 840.38 | 0.61%*** | 718.62 | 625.57 | -12.95%*** | 722.26 | 0.51%*** |
| Mining & quarrying | 1775.99 | 1996 | 12.39%*** | 1802.31 | 1.48%*** | 1608.55 | 1756.38 | 9.19%*** | 1643.18 | 2.15% | 1591.3 | 1704.4 | 7.11%*** | 1639.63 | 3.04% |
| Manufacturing | 1654.79 | 1419.06 | -14.25%*** | 1669.93 | 0.92%*** | 1667.47 | 1454.49 | -12.77%*** | 1681.6 | 0.85%*** | 1302.72 | 1151.86 | -11.58%*** | 1311.5 | 0.67%*** |
| Other manufacturing | 1478.85 | 1331.85 | -9.94%*** | 1491.39 | 0.85%*** | 1423.91 | 1235.62 | -13.22%*** | 1434.97 | 0.78%*** | 1165.11 | 1016.8 | -12.73%*** | 1177.28 | 1.04%*** |
| Construction | 1717.57 | 1525.4 | -11.19%*** | 1730.96 | 0.78%*** | 1529.16 | 1349.71 | -11.74%*** | 1539.53 | 0.68%*** | 1504.25 | 1348.89 | -10.33%*** | 1513.07 | 0.59%*** |
| Utility & gas | 2476.22 | 2376.49 | -4.03%** | 2497.97 | 0.88%*** | 2316.47 | 2143.64 | -7.46%*** | 2330.62 | 0.61%*** | 2007.7 | 1871.2 | -6.80%*** | 2021.35 | 0.68%*** |
| Trade & repairs | 1933.54 | 1576.61 | -18.46%*** | 1950.08 | 0.86%*** | 1794.99 | 1501.84 | -16.33%*** | 1810.3 | 0.85%*** | 1465.8 | 1257.72 | -14.20%*** | 1476.71 | 0.74%*** |
| Restaurant & hotels | 1492.37 | 1264.79 | -15.25%*** | 1506.3 | 0.93%*** | 1736.59 | 1512.57 | -12.90%*** | 1752.86 | 0.94%*** | 1456.69 | 1310.14 | -10.06%*** | 1468.7 | 0.82%*** |
| Education | 1976.82 | 714.9 | -63.84%*** | 1991.06 | 0.72%*** | 1995.56 | 997.76 | -50.00%*** | 2010.44 | 0.75%*** | 1575.84 | 883.61 | -43.93%*** | 1584.66 | 0.56%*** |
| Entertainment & recreation | 2334.86 | 1952.84 | -16.36%*** | 2396.13 | 2.62%*** | 2139.94 | 1857.97 | -13.18%*** | 2182.72 | 2.00%*** | 1765.63 | 1599.03 | -9.44%*** | 1801.31 | 2.02%*** |
| Other services | 2375.4 | 1816.72 | -23.52%*** | 2461.45 | 3.62%*** | 2378.23 | 1899.19 | -20.14%*** | 2526.26 | 6.22%*** | 1872.05 | 1540.17 | -17.73%*** | 1918.93 | 2.50%*** |
| Area | |||||||||||||||
| Rural | 1030.97 | 244.55 | -76.28% | 1039.93 | 0.87%*** | 980.96 | -132.58 | -113.52% | 995.8 | 1.51%*** | 787.82 | 680.36 | -13.64%*** | 792.61 | 0.61%*** |
| Urban | 1935.86 | 1568.73 | -18.96%*** | 1963.88 | 1.45%*** | 1890.11 | 1574.22 | -16.71%*** | 1920.93 | 1.63%*** | 1549.15 | 1325.06 | -14.47%*** | 1566.26 | 1.10%*** |
| Lockdown | |||||||||||||||
| Not locked down | 1152.34 | 467.59 | -59.42% | 1166.47 | 1.23%*** | 1118.48 | 215.21 | -80.76% | 1136.93 | 1.65%*** | 890.43 | 763.37 | -14.27%*** | 898.1 | 0.86%*** |
| Locked down | 2086.16 | 1712.75 | -17.90%*** | 2112.98 | 1.29%*** | 2049.75 | 1724.49 | -15.87%*** | 2081.4 | 1.54%*** | 1639.71 | 1409.51 | -14.04%*** | 1655.87 | 0.99%*** |
| Population | 1502 | 933.83 | -37.83%** | 1520.88 | 1.26%*** | 1467.6 | 781.02 | -46.78%* | 1491 | 1.59%*** | 1140.38 | 978.91 | -14.16%*** | 1150.88 | 0.92%*** |
-
Notes: [1]- The poverty measure is the headcount. [2]- * p < 0.10, ** p < 0.05, *** p < 0.01. [3]- Significance levels are reported only for the change statistic. [4]- In p. p. [5]- Excludes the university fee subsidy. [6] Poverty line = GHS 2326.596. Source: Authors’ own calculations based on GLSS7 survey by GSS.
Self-reported changes in income by source
| Nature of change and change in % | ||||||
|---|---|---|---|---|---|---|
| Increased | No change | Decreased | ||||
| Period | Wave 1 | Wave 2 | Wave 1 | Wave 2 | Wave 1 | Wave 2 |
| Wages | 3.2 | 44.9 | 41.8 | 49.6 | 55 | 5.5 |
| Foreign remittances | 2.9 | 65.4 | 17.2 | 28.3 | 79.9 | 6.3 |
| Domestic remittances | 2.3 | 58.9 | 27 | 37.2 | 70.7 | 4.9 |
| Change in income | 3.1 | 65.9 | 19.4 | 27.8 | 77.4 | 6.3 |
-
Notes: Sample weights are applied. The reference time is March 16, 2020, for both waves.
-
Source: Authors’ own calculations based on GSS Covid-19 rapid surveys
List of assumptions, adjustments and potential implications
| Item | Assumptions | Adjustments | Average changes | Implications |
|---|---|---|---|---|
| Labour income | Equivalence between income and expenditures. | 1. Predicted via a regression to adjust the values reported in the survey for potential measurement errors and assigning individual income to household members. 2. Hot deck approach adopted to correct for missing values. 3. Adjusted upwards from 2018 to 2020 using CPI values for the year of the survey. 4. Changes in income computed using mean values from GSS rapid surveys for sales, and self-reported optimistic and pessimistic probabilities of sales changes. It provides us with more realistic assumptions about income changes due to COVID-19. | 1. Inflation adjustment: 32.13% 2. Pessimistic probability of expected change in sales in %: Agri. (21.5) Mining (20.5) Manufacturing (29.3) Other manufacturing (30.0) Construction (29.2) Utility (62.2) Trade (23.6) Restaurant and hotel (44.4) Education (26.3) Entertainment (50.0) Other services (28.9) 3. Optimistic probability of expected change in sales in %: Agri. (33.3) Mining (11.5) Manufacturing (22.7) Other manufacturing (40.0) Construction (37.2) Utility (60.0) Trade (46.3) Restaurant and hotel (33.8) Education (47.8) Entertainment (70.0) Other services (41.6) | 1. Likely to be understated or overstated based on the adjustments made. 2. Some sectors may not have adequate observations to enable hot deck imputation to provide reasonable values for missing observations. |
| Water subsidy | Households with reported water bill payments are assumed to obtain their water from Ghana water company. | 1. Updated to current prices prior to the pandemic. 2. Hot deck imputation used for missing values. | Inflation adjustment: 32.13% | Not all households use Ghana water company. Some households miss out on the subsidy. Implications: 1. Fewer rural households compared to urban households will benefit. 2. It does not account for periods households do not receive water. |
| Electricity subsidy | Positive estimates of an electricity bill are taken to be users of the national grid. | 1. Updated to current prices prior to the pandemic. 2. Hot deck imputation used for missing observations. | Inflation adjustment: 32.13% | Not all households use electricity from the grid. Implications: 1. Fewer rural households compared to urban households will benefit. 2. It does not account for power rationing actual electricity consumed. |
| Loans to creatives | 1. Randomly sampled. 2. Same amount applied to all borrowers. | Males: 16,280 Females: 411 Overall: 0.054% of total population | 1. Under-reporting likely to underestimate the impact. 2. Does not take into account that loan recipients choose the amount to borrow. | |
| Health reliefs | 1. We assume that the income values used in the analysis are a true reflection of actual income paid to health workers. 2. Equivalence of income and expenditures. | 1. Income values predicted via regression. 2. Taxes computed based on predicted income values. | Inflation adjustment: 32.13% | Potential understatement or overstatement of benefits, depending on whether aggregated categories of health professionals are excluded from the benefits. |
| Prices | 1. Price increases follow the food CPI component. 2. Regional differences are small. | Forecasted via a time series regression. | 1. Optimistic scenario: 1st Quarter: 0.0342 2nd Quarter: -0.0033 3rd Quarter: 0.0004 2. Pessimistic scenario: 1st Quarter: 0.0382 2nd Quarter: -0.0013 3rd Quarter: 0.0016 | 1. Forecasts might not reflect the true time path of prices. 2. Large price changes within the microsimulation model could potentially underestimate the welfare effect. |
| Remittances | 1. GLSS values taken as reflective of remittances. 2. Changes at the national level taken to reflect changes at the household level. | Adjusted with mean values from the GSS rapid surveys | 1. Inflation adjustment: 32.13% 2. Optimistic scenario: 1st Quarter: -0.0572 2nd Quarter: -0.0286 3rd Quarter: 0.0000 3. Pessimistic scenario: 1st Quarter: -0.0687 2nd Quarter: -0.0343 3rd Quarter: -0.0500 | Likely to understate remittances at the household level if the true level of remittances is under-reported in the survey. If the rate of reduction is smaller than assumed, then the value of remittances will be overstated. |
| GLSS7 dataset | 1. Expenditure shares stayed the same over time. | 1. Updates using CPI. 2. Sample weights adjusted to reflect 2020 population estimates. | 1. Inflation adjustment: 32.13% 2. Population growth: 11.09% |
-
Source: Authors’ calculations based on GSS rapid surveys.
Share of workers that experienced a decline in wages, and average decline in sales
| Percent of workers with reduced wages (%) | Wave 1 | Wave 2 |
|---|---|---|
| Agriculture and other industries | 11.7 | 17.5 |
| Manufacturing | 14.8 | 7.5 |
| Trade | 28 | 12 |
| Accommodation/Food | 30.5 | 15 |
| Other services | 36.3 | 8.4 |
| Average decrease in sales (%) | Scenario 1 | Scenario 2 |
| Agriculture and other industries | 0.1265 | 0.1569 |
| Utility & gas | 0.0287 | 0.0356 |
| Manufacturing | 0.0385 | 0.0458 |
| Mining & quarrying | 0.0266 | 0.0330 |
| Trade | 0.1133 | 0.1325 |
| Accommodation/Food | 0.1300 | 0.1328 |
| Other services | 0.1272 | 0.1529 |
| Construction | 0.0266 | 0.0330 |
-
Source: Authors’ calculations based on GSS rapid surveys.
Data and code availability
Main datasets used were obtained from the Ghana Statistics Service. We do not have permission to share the data on a repository, however, the data are available to download at the website of the Ghana Statistics Service.