Simulations of Policy Responses and Interventions to Promote Inclusive Adaptation to and Recovery from the COVID-19 Crisis in Ecuador
Figures

Individual labour income in 2019/2020 by gender and income decile. Source: ENEMDU December 2019 and authors’ simulations
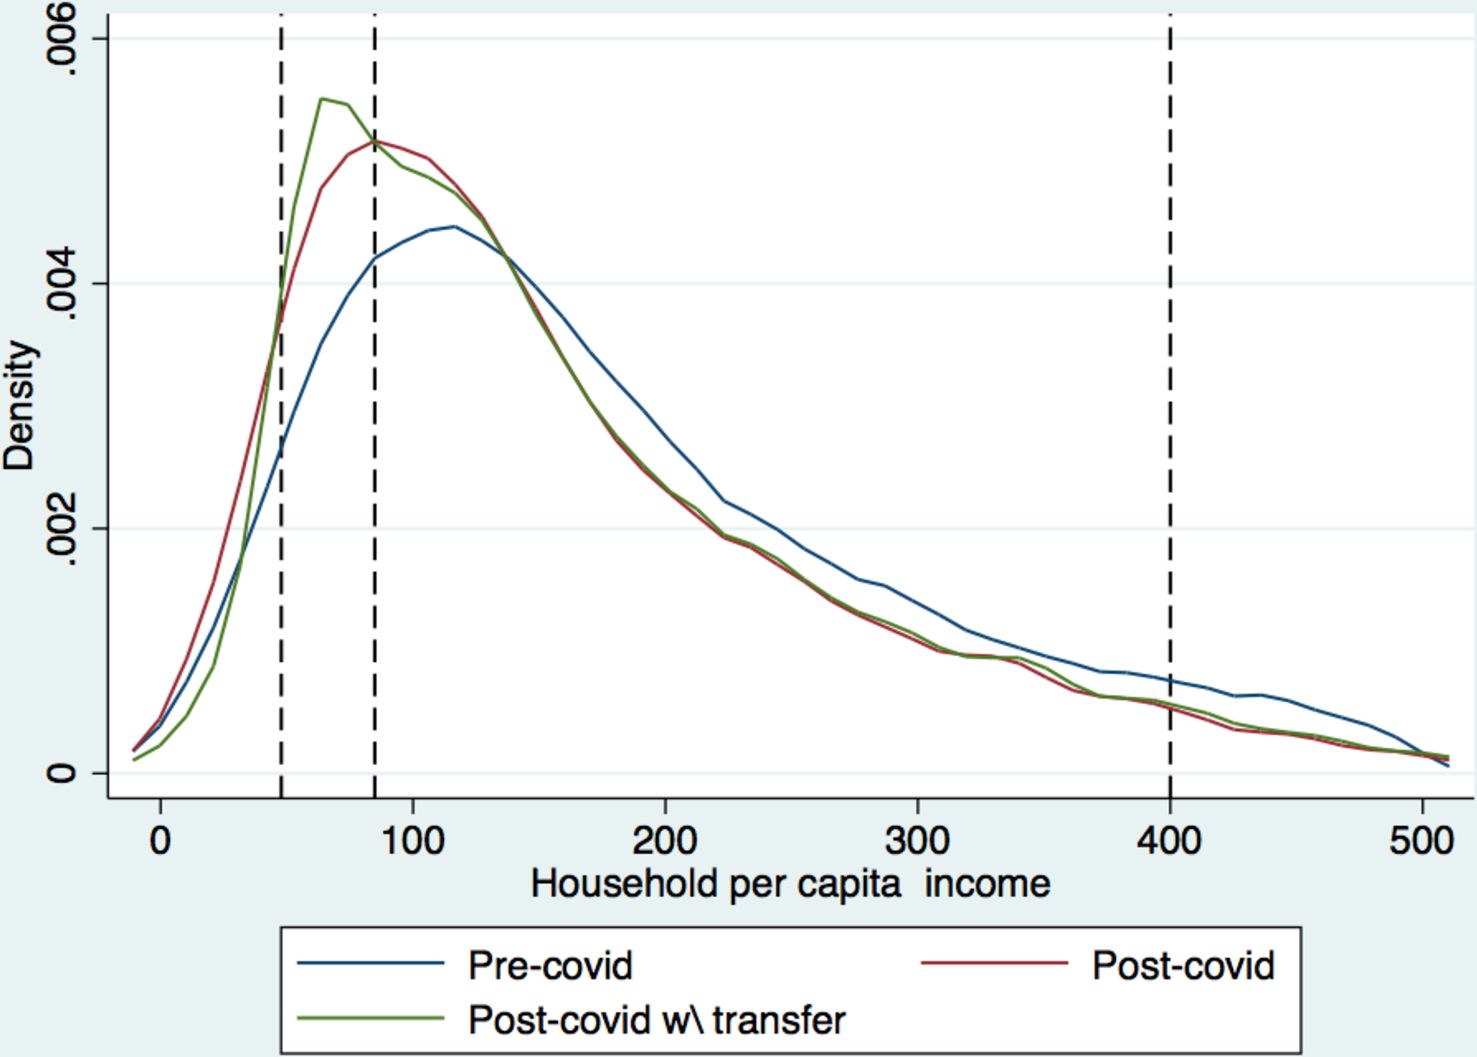
Income distribution pre-COVID and post-COVID (September 2020) with and without transfers. Source: ENEMDU December 2019 and authors’ simulations. From left to right, the dashed lines represent: the extreme poverty line ($47.80), the moderate poverty line ($84.81), and the minimum wage line ($400). Income in USD

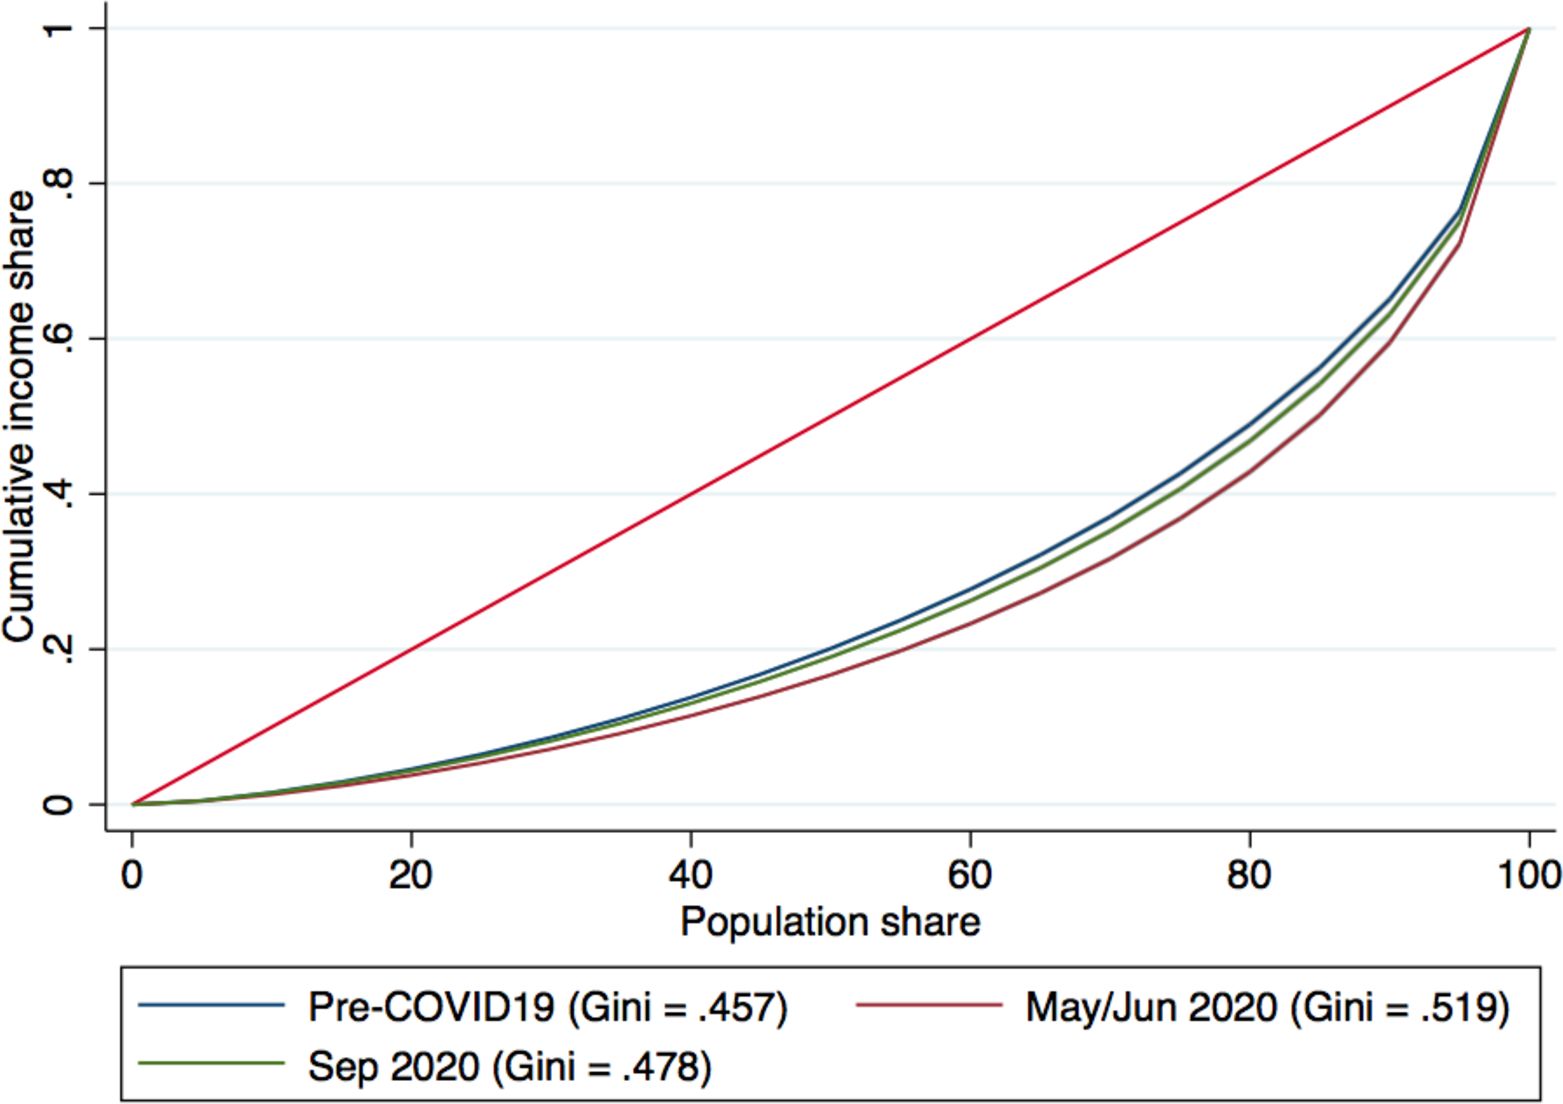
Lorenz curves pre- and post-COVID. Source: ENEMDU December 2019 and authors’ simulations.
Tables
Macroeconomic Statistics
| Indicator | 2015 | 2016 | 2017 | 2018 | 2019 |
|---|---|---|---|---|---|
| GDP (real 2007 $) | 70,174 | 69,314 | 70,955 | 71,870 | 71,909 |
| GDP growth (% annual) | 0.1% | -1.23% | 2.37% | 1.29% | 0.05% |
| Per capita GDP (real 2007 $) | 4,310 | 4,193 | 4,229 | 4,221 | 4,164 |
| Per capita GDP growth (% annual) | -1.45% | -2.72% | 0.85% | -0.18% | -1.36% |
| Public debt (% GDP) | 33% | 38.2% | 44.6% | 45.2% | 44.9% |
| Primary fiscal deficit (% GDP) | -1.68% | -5.34% | -5.39% | -2.46% | -2.48% |
| Total population | 16,278,844 | 16,528,730 | 16,776,977 | 17,023,408 | 17,267,986 |
| Working age population | 11,399,276 | 11,696,131 | 11,937,928 | 12,239,023 | 12,402,565 |
| Active population | 7,498,528 | 7,874,021 | 8,086,048 | 8,027,130 | 8,099,030 |
| Activity rate (% labour force) | 65.78% | 67.32% | 67.73% | 65.59% | 65.3% |
| Unemployment rate (% labour force) | 4.77% | 5.21% | 4.62% | 3.69% | 3.84% |
| Informal work (% employed)* | 58.4% | 62.2% | 63% | 64.7% | 66.08% |
| Self-employed (% employed)* | 34.1% | 35.9% | 35.6% | 36.9% | 38.5% |
| Real mean monthly labour income† | 355.6 | 337.1 | 341.2 | 333.5 | 325.8 |
-
Source: Central Bank of Ecuador.
-
*
SEDLAC estimates.
-
†
$ USD.
Empirical change in labour income and employment in 2019/2020 by gender and economic sector
| Economic sector | Mean income among employed | %Δ employment | Expected %Δ mean income | ||||
|---|---|---|---|---|---|---|---|
| 12/2019 | 06/2020 | 09/2020 | 12/19 - 6/20 | 12/19 - 9/20 | 12/19 - 6/20 | 12/19 - 9/20 | |
| Female | |||||||
| Agriculture + fishing + mining | 77.86 | 49.65 | 77.35 | -26.46% | -8.49% | -53.11% | -9.10% |
| Industry + electricity, gas & water | 324.77 | 221.35 | 278.52 | -25.38% | -18.28% | -49.14% | -29.92% |
| Construction | 422.16 | 432.41 | 426.62 | -16.96% | -5.66% | -14.94% | -4.66% |
| Trade | 277.39 | 165.63 | 236.39 | -27.92% | 1.39% | -56.96% | -13.59% |
| Restaurants & hotels | 305.56 | 76.37 | 215.01 | -20.97% | -9.98% | -80.25% | -36.66% |
| Transportation & communication | 579.35 | 423.97 | 408.56 | -20.00% | 12.19% | -41.46% | -20.88% |
| Real estate | 408.75 | 297.41 | 398.92 | -48.04% | -1.04% | -62.20% | -3.42% |
| Public administration and defence | 1008.34 | 828.78 | 970.17 | 12.01% | 37.44% | -7.94% | 32.24% |
| Education | 766.74 | 702.07 | 717.59 | -13.69% | -0.07% | -20.97% | -6.48% |
| Health | 736.98 | 677.06 | 864.37 | -17.13% | -4.89% | -23.87% | 11.56% |
| Personal services | 300.79 | 151.94 | 278.81 | -44.36% | -33.24% | -71.89% | -38.12% |
| Other services | 882.85 | 851.41 | 890.39 | 28.84% | 30.29% | -16.15% | 31.41% |
| All female | 309.97 | 227.62 | 295.71 | -26.42% | -7.36% | -45.97% | -11.62% |
| Male | |||||||
| Agriculture + fishing + mining | 241.79 | 146.09 | 211.96 | -12.89% | -7.57% | -47.37% | -18.97% |
| Industry + electricity, gas & water | 521.88 | 315.27 | 438.02 | -30.51% | -3.19% | -58.02% | -18.75% |
| Construction | 425.92 | 100.86 | 356.34 | -42.16% | -11.64% | -86.30% | -26.07% |
| Trade | 451.57 | 228.04 | 525.78 | -17.90% | -2.71% | -58.54% | 13.28% |
| Restaurants & hotels | 414.94 | 145.06 | 274.95 | -17.63% | 5.02% | -71.20% | -30.41% |
| Transportation & communication | 494.78 | 211.28 | 408.98 | -21.47% | -19.50% | -66.47% | -33.46% |
| Real estate | 619.63 | 338.42 | 520.18 | -24.85% | -10.52% | -58.96% | -24.88% |
| Public administration and defence | 1016.79 | 925.27 | 1067.36 | -11.51% | -9.65% | -19.48% | -5.16% |
| Education | 819.99 | 695.47 | 926.78 | -12.55% | 11.28% | -25.83% | 25.77% |
| Health | 956.67 | 885.62 | 919.35 | -8.14% | 1.57% | -14.96% | -2.40% |
| Personal services | 459.19 | 198.90 | 388.30 | -23.87% | -16.23% | -67.02% | -29.16% |
| Other services | 975.77 | 717.17 | 1017.63 | 18.44% | 10.97% | -12.95% | 15.73% |
| All male | 437.45 | 251.64 | 410.99 | -19.96% | -7.02% | -53.96% | -12.64% |
| All | 384.41 | 242.08 | 363.17 | -22.65% | -7.16% | -51.29% | -12.29% |
-
Source: ENEMDU December 2019, May/June 2020, and September 2020.
-
Note: The last two columns take into account the change in employment as zero-income.
-
Note: Income in USD.
Empirical change in non-labour income in 2019/2020
| Income | Change | ||||
|---|---|---|---|---|---|
| Dec. 2019 | May 2020 | Sept. 2020 | % Δ Dec.-May | % Δ Dec.-Sept. | |
| Non-labour income | 44.34 | 38.37 | 44.30 | -13.46% | -0.09% |
| Government transfers | 4.44 | 5.94 | 4.80 | 33.75% | 8.06% |
-
Source: ENEMDU December 2019, May and September 2020 and authors’ calculations.
-
Note: Changes in May 2020 and September 2020 are calculated with respect to December 2019.
-
Note: Income in USD.
Change in household per capita income in 2019/2020
| December 2019 | May/June 2020 | September 2020 | |||
|---|---|---|---|---|---|
| Income | Income | Change | Income | Change | |
| Household per capita income | 214.49 | 120.21 | -43.95% | 193.18 | -9.93% |
| Household per capita labour income | 170.14 | 81.83 | -51.90% | 148.83 | -12.52% |
| Household per capita non-labour income | 44.35 | 38.38 | -13.46% | 44.30 | -0.13% |
-
Source: ENEMDU December 2019 and authors’ simulations of post-COVID incomes.
-
Note: Income in USD.
Monthly individual labour income pre- and post-COVID
| Group | % of workers | December 2019 | May/June 2020 | September 2020 | ||
|---|---|---|---|---|---|---|
| Income | Income | Change | Income | Change | ||
| By gender | ||||||
| Female | 37.33% | 389.26 | 205.62 | -47.18% | 343.53 | -11.75% |
| Male | 62.67% | 474.01 | 216.82 | -54.26% | 412.6 | -12.96% |
| By age | ||||||
| <26 | 11.11% | 309.61 | 137.88 | -55.47% | 265.76 | -14.16% |
| 26-65 | 80.64% | 476.93 | 231.60 | -51.44% | 418.23 | -12.31% |
| >65 | 8.25% | 282.97 | 127.95 | -54.78% | 242.50 | -14.30% |
| By ethnicity | ||||||
| Indigenous | 13.72% | 300.51 | 134.19 | -55.34% | 256.10 | -14.78% |
| Afro American | 5.03% | 379.83 | 181.32 | -52.26% | 321.26 | -15.42% |
| Mestizo/white | 73.95% | 470.54 | 227.53 | -51.65% | 414.01 | -12.02% |
| Other | 7.31% | 344.86 | 163.54 | -52.58% | 290.20 | -15.85% |
| By education level | ||||||
| No high school | 50.73% | 320.6946 | 130.5171 | -59.30% | 262.7539 | -18.07% |
| High school | 33.29% | 445.1933 | 201.1437 | -54.82% | 383.0887 | -13.95% |
| Higher education | 15.98% | 835.7534 | 506.4722 | -39.40% | 801.7644 | -4.07% |
| By employment type | ||||||
| Informal | 75.19% | 346.88 | 139.44 | -59.80% | 289.17 | -16.64% |
| Formal | 24.81% | 669.88 | 387.09 | -42.22% | 619.47 | -7.53% |
| By area | ||||||
| Rural | 28.92 % | 343.81 | 164.66 | -52.11% | 287.72 | -16.31% |
| Urban | 71.08% | 483.09 | 232.47 | -51.88% | 427.76 | -11.45% |
| By firm size | ||||||
| Big private (gt5 employees) | 23.8% | 576.07 | 268.50 | -53.39% | 497.93 | -13.56% |
| Small private | 68.99% | 339.61 | 135.30 | -60.16% | 282.72 | -16.75% |
| Public | 7.21% | 843.22 | 646.44 | -23.34% | 864.64 | 2.54% |
| By income decile | ||||||
| 1 | 10% | 111.88 | 49.19 | -56.03% | 92.11 | -17.67% |
| 2 | 10% | 185.98 | 78.47 | -57.81% | 152.43 | -18.04% |
| 3 | 10% | 248.93 | 106.49 | -57.22% | 207.91 | -16.48% |
| 4 | 10% | 274.42 | 113.7 | -58.57% | 227.43 | -17.12% |
| 5 | 10% | 304.21 | 128.83 | -57.65% | 255.47 | -16.02% |
| 6 | 10% | 344.37 | 143.86 | -58.23% | 285.62 | -17.06% |
| 7 | 10% | 382.19 | 168.71 | -55.86% | 323.78 | -15.28% |
| 8 | 10% | 444.31 | 204.22 | -54.04% | 381.42 | -14.15% |
| 9 | 10% | 529.2 | 268.01 | -49.36% | 471.92 | -10.82% |
| 10 | 10% | 976.74 | 525.97 | -46.15% | 896.08 | -8.26% |
-
Source: ENEMDU December 2019 and authors’ simulations of post-COVID incomes.
-
Note: Income in USD.
Average household per capita income pre-COVID and post-COVID with and without public transfers
| Dec. 2019 | Sept. 2020 simulated income | ||
|---|---|---|---|
| Income | Without transfers | With transfers | |
| All | 214.49 | 193.19 | 197.99 |
| Poor | 54.24 | 47.53 | 53.36 |
-
Source: ENEMDU December 2019 and authors’ simulations.
-
Note: Income in USD.
Poverty rates pre-COVID and post-COVID with and without transfers
| December 2019 | May/June 2020 simulated income | September 2020 simulated income | |||
|---|---|---|---|---|---|
| Income | W/out transfers | With transfers | W/out transfers | With transfers | |
| All | 23.86% | 58.11% | 56.51% | 30.82% | 30.27% |
| By gender | |||||
| Female | 24.05% | 58.24% | 56.60% | 31.28% | 30.69% |
| Male | 23.66% | 57.97% | 56.40% | 30.34% | 29.84% |
| By age group | |||||
| [0, 14] | 34.13% | 71.48% | 69.93% | 42.69% | 42.10% |
| [15, 24] | 24.73% | 63.74% | 61.74% | 32.68% | 32.01% |
| [25, 40] | 20.62% | 56.16% | 54.31% | 27.66% | 27.12% |
| [41, 64] | 17.61% | 49.77% | 48.20% | 23.27% | 22.72% |
| [65+] | 13.30% | 31.34% | 30.77% | 16.54% | 16.35% |
| By ethnicity | |||||
| Indigenous | 49.27% | 80.06% | 79.84% | 57.45% | 57.41% |
| Afro American | 38.05% | 67.69% | 66.42% | 42.50% | 42.16% |
| Mestizo/white | 18.57% | 52.78% | 51.03% | 25.39% | 24.74% |
| Other | 24.83% | 62.14% | 60.56% | 32.26% | 31.96% |
| By education level | |||||
| No high school | 29.20% | 66.40% | 65.06% | 37.55% | 37.07% |
| High school | 12.90% | 46.44% | 44.03% | 17.84% | 17.05% |
| Higher education | 4.01% | 13.15% | 12.35% | 5.18% | 4.96% |
| By employment type | |||||
| Informal | 25.56% | 62.23% | 61.54% | 32.67% | 32.55% |
| Formal | 3.38% | 26.18% | 21.87% | 5.64% | 4.48% |
| By area | |||||
| Rural | 35.65% | 69.28% | 68.46% | 43.73% | 43.64% |
| Urban | 18.36% | 52.90% | 50.93% | 24.80% | 24.04% |
| By geographic region | |||||
| Sierra | 21.07% | 53.83% | 52.16% | 27.16% | 26.66% |
| Costa | 24.61% | 61.04% | 59.42% | 32.17% | 31.57% |
| Amazonia | 40.82% | 68.42% | 67.53% | 49.71% | 49.31% |
-
Source: ENEMDU December 2019 and authors’ simulations.
-
Note: The official poverty line is $84.81.
Inequality measures pre- and post-COVID
| Percentile ratios | Gini | ||||
|---|---|---|---|---|---|
| p90/p10 | p90/p50 | p50/p10 | p75/p25 | ||
| December 2019 | 7.65 | 2.81 | 2.72 | 2.88 | 0.46 |
| May/June 2020 without transfers | 10.43 | 3.63 | 2.87 | 3.28 | 0.52 |
| May/June 2020 with transfers | 8.77 | 3.61 | 2.43 | 3.14 | 0.50 |
| September 2020 without transfers | 8.42 | 3.05 | 2.76 | 2.97 | 0.48 |
| September 2020 with transfers | 7.59 | 3.05 | 2.49 | 3.01 | 0.47 |
-
Source: ENEMDU December 2019 and authors’ simulations.
Share of poor individuals by gender pre- and post-COVID
| Females | Males | |||||
|---|---|---|---|---|---|---|
| Dec. 2019 | May 2020 | Sept. 2020 | Dec. 2019 | May 2020 | Sept. 2020 | |
| All | 0.24 | 0.58 | 0.31 | 0.24 | 0.58 | 0.30 |
| By area | ||||||
| Rural | 0.36 | 0.70 | 0.44 | 0.35 | 0.68 | 0.43 |
| Urban | 0.19 | 0.53 | 0.25 | 0.18 | 0.53 | 0.24 |
| By employment type | ||||||
| Informal | 0.26 | 0.61 | 0.33 | 0.25 | 0.63 | 0.32 |
| Formal | 0.02 | 0.18 | 0.03 | 0.04 | 0.32 | 0.07 |
| By age group | ||||||
| [0, 14] | 0.33 | 0.72 | 0.42 | 0.35 | 0.71 | 0.43 |
| [15, 24] | 0.26 | 0.65 | 0.34 | 0.23 | 0.63 | 0.31 |
| [25, 40] | 0.23 | 0.59 | 0.30 | 0.18 | 0.54 | 0.25 |
| [41, 64] | 0.17 | 0.48 | 0.23 | 0.18 | 0.51 | 0.24 |
| [65+] | 0.12 | 0.30 | 0.16 | 0.14 | 0.33 | 0.18 |
| By ethnicity | ||||||
| Indigenous | 0.50 | 0.80 | 0.57 | 0.49 | 0.80 | 0.57 |
| Afro American | 0.37 | 0.68 | 0.42 | 0.39 | 0.67 | 0.43 |
| Mestizo/white | 0.19 | 0.53 | 0.26 | 0.18 | 0.53 | 0.25 |
| Other | 0.26 | 0.63 | 0.34 | 0.24 | 0.61 | 0.31 |
| By education level | ||||||
| No high school | 0.30 | 0.67 | 0.38 | 0.29 | 0.66 | 0.37 |
| High school | 0.14 | 0.48 | 0.20 | 0.12 | 0.45 | 0.16 |
| Higher education | 0.03 | 0.12 | 0.05 | 0.05 | 0.14 | 0.06 |
| By geographic region | ||||||
| Sierra | 0.21 | 0.54 | 0.27 | 0.21 | 0.54 | 0.27 |
| Costa | 0.25 | 0.61 | 0.33 | 0.24 | 0.61 | 0.31 |
| Amazonia | 0.41 | 0.69 | 0.50 | 0.41 | 0.68 | 0.49 |
Data and code availability
Data available at https://www.ecuadorencifras.gob.ec/estadisticas/