The Impact of COVID-19 on Living Standards: Addressing the Challenges of Nowcasting Unprecedented Macroeconomic Shocks with Scant Data and Uncharted Economic Behavior
- Samuel Z. Stone Professor of Latin American Economics in the Department of Economics at Tulane University, and Director of the Commitment to Equity Institute at Tulane University, United States
- Postdoctoral associate at Yale University, United States
- Consultant of the Commitment to Equity Institute and the World Bank, United States
- Consultant of the Commitment to Equity Institute, United States
Figures

Composition of Per Capita Household Gross Income. Notes: The dashed vertical line is the national poverty line and the bold vertical lines are—from left to right-- the $5.50 (moderate poor), $11.50 (lower-middle class) and $57.60 (middle class) per day international lines (in 2011 PPP), respectively. Source: Authors’ calculations based on ENIGH (2018), EPH (2019), GEIH (2019), PNADC (2019).

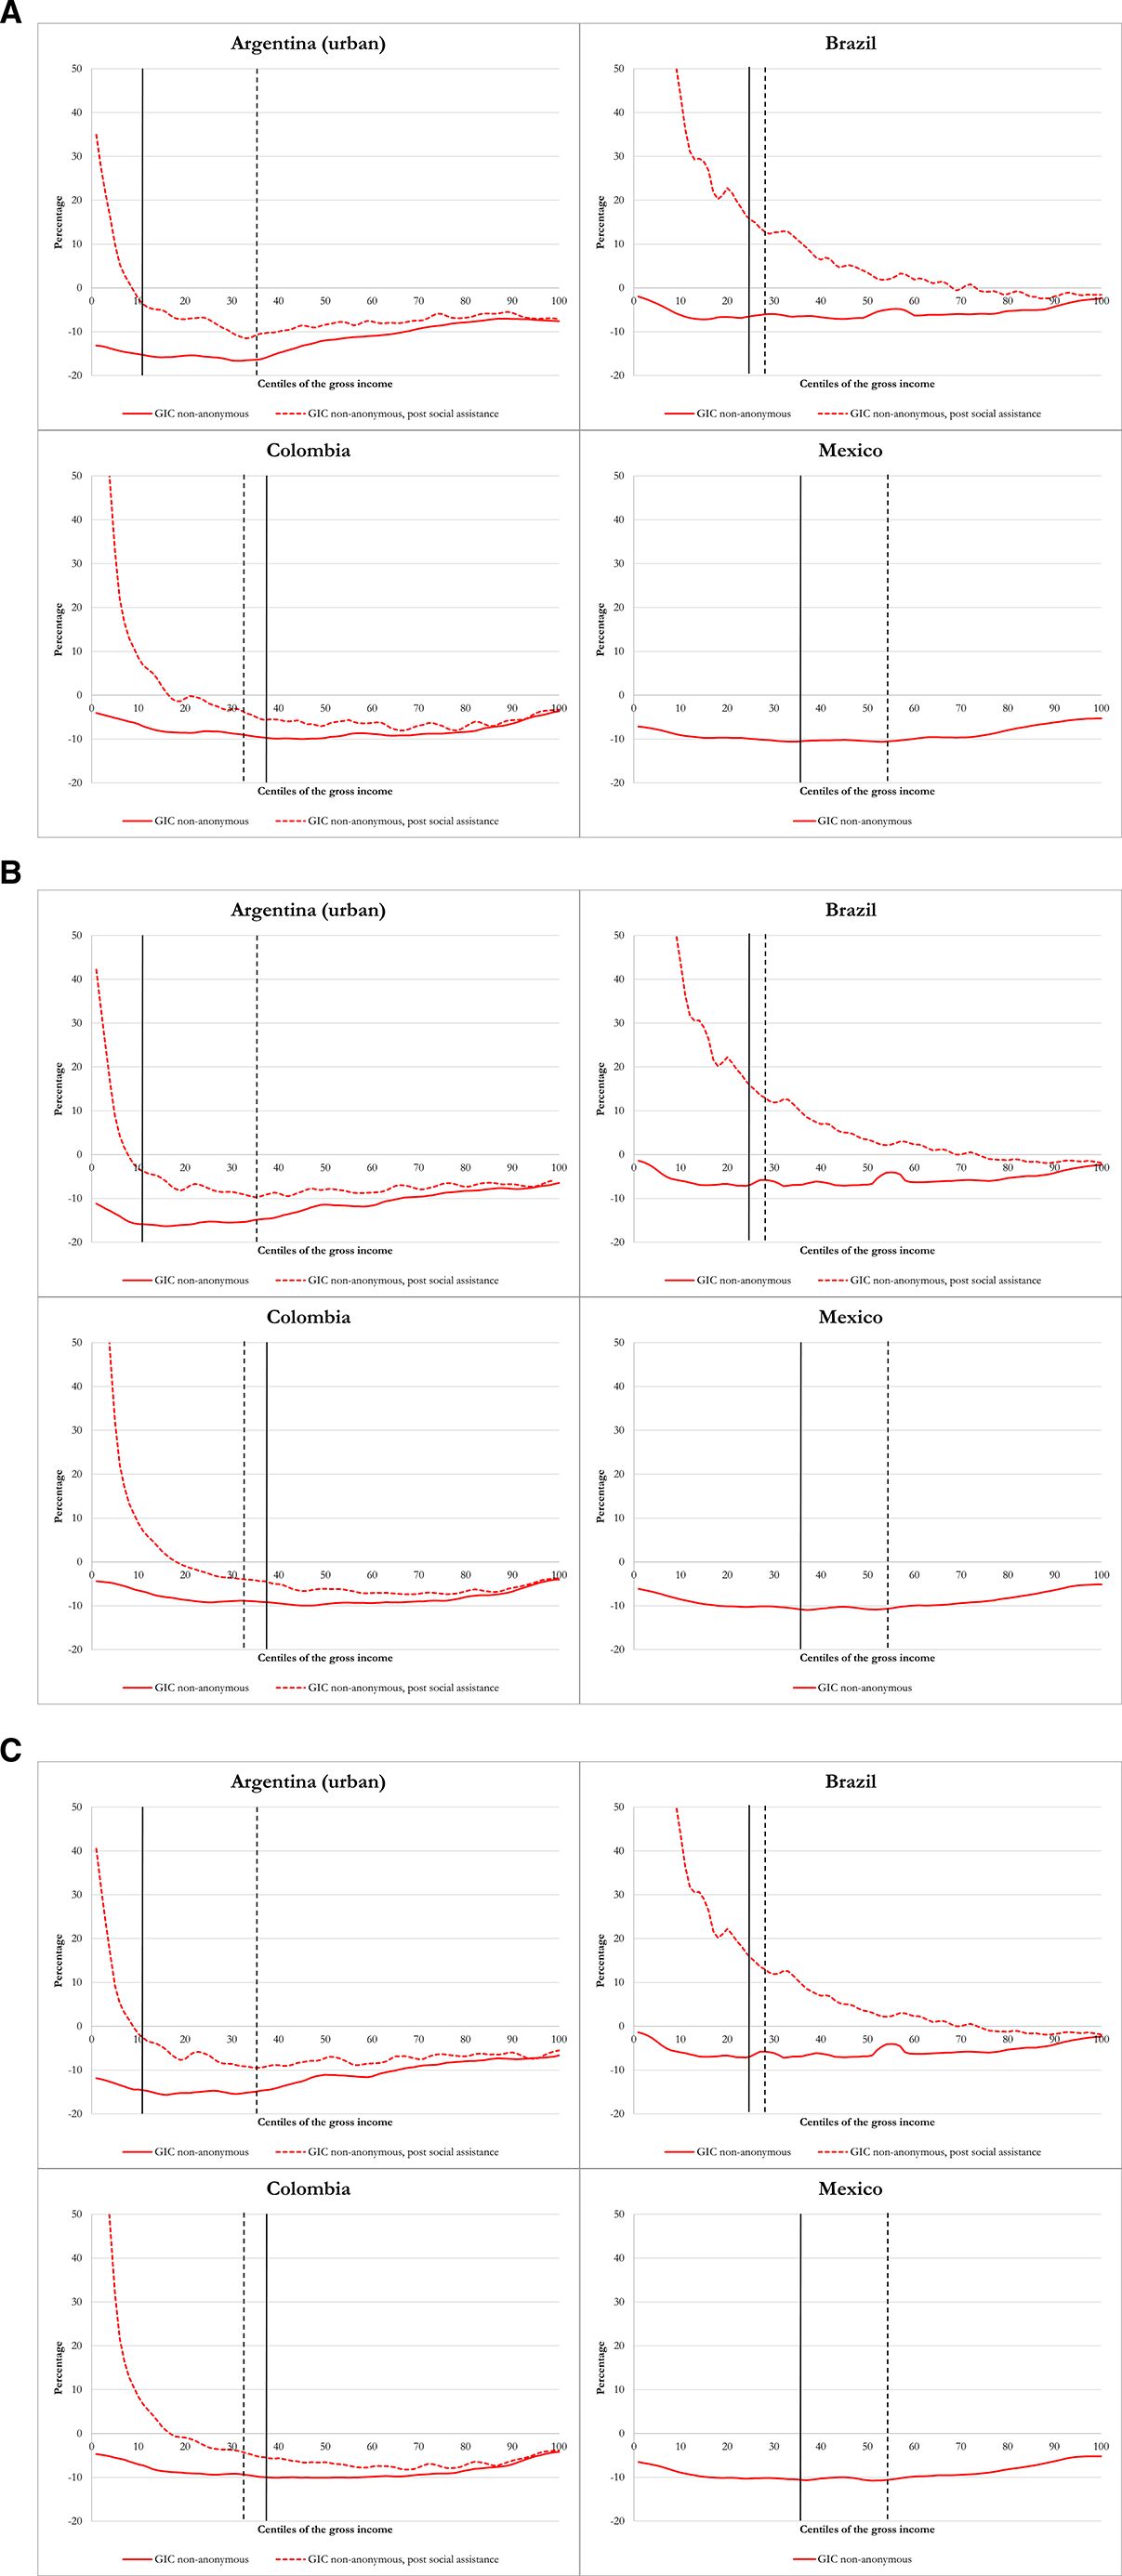
Non-anonymous Growth Incidence Curves Panel (a) “Concentrated Losses” Scenario, Panel (B) “Dispersed Losses” Scenario, Panel (c) “Actual Losses” Scenario. Notes: The dashed vertical line is the national poverty line and the bold vertical line is the $5.50 (moderate poor) per day international line (in 2011 PPP). Poverty lines based on the pre-pandemic distribution of income. Source: Authors’ calculations based on ENIGH (2018), EPH (2019), GEIH (2019), PNADC (2019).

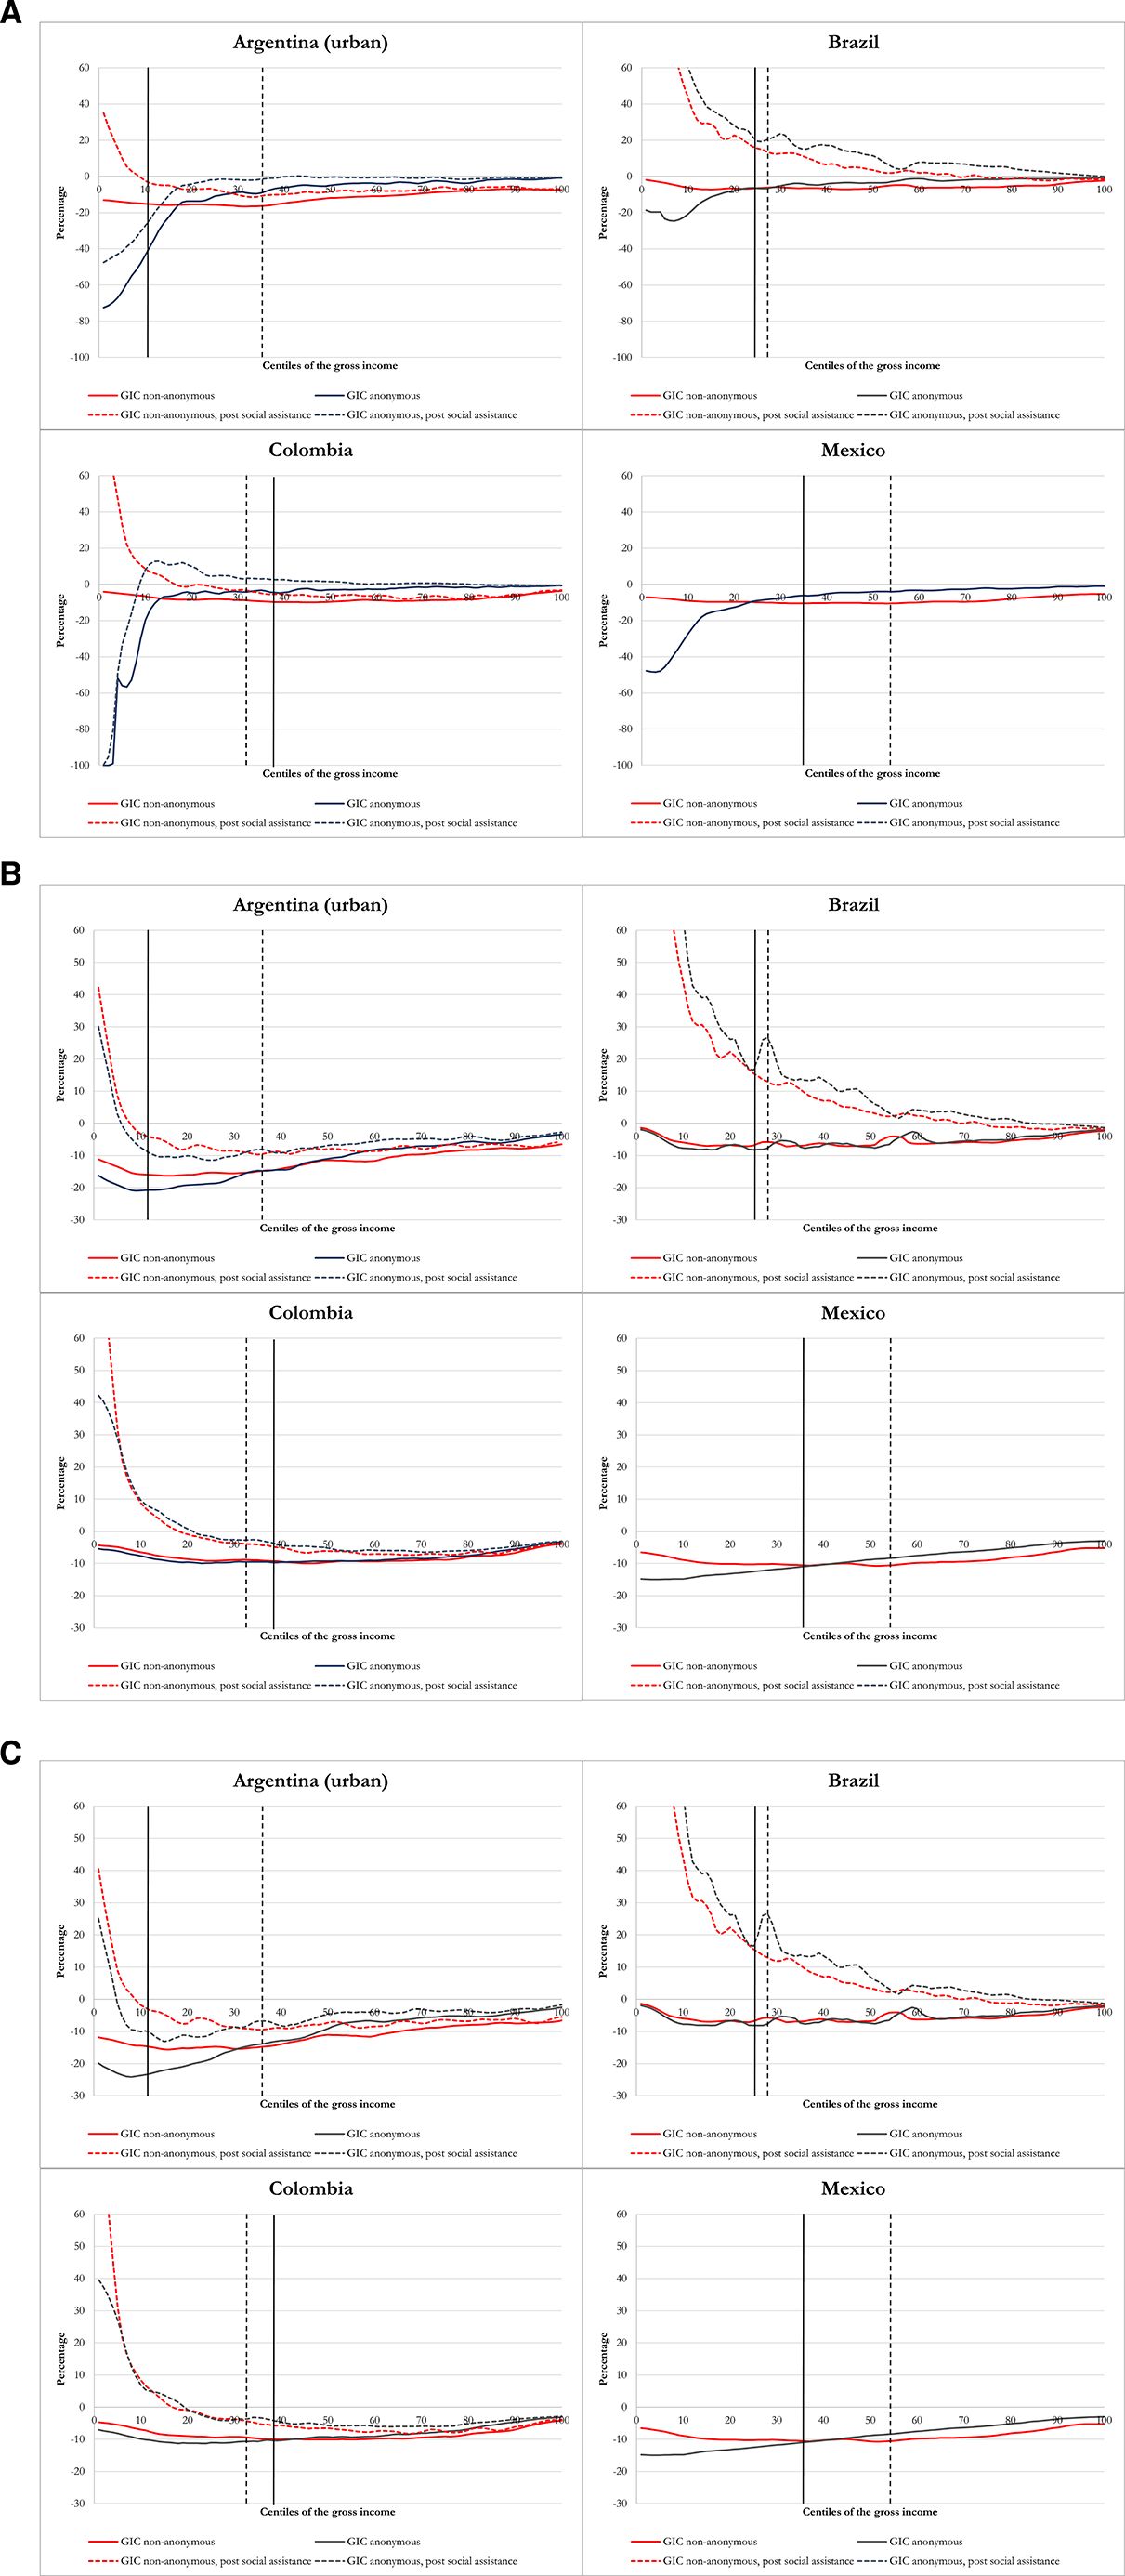
Anonymous and Non-anonymous Growth Incidence Curves Panel (a) “Concentrated Losses” Scenario, Panel (b) “Dispersed Losses” Scenario, Panel (c) “Actual Losses” Scenario Notes: The dashed vertical line is the national poverty line and the bold vertical line is the $5.50 (moderate poor) per day international line (in 2011 PPP). Poverty lines based on the pre-pandemic distribution of income. Source: Authors’ calculations based on ENIGH (2018), EPH (2019), GEIH (2019), PNADC (2019).
Tables
Illustration of the Income Losses Matrix (as % of total gross income)
| % of income lost | 10% | 20% | 30% | 40% | 50% | 60% | 70% | 80% | 90% | 100% |
|---|---|---|---|---|---|---|---|---|---|---|
| % households losing income | ||||||||||
| 10% | 0.3 | 0.5 | 0.8 | 1.1 | 1.3 | 1.6 | 1.9 | 2.1 | 2.4 | 2.7 |
| 20% | 0.5 | 1.0 | 1.6 | 2.1 | 2.6 | 3.1 | 3.6 | 4.2 | 4.7 | 5.2 |
| 30% | 0.8 | 1.6 | 2.4 | 3.2 | 4.0 | 4.8 | 5.6 | 6.4 | 7.2 | 8.0 |
| 40% | 1.0 | 2.1 | 3.1 | 4.2 | 5.2 | 6.3 | 7.3 | 8.3 | 9.4 | 10.4 |
| 50% | 1.3 | 2.6 | 3.9 | 5.2 | 6.5 | 7.8 | 9.1 | 10.4 | 11.7 | 13.0 |
| 60% | 1.6 | 3.1 | 4.7 | 6.2 | 7.8 | 9.3 | 10.9 | 12.4 | 14.0 | 15.5 |
| 70% | 1.8 | 3.7 | 5.5 | 7.3 | 9.2 | 11.0 | 12.8 | 14.7 | 16.5 | 18.3 |
| 80% | 2.1 | 4.2 | 6.3 | 8.4 | 10.5 | 12.6 | 14.7 | 16.8 | 18.9 | 21.0 |
| 90% | 2.4 | 4.8 | 7.1 | 9.5 | 11.9 | 14.3 | 16.7 | 19.0 | 21.4 | 23.8 |
| 100% | 2.6 | 5.3 | 7.9 | 10.6 | 13.2 | 15.9 | 18.5 | 21.1 | 23.8 | 26.4 |
-
Notes: Highlighted cells correspond to losses similar to the loss projections by IMF published in May 2021 (IMF, 2021). The pink is the scenario where in addition to macroeconomic consistency, the share of households that have reported losing income corresponds to the available information.
-
Source: Authors’ calculations based on EPH (2019).
Income Losses Matrix (as % of total gross income)
| Panel (a) Argentina (urban) | ||||||||||
| % of income lost | 10% | 20% | 30% | 40% | 50% | 60% | 70% | 80% | 90% | 100% |
| % households losing income | ||||||||||
| 10% | 0.3 | 0.5 | 0.8 | 1.1 | 1.3 | 1.6 | 1.9 | 2.1 | 2.4 | 2.7 |
| 20% | 0.5 | 1.0 | 1.6 | 2.1 | 2.6 | 3.1 | 3.6 | 4.2 | 4.7 | 5.2 |
| 30% | 0.8 | 1.6 | 2.4 | 3.2 | 4.0 | 4.8 | 5.6 | 6.4 | 7.2 | 8.0 |
| 40% | 1.0 | 2.1 | 3.1 | 4.2 | 5.2 | 6.3 | 7.3 | 8.3 | 9.4 | 10.4 |
| 50% | 1.3 | 2.6 | 3.9 | 5.2 | 6.5 | 7.8 | 9.1 | 10.4 | 11.7 | 13.0 |
| 60% | 1.6 | 3.1 | 4.7 | 6.2 | 7.8 | 9.3 | 10.9 | 12.4 | 14.0 | 15.5 |
| 70% | 1.8 | 3.7 | 5.5 | 7.3 | 9.2 | 11.0 | 12.8 | 14.7 | 16.5 | 18.3 |
| 80% | 2.1 | 4.2 | 6.3 | 8.4 | 10.5 | 12.6 | 14.7 | 16.8 | 18.9 | 21.0 |
| 90% | 2.4 | 4.8 | 7.1 | 9.5 | 11.9 | 14.3 | 16.7 | 19.0 | 21.4 | 23.8 |
| 100% | 2.6 | 5.3 | 7.9 | 10.6 | 13.2 | 15.9 | 18.5 | 21.1 | 23.8 | 26.4 |
| Panel (b) Brazil | ||||||||||
| % of income lost | 10% | 20% | 30% | 40% | 50% | 60% | 70% | 80% | 90% | 100% |
| % households losing income | ||||||||||
| 10% | 0.3 | 0.5 | 0.8 | 1.1 | 1.3 | 1.6 | 1.8 | 2.1 | 2.4 | 2.6 |
| 20% | 0.5 | 1.1 | 1.6 | 2.1 | 2.7 | 3.2 | 3.7 | 4.3 | 4.8 | 5.4 |
| 30% | 0.8 | 1.6 | 2.4 | 3.2 | 4.1 | 4.9 | 5.7 | 6.5 | 7.3 | 8.1 |
| 40% | 1.1 | 2.2 | 3.2 | 4.3 | 5.4 | 6.5 | 7.5 | 8.6 | 9.7 | 10.8 |
| 50% | 1.3 | 2.7 | 4.0 | 5.4 | 6.7 | 8.1 | 9.4 | 10.7 | 12.1 | 13.4 |
| 60% | 1.6 | 3.2 | 4.8 | 6.4 | 8.1 | 9.7 | 11.3 | 12.9 | 14.5 | 16.1 |
| 70% | 1.9 | 3.8 | 5.6 | 7.5 | 9.4 | 11.3 | 13.2 | 15.0 | 16.9 | 18.8 |
| 80% | 2.2 | 4.3 | 6.5 | 8.6 | 10.8 | 12.9 | 15.1 | 17.3 | 19.4 | 21.6 |
| 90% | 2.4 | 4.8 | 7.3 | 9.7 | 12.1 | 14.5 | 17.0 | 19.4 | 21.8 | 24.2 |
| 100% | 2.7 | 5.4 | 8.1 | 10.8 | 13.5 | 16.2 | 18.9 | 21.6 | 24.3 | 27.0 |
| Panel (c) Colombia | ||||||||||
| % of income lost | 10% | 20% | 30% | 40% | 50% | 60% | 70% | 80% | 90% | 100% |
| % households losing income | ||||||||||
| 10% | 0.3 | 0.7 | 1.0 | 1.4 | 1.7 | 2.0 | 2.4 | 2.7 | 3.1 | 3.4 |
| 20% | 0.7 | 1.3 | 2.0 | 2.6 | 3.3 | 3.9 | 4.6 | 5.2 | 5.9 | 6.6 |
| 30% | 1.0 | 2.0 | 2.9 | 3.9 | 4.9 | 5.9 | 6.9 | 7.8 | 8.8 | 9.8 |
| 40% | 1.3 | 2.6 | 4.0 | 5.3 | 6.6 | 7.9 | 9.2 | 10.5 | 11.9 | 13.2 |
| 50% | 1.7 | 3.3 | 5.0 | 6.6 | 8.3 | 9.9 | 11.6 | 13.3 | 14.9 | 16.6 |
| 60% | 2.0 | 4.0 | 6.0 | 8.0 | 10.0 | 12.0 | 13.9 | 15.9 | 17.9 | 19.9 |
| 70% | 2.3 | 4.7 | 7.0 | 9.4 | 11.7 | 14.0 | 16.4 | 18.7 | 21.1 | 23.4 |
| 80% | 2.7 | 5.3 | 8.0 | 10.7 | 13.4 | 16.0 | 18.7 | 21.4 | 24.0 | 26.7 |
| 90% | 3.0 | 6.0 | 9.0 | 12.0 | 15.0 | 18.0 | 21.1 | 24.1 | 27.1 | 30.1 |
| 100% | 3.4 | 6.8 | 10.2 | 13.6 | 17.0 | 20.4 | 23.8 | 27.2 | 30.6 | 34.0 |
| Panel (d) Mexico | ||||||||||
| % of income lost | 10% | 20% | 30% | 40% | 50% | 60% | 70% | 80% | 90% | 100% |
| % households losing income | ||||||||||
| 10% | 0.3 | 0.6 | 1.0 | 1.3 | 1.6 | 1.9 | 2.3 | 2.6 | 2.9 | 3.2 |
| 20% | 0.6 | 1.3 | 1.9 | 2.6 | 3.2 | 3.9 | 4.5 | 5.2 | 5.8 | 6.4 |
| 30% | 1.0 | 1.9 | 2.9 | 3.9 | 4.9 | 5.8 | 6.8 | 7.8 | 8.7 | 9.7 |
| 40% | 1.3 | 2.6 | 3.9 | 5.2 | 6.5 | 7.8 | 9.1 | 10.4 | 11.7 | 13.0 |
| 50% | 1.6 | 3.3 | 4.9 | 6.5 | 8.1 | 9.8 | 11.4 | 13.0 | 14.6 | 16.3 |
| 60% | 2.0 | 3.9 | 5.9 | 7.8 | 9.8 | 11.8 | 13.7 | 15.7 | 17.7 | 19.6 |
| 70% | 2.3 | 4.6 | 6.9 | 9.1 | 11.4 | 13.7 | 16.0 | 18.3 | 20.6 | 22.8 |
| 80% | 2.6 | 5.2 | 7.8 | 10.5 | 13.1 | 15.7 | 18.3 | 20.9 | 23.5 | 26.1 |
| 90% | 2.9 | 5.9 | 8.8 | 11.7 | 14.7 | 17.6 | 20.5 | 23.5 | 26.4 | 29.3 |
| 100% | 3.3 | 6.6 | 9.9 | 13.1 | 16.4 | 19.7 | 23.0 | 26.3 | 29.6 | 32.8 |
-
Notes: Highlighted cells correspond to losses similar to the loss projections by IMF published in May 2021 (IMF, 2021). The pink is the scenario where in addition to macroeconomic consistency, the share of households that have reported losing income corresponds to the available information.
-
Source: Authors’ calculations based on ENIGH (2018), EPH (2019), GEIH (2019), PNADC (2019).
COVID-19 New and Expanded Social Assistance Included in Simulations
| Country | Program | Target population of new programs | Number of transfers | Amount of the transfers | Transfer as % of poverty lines | Total beneficiaries by the end of the year (administrative data) | Fiscal cost as % of GDP | ||
|---|---|---|---|---|---|---|---|---|---|
| LCU | USD | National | $5.50 PPP | ||||||
| Argentina | Ingreso Familiar de Emergencia* | Vulnerable, Informal workers | 3 | ARG$10,000 | US$148 | 113.5 | 253.3 | 9 million people | 1.41% |
| AUH / AUE | - | 1 | ARG$3,100 | US$46 | 35.2 | 78.5 | 4.3 million people | 0.07% | |
| memo: Total | memo: Total | 1.48% | |||||||
| Brazil | Auxílio Emergencial* | Vulnerable, Informal workers | 9 | R$300-R$600 | US$53-US$107 | 121.9 | 140.3 | 67 million people | 3.32% |
| memo: Total | memo: Total | 3.32% | |||||||
| Colombia | Ingreso solidario* | Vulnerable, Informal workers | 9 | COL$160,000 | US$42 | 65.9 | 58.8 | 3 million households | 0.44% |
| Bogotá solidaria* | Vulnerable, Informal workers | 5 | COL$233,000 | US$60 | 95.9 | 85.6 | 521 thousand households | 0.06% | |
| Familias en Acción | - | 5 | COL$145,000 | US$38 | 59.7 | 53.2 | 2.6 million households | 0.19% | |
| Jóvenes en Acción | - | 5 | COL$356,000 | US$92 | 146.5 | 130.7 | 204 thousand people | 0.04% | |
| Colombia Mayor | - | 5 | COL$160,000 | US$42 | 65.9 | 58.8 | 1.7 million people | 0.14% | |
| memo: Total | memo: Total | 0.87% | |||||||
| Mexico | No additional social assistance | ||||||||
-
Notes: * refers to new social assistance programs that were introduced in the first months of lockdowns. For a more detailed description (and sources) see Table A2 in the Appendix. Amount of the transfer in (LCU/USD) prices of May 2020. The number of beneficiaries in the simulations do not necessarily correspond exactly to those shown above because in Argentina the simulations apply to urban areas only. The numerator of the fiscal cost is obtained by multiplying the size of the transfers by the number of times it was given and the number of beneficiaries; the denominator equals GDP per IMF projections for 2020 (IMF, 2021).
Gini Coefficient
| Pre-Pandemic | Post-Pandemic Without Expanded Social Assistance | Post-Pandemic With Expanded Social Assistance | |||
|---|---|---|---|---|---|
| Country | Gini Coefficient | Gini Coefficient | Change (Gini points) | Gini Coefficient | Change (Gini points) |
| Panel (a) "Concentrated Losses" Scenario | |||||
| Argentina (urban) | 44.4 | 48.6 | 4.2 | 46.9 | 2.5 |
| Brazil | 55.4 | 57.0 | 1.6 | 53.3 | -2.1 |
| Colombia | 55.0 | 58.2 | 3.1 | 56.9 | 1.9 |
| Mexico | 46.4 | 49.3 | 2.9 | 49.3 | 2.9 |
| Panel (b) "Dispersed Losses" Scenario | |||||
| Argentina (urban) | 44.4 | 46.7 | 2.2 | 45.1 | 0.7 |
| Brazil | 55.4 | 56.1 | 0.8 | 52.5 | -2.9 |
| Colombia | 55.0 | 56.0 | 0.9 | 54.8 | -0.2 |
| Mexico | 46.4 | 47.7 | 1.3 | 47.7 | 1.3 |
| Panel (c) "Actual Losses" Scenario | |||||
| Argentina (urban) | 44.4 | 47.0 | 2.6 | 45.3 | 0.9 |
| Brazil | 55.4 | 56.1 | 0.8 | 52.5 | -2.9 |
| Colombia | 55.0 | 56.2 | 1.2 | 55.1 | 0.1 |
| Mexico | 46.4 | 47.9 | 1.5 | 47.9 | 1.5 |
-
Note: Change is the difference between post- and pre-pandemic Gini coefficients.
-
Source: Authors’ calculations based on ENIGH (2018), EPH (2019), GEIH (2019), PNADC (2019).
Incidence of Poverty, National Poverty Line
| Pre-Pandemic | Post-Pandemic Without Expanded Social Assistance | Post-Pandemic With Expanded Social Assistance | |||||
|---|---|---|---|---|---|---|---|
| Country | Headcount ratio (%) | Headcount ratio (%) | Change (pp.) | New poor (in millions) | Headcount ratio (%) | Change (pp.) | New poor (in millions) |
| Panel (a) "Concentrated Losses" Scenario | |||||||
| Argentina (urban) | 35.5 | 42.8 | 7.2 | 2.0 | 40.3 | 4.8 | 1.4 |
| Brazil | 28.2 | 31.8 | 3.6 | 7.5 | 26.1 | -2.0 | -4.3 |
| Colombia | 31.8 | 36.9 | 5.2 | 2.5 | 34.8 | 3.0 | 1.5 |
| Mexico | 53.8 | 58.6 | 4.9 | 6.1 | 58.6 | 4.9 | 6.1 |
| Panel (b) "Dispersed Losses" Scenario | |||||||
| Argentina (urban) | 35.5 | 43.1 | 7.6 | 2.1 | 40.7 | 5.1 | 1.4 |
| Brazil | 28.2 | 31.0 | 2.9 | 6.0 | 24.9 | -3.3 | -6.8 |
| Colombia | 31.8 | 36.0 | 4.2 | 2.1 | 33.4 | 1.7 | 0.8 |
| Mexico | 53.8 | 59.3 | 5.5 | 6.9 | 59.3 | 5.5 | 6.9 |
| Panel (c) "Actual Losses" Scenario | |||||||
| Argentina (urban) | 35.5 | 43.0 | 7.4 | 2.1 | 40.7 | 5.2 | 1.5 |
| Brazil | 28.2 | 31.0 | 2.9 | 6.0 | 24.9 | -3.3 | -6.8 |
| Colombia | 31.8 | 36.4 | 4.6 | 2.3 | 34.1 | 2.3 | 1.1 |
| Mexico | 53.8 | 59.3 | 5.5 | 6.9 | 59.3 | 5.5 | 6.9 |
-
Notes: Change is the difference between post- and pre-pandemic headcount ratios. The number of new poor is calculated as the change in post- and pre-pandemic headcount ratios times the projected population for 2020 obtained from the World Bank World Development Indicators. pp: percentage points.
-
Source: Authors’ calculations based on ENIGH (2018), EPH (2019), GEIH (2019), PNADC (2019).
Incidence of Poverty, $5.5 PPP Poverty Line
| Pre-Pandemic | Post-Pandemic Without Expanded Social Assistance | Post-Pandemic With Expanded Social Assistance | |||||
|---|---|---|---|---|---|---|---|
| Country | Headcount ratio (%) | Headcount ratio (%) | Change (pp.) | New poor (in millions) | Headcount ratio (%) | Change (pp.) | New poor (in millions) |
| Panel (a) "Concentrated Losses" Scenario | |||||||
| Argentina (urban) | 10.9 | 19.1 | 8.2 | 2.3 | 16.8 | 5.9 | 1.7 |
| Brazil | 25.4 | 28.9 | 3.5 | 7.4 | 22.2 | -3.2 | -6.7 |
| Colombia | 37.6 | 42.6 | 5.0 | 2.5 | 40.8 | 3.2 | 1.6 |
| Mexico | 34.9 | 41.6 | 6.8 | 8.5 | 41.6 | 6.8 | 8.5 |
| Panel (b) "Dispersed Losses" Scenario | |||||||
| Argentina (urban) | 10.9 | 16.5 | 5.6 | 1.6 | 13.0 | 2.1 | 0.6 |
| Brazil | 25.4 | 27.6 | 2.2 | 4.6 | 20.6 | -4.7 | -9.9 |
| Colombia | 37.6 | 42.1 | 4.5 | 2.2 | 40.3 | 2.7 | 1.3 |
| Mexico | 34.9 | 41.6 | 6.7 | 8.4 | 41.6 | 6.7 | 8.4 |
| Panel (c) "Actual Losses" Scenario | |||||||
| Argentina (urban) | 10.9 | 15.8 | 4.9 | 1.4 | 12.8 | 1.9 | 0.5 |
| Brazil | 25.4 | 27.6 | 2.2 | 4.6 | 20.6 | -4.7 | -9.9 |
| Colombia | 37.6 | 41.8 | 4.2 | 2.1 | 39.8 | 2.2 | 1.1 |
| Mexico | 34.9 | 41.3 | 6.5 | 8.1 | 41.3 | 6.5 | 8.1 |
-
Notes: Change is the difference between post- and pre-pandemic headcount ratios. The number of new poor is calculated as the change in post- and pre-pandemic headcount ratios times the projected population for 2020 obtained from the World Bank World Development Indicators. pp: percentage points.
-
Source: Authors’ calculations based on ENIGH (2018), EPH (2019), GEIH (2019), PNADC (2019).
Income Mobility
| Post-Pandemic Without Expanded Social Assistance | Post-Pandemic With Expanded Social Assistance | |||||
|---|---|---|---|---|---|---|
| Country | % of moderate poor who fall to poor | % of the vulnerable who fall to moderate poor or below | % of the middle class who fall to moderate poor or below | % of moderate poor who fall to poor | % of the vulnerable who fall to moderate poor or below | % of the middle class who fall to moderate poor or below |
| Panel (a) "Concentrated Losses" Scenario | ||||||
| Argentina (urban) | 22.6 | 20.8 | 6.2 | 19.2 | 19.0 | 5.8 |
| Brazil | 10.2 | 8.9 | 2.7 | 6.8 | 6.9 | 1.9 |
| Colombia | 9.7 | 11.5 | 4.9 | 9.3 | 11.1 | 4.8 |
| Mexico | 15.2 | 15.1 | 3.7 | 15.2 | 15.1 | 3.7 |
| Panel (b) "Dispersed Losses" Scenario | ||||||
| Argentina (urban) | 27.5 | 21.9 | 0.0 | 7.8 | 13.0 | 0.0 |
| Brazil | 10.2 | 8.3 | 0.0 | 1.3 | 2.3 | 0.0 |
| Colombia | 15.8 | 14.2 | 0.0 | 10.2 | 10.7 | 0.0 |
| Mexico | 18.1 | 16.9 | 0.0 | 18.1 | 16.9 | 0.0 |
| Panel (c) "Actual Losses" Scenario | ||||||
| Argentina (urban) | 27.4 | 24.5 | 0.0 | 10.6 | 15.3 | 0.0 |
| Brazil | 10.2 | 8.3 | 0.0 | 1.3 | 2.3 | 0.0 |
| Colombia | 17.1 | 15.3 | 0.0 | 12.5 | 12.8 | 0.0 |
| Mexico | 21.0 | 17.3 | 0.0 | 21.0 | 17.3 | 0.0 |
-
Note: Income groups in terms of 2011 PPP are: poor: below $3.20; moderate poor: between $3.20 and below $5.50 per day; vulnerable: between $5.50 and below $11.50 per day; and middle class: between $11.50 and below $57.60 per day.
-
Source: Authors’ calculations based on ENIGH (2018), EPH (2019), GEIH (2019), PNADC (2019).
Employment by Sector
| Panel (a) Argentina (urban) | |||
| Sector | Not at risk | At risk | Total |
| Agriculture | 65,109 | 0 | 65,109 |
| Mining | 36,897 | 12,281 | 49,178 |
| Manufacturing | 7,36,190 | 6,63,709 | 13,99,899 |
| Electricity, gas and water supply | 52,041 | 37,702 | 89,743 |
| Construction | 1,19,479 | 9,84,050 | 11,03,529 |
| Retail and wholesale | 5,93,180 | 15,84,484 | 21,77,664 |
| Accommodation and food service | 1,12,358 | 3,44,128 | 4,56,486 |
| Transport | 1,50,331 | 4,90,213 | 6,40,544 |
| Information and communication | 86,118 | 1,70,555 | 2,56,673 |
| Financial services | 1,78,675 | 88,681 | 2,67,356 |
| Real estate | 36,809 | 30,604 | 67,413 |
| Professional activities | 6,95,307 | 2,51,581 | 9,46,888 |
| Public administration | 10,16,020 | 0 | 10,16,020 |
| Education | 10,12,903 | 0 | 10,12,903 |
| Health | 7,93,233 | 0 | 7,93,233 |
| Other sectors | 3,49,785 | 14,04,260 | 17,54,045 |
| Total | 60,34,435 | 60,62,248 | 1,20,96,683 |
| % | 49.9% | 50.1% | |
| Panel (b) Brazil | |||
| Sector | Not at risk | At risk | Total |
| Agriculture | 86,36,764 | 0 | 86,36,764 |
| Mining | 3,84,819 | 28,358 | 4,13,177 |
| Manufacturing | 39,96,924 | 69,10,053 | 1,09,06,977 |
| Electricity, gas and water supply | 7,44,746 | 1,53,773 | 8,98,519 |
| Construction | 3,21,999 | 64,93,117 | 68,15,116 |
| Retail and wholesale | 83,52,357 | 95,43,628 | 1,78,95,985 |
| Accommodation and food service | 3,85,260 | 52,36,263 | 56,21,523 |
| Transport | 26,41,323 | 21,94,322 | 48,35,645 |
| Information and communication | 12,41,353 | 1,02,909 | 13,44,262 |
| Financial services | 11,03,351 | 1,68,406 | 12,71,757 |
| Real estate | 70,257 | 4,76,066 | 5,46,323 |
| Professional activities | 40,62,780 | 34,81,562 | 75,44,342 |
| Public administration | 51,11,266 | 0 | 51,11,266 |
| Education | 65,88,520 | 0 | 65,88,520 |
| Health | 47,47,906 | 0 | 47,47,906 |
| Other sectors | 6,98,142 | 1,06,02,821 | 1,13,00,963 |
| Total | 4,90,87,767 | 4,53,91,278 | 9,44,79,045 |
| % | 52.0% | 48.0% | |
| Panel (c) Colombia | |||
| Sector | Not at risk | At risk | Total |
| Agriculture | 35,15,167 | 0 | 35,15,167 |
| Mining | 1,95,612 | 1,222 | 1,96,834 |
| Manufacturing | 14,50,032 | 10,89,303 | 25,39,335 |
| Electricity, gas and water supply | 1,13,037 | 38,081 | 1,51,118 |
| Construction | 1,20,927 | 13,92,706 | 15,13,633 |
| Retail and wholesale | 16,32,476 | 28,15,331 | 44,47,807 |
| Accommodation and food service | 26,771 | 14,92,637 | 15,19,408 |
| Transport | 5,18,790 | 9,46,252 | 14,65,042 |
| Information and communication | 2,13,505 | 46,873 | 2,60,378 |
| Financial services | 3,05,304 | 26,567 | 3,31,871 |
| Real estate | 40,836 | 3,11,224 | 3,52,060 |
| Professional activities | 7,92,673 | 5,54,786 | 13,47,459 |
| Public administration | 7,11,302 | 0 | 7,11,302 |
| Education | 9,59,010 | 0 | 9,59,010 |
| Health | 9,56,935 | 0 | 9,56,935 |
| Other sectors | 2,05,906 | 16,88,689 | 18,94,595 |
| Total | 1,17,58,283 | 1,04,03,671 | 2,21,61,954 |
| % | 53.1% | 46.9% | |
| Panel (d) Mexico | |||
| Sector | Not at risk | At risk | Total |
| Agriculture | 89,53,313 | 0 | 89,53,313 |
| Mining | 1,98,514 | 0 | 1,98,514 |
| Manufacturing | 40,98,366 | 54,70,030 | 95,68,396 |
| Electricity, gas and water supply | 2,20,675 | 655 | 2,21,330 |
| Construction | 3,48,183 | 44,77,639 | 48,25,822 |
| Retail and wholesale | 58,93,101 | 51,45,482 | 1,10,38,583 |
| Accommodation and food service | 1,81,228 | 47,54,290 | 49,35,518 |
| Transport | 8,13,780 | 16,28,415 | 24,42,195 |
| Information and communication | 4,70,479 | 0 | 4,70,479 |
| Financial services | 5,58,741 | 557 | 5,59,298 |
| Real estate | 3,77,231 | 108 | 3,77,339 |
| Professional activities | 13,51,674 | 31,126 | 13,82,800 |
| Public administration | 21,72,350 | 0 | 21,72,350 |
| Education | 28,18,952 | 0 | 28,18,952 |
| Health | 16,70,654 | 0 | 16,70,654 |
| Other sectors | 62,08,673 | 55,66,657 | 1,17,75,330 |
| Total | 3,63,35,914 | 2,70,74,959 | 6,34,10,873 |
| % | 57.3% | 42.7% |
-
Source: Authors’ calculations based on ENIGH (2018), EPH (2019), GEIH (2019), PNADC (2019).
Description of Existing and New Social Assistance Programs by Country
| Argentina |
| NEW Ingreso Familiar de Emergencia is an unconditional transitory cash transfer to informal and vulnerable workers between 18 and 65 years old during the COVID-19 pandemic. The beneficiaries are individuals, and each household can receive only one allowance. Beneficiaries received three monthly payments of ARG $10,000 from May and July. The transfer amount represents 113.5% and 253.3% of the national and $5.5 PPP per day poverty lines. https://www.argentina.gob.ar/economia/medidas-economicas-COVID19/ingresofamiliardeemergencia |
| INCREASED Asignación Universal por Hijo is a conditional cash transfer program for children and adolescents (younger than 18 years old) living in poverty or vulnerability situations. The program includes conditions related to health and education obligations. The beneficiaries are individuals, and a household can receive up to 5 allowances. During the COVID-19 pandemic, the government announced a one-time extraordinary payment of ARG $3,100 in March. The transfer amount represents 35.2% and 78.5% of the national and $5.5 PPP per day poverty lines. https://www.anses.gob.ar/asignacion-universal-por-hijo https://www.argentina.gob.ar/economia/medidas-economicas-COVID19/bonos/AUH-AUE |
| Brazil |
| NEW Auxílio Emergencial is an unconditional transitory cash transfer to informal workers, individual microentrepreneurs, self-employed, and beneficiaries of Bolsa Família during the COVID-19 pandemic. The beneficiaries are individuals, and there are no restrictions on the number of allowances per household. Beneficiaries received five monthly payments of R $600 from April to August, and four monthly payments at half the original amount from September to December. The original transfer amount represents 121.9% and 140.3% of the national and $5.5 PPP per day poverty lines. https://www.caixa.gov.br/auxilio/PAGINAS/DEFAULT2.ASPX https://www.gov.br/cidadania/pt-br/servicos/sagi/relatorios/deolhonacidadania_3_2202.pdf |
| Colombia |
| NEW Ingreso Solidario is an unconditional transitory cash transfer program that aims to mitigate the situation of vulnerable households facing economic difficulties due to the COVID-19 pandemic. The beneficiaries of Ingreso Solidario are not obligated to any condition, but they must not be receiving any other social programs. The beneficiaries are households, and only one allowance per household is permitted. Beneficiarios received nine monthly payments of COL $160,000 from April to December. The program represents around 65.9% and 58.8% of the national and $5.5 PPP per day poverty lines. https://ingresosolidario.dnp.gov.co/ |
| NEW Bogotá Solidaria is an unconditional cash transfer program (from Bogotá’s Mayor Office) to support vulnerable and poor families in the city during the COVID-19 pandemic. The beneficiaries of Bogotá Solidario must not have any intra-household violence record. The beneficiaries are households, and only one allowance per household is permitted. Beneficiaries received five payments of COL $233,000. The program represents around 95.9% and 85.6% of the national and $5.5 PPP per day poverty lines. https://rentabasicabogota.gov.co/ |
| INCREASED Familias en Acción is a conditional cash transfer program for children and adolescents (younger than 18 years old) living under food insecurity conditions. The beneficiaries are individuals, and a household can receive up to 3 allowances. The program includes conditions related to health and education obligations. During the COVID-19 pandemic, the government announced five extraordinary payments of COL $145,000 delivered every two months between March and December. The program represents around 59.7% and 53.2% of the national and $5.5 PPP per day poverty lines. https://prosperidadsocial.gov.co/sgpp/transferencias/familias-en-accion/ https://prosperidadsocial.gov.co/asi-vamos-contra-el-covid-19/ |
| INCREASED Jóvenes en Acción is a conditional cash transfer program for young adults (between 16 to 24 years old) facing economic difficulties to continue or finish their studies. The program includes conditions related to eligibility criteria on other programs such as Familias en Accion and Red de la Superación de la Pobreza Extrema. The beneficiaries are individuals, and there are no restrictions on the number of allowances per household. During the COVID-19 pandemic, the government announced five-time extraordinary payments of COL $356,000 delivered every two months between March and December. The program represents around 146.5% and 130.7% of the national and $5.5 PPP per day poverty lines. https://prosperidadsocial.gov.co/sgpp/transferencias/jovenes-en-accion/ https://prosperidadsocial.gov.co/asi-vamos-contra-el-covid-19/ |
| INCREASED Colombia Mayor is an unconditional cash transfer program for older adults without a pension or who live in extreme poverty or indigence. The beneficiaries are individuals, and there are no restrictions on the number of allowances per household. During the COVID-19 pandemic, the government announced five-time extraordinary payments of COL $160,000 delivered every two months between March and December. The program represents around 65.9% and 58.8% of the national and $5.5 PPP per day poverty lines. https://prosperidadsocial.gov.co/Noticias/disponible-pago-ordinario-y-extraordinario-para-beneficiarios-de-colombia-mayor/ |
Gini Coefficient for Scenarios with Losses Similar to the Loss Projections by IMF (2021)
| Pre-Pandemic | Post-Pandemic Without Expanded Social Assistance | Post-Pandemic With Expanded Social Assistance | ||||
|---|---|---|---|---|---|---|
| Country | Scenario | Gini Coefficient | Gini Coefficient | Change (Gini points) | Gini Coefficient | Change (Gini points) |
| Argentina (urban) | 40% lose 90% | 44.4 | 48.6 | 4.2 | 46.9 | 2.5 |
| Argentina (urban) | 50% lose 70% | 44.4 | 47.7 | 3.3 | 46.0 | 1.6 |
| Argentina (urban) | 60% lose 60% | 44.4 | 47.5 | 3.0 | 45.7 | 1.3 |
| Argentina (urban) | 70% lose 50% | 44.4 | 47.0 | 2.6 | 45.3 | 0.9 |
| Argentina (urban) | 90% lose 40% | 44.4 | 46.7 | 2.2 | 45.1 | 0.7 |
| Brazil | 20% lose 80% | 55.4 | 57.0 | 1.6 | 53.3 | -2.1 |
| Brazil | 30% lose 50% | 55.4 | 56.4 | 1.1 | 52.7 | -2.6 |
| Brazil | 40% lose 40% | 55.4 | 56.4 | 1.0 | 52.7 | -2.7 |
| Brazil | 50% lose 30% | 55.4 | 56.2 | 0.8 | 52.5 | -2.8 |
| Brazil | 80% lose 20% | 55.4 | 56.1 | 0.8 | 52.5 | -2.9 |
| Colombia | 20% lose 100% | 55.0 | 58.2 | 3.1 | 56.9 | 1.9 |
| Colombia | 30% lose 70% | 55.0 | 57.2 | 2.2 | 56.0 | 1.0 |
| Colombia | 40% lose 50% | 55.0 | 56.6 | 1.6 | 55.5 | 0.4 |
| Colombia | 50% lose 40% | 55.0 | 56.4 | 1.4 | 55.2 | 0.2 |
| Colombia | 70% lose 30% | 55.0 | 56.2 | 1.2 | 55.1 | 0.1 |
| Colombia | 100% lose 20% | 55.0 | 56.0 | 0.9 | 54.8 | -0.2 |
| Mexico | 30% lose 80% | 46.4 | 49.3 | 2.9 | 49.3 | 2.9 |
| Mexico | 40% lose 60% | 46.4 | 48.6 | 2.2 | 48.6 | 2.2 |
| Mexico | 50% lose 50% | 46.4 | 48.3 | 1.9 | 48.3 | 1.9 |
| Mexico | 60% lose 40% | 46.4 | 47.9 | 1.5 | 47.9 | 1.5 |
| Mexico | 80% lose 30% | 46.4 | 47.7 | 1.3 | 47.7 | 1.3 |
-
Notes: Change is the difference between post- and pre-pandemic Gini coefficients.
-
Source: Authors’ calculations based on ENIGH (2018), EPH (2019), GEIH (2019), PNADC (2019).
Incidence of Poverty for with Losses Similar to the Loss Projections by IMF (2021)
| Pre-Pandemic | Post-Pandemic Without Expanded Social Assistance | Post-Pandemic With Expanded Social Assistance | ||||||
|---|---|---|---|---|---|---|---|---|
| Country | Scenario | Headcount ratio (%) | Headcount ratio (%) | Change (pp.) | New poor (in millions) | Headcount ratio (%) | Change (pp.) | New poor (in millions) |
| Panel (a) National Poverty Line | ||||||||
| Argentina (urban) | 40% lose 90% | 35.5 | 42.8 | 7.2 | 2 | 40.3 | 4.8 | 1.4 |
| Argentina (urban) | 50% lose 70% | 35.5 | 42.9 | 7.4 | 2.1 | 40.3 | 4.7 | 1.3 |
| Argentina (urban) | 60% lose 60% | 35.5 | 43.1 | 7.6 | 2.1 | 40.6 | 5.1 | 1.4 |
| Argentina (urban) | 70% lose 50% | 35.5 | 43 | 7.4 | 2.1 | 40.7 | 5.2 | 1.5 |
| Argentina (urban) | 90% lose 40% | 35.5 | 43.1 | 7.6 | 2.1 | 40.7 | 5.1 | 1.4 |
| Brazil | 20% lose 80% | 28.2 | 31.8 | 3.6 | 7.5 | 26.1 | -2 | -4.3 |
| Brazil | 30% lose 50% | 28.2 | 31 | 2.8 | 5.8 | 25.2 | -3 | -6.2 |
| Brazil | 40% lose 40% | 28.2 | 31.1 | 3 | 6.2 | 25.1 | -3 | -6.3 |
| Brazil | 50% lose 30% | 28.2 | 30.9 | 2.7 | 5.6 | 24.8 | -3.3 | -6.9 |
| Brazil | 80% lose 20% | 28.2 | 31 | 2.9 | 6 | 24.9 | -3.3 | -6.8 |
| Colombia | 20% lose 100% | 31.8 | 36.9 | 5.2 | 2.5 | 34.8 | 3 | 1.5 |
| Colombia | 30% lose 70% | 31.8 | 37.1 | 5.3 | 2.6 | 35 | 3.2 | 1.6 |
| Colombia | 40% lose 50% | 31.8 | 36.5 | 4.7 | 2.3 | 34.4 | 2.6 | 1.3 |
| Colombia | 50% lose 40% | 31.8 | 36.5 | 4.7 | 2.3 | 34.2 | 2.4 | 1.2 |
| Colombia | 70% lose 30% | 31.8 | 36.4 | 4.6 | 2.3 | 34.1 | 2.3 | 1.1 |
| Colombia | 100% lose 20% | 31.8 | 36 | 4.2 | 2.1 | 33.4 | 1.7 | 0.8 |
| Mexico | 30% lose 80% | 53.8 | 58.6 | 4.9 | 6.1 | 58.6 | 4.9 | 6.1 |
| Mexico | 40% lose 60% | 53.8 | 59 | 5.2 | 6.5 | 59 | 5.2 | 6.5 |
| Mexico | 50% lose 50% | 53.8 | 59.5 | 5.7 | 7.1 | 59.5 | 5.7 | 7.1 |
| Mexico | 60% lose 40% | 53.8 | 59.3 | 5.5 | 6.9 | 59.3 | 5.5 | 6.9 |
| Mexico | 80% lose 30% | 53.8 | 59.3 | 5.5 | 6.9 | 59.3 | 5.5 | 6.9 |
| Panel (b) $5.5 PPP Poverty Line | ||||||||
| Argentina (urban) | 40% lose 90% | 10.9 | 19.1 | 8.2 | 2.3 | 16.8 | 5.9 | 1.7 |
| Argentina (urban) | 50% lose 70% | 10.9 | 18 | 7.1 | 2 | 14.9 | 4 | 1.1 |
| Argentina (urban) | 60% lose 60% | 10.9 | 17.5 | 6.6 | 1.9 | 13.9 | 3 | 0.9 |
| Argentina (urban) | 70% lose 50% | 10.9 | 16.5 | 5.6 | 1.6 | 13 | 2.1 | 0.6 |
| Argentina (urban) | 90% lose 40% | 10.9 | 15.8 | 4.9 | 1.4 | 12.8 | 1.9 | 0.5 |
| Brazil | 20% lose 80% | 25.4 | 28.9 | 3.5 | 7.4 | 22.2 | -3.2 | -6.7 |
| Brazil | 30% lose 50% | 25.4 | 27.9 | 2.6 | 5.4 | 21 | -4.4 | -9.1 |
| Brazil | 40% lose 40% | 25.4 | 27.9 | 2.5 | 5.3 | 21 | -4.4 | -9.2 |
| Brazil | 50% lose 30% | 25.4 | 27.5 | 2.1 | 4.5 | 20.6 | -4.7 | -9.9 |
| Brazil | 80% lose 20% | 25.4 | 27.6 | 2.2 | 4.6 | 20.6 | -4.7 | -9.9 |
| Colombia | 20% lose 100% | 37.6 | 42.6 | 5 | 2.5 | 40.8 | 3.2 | 1.6 |
| Colombia | 30% lose 70% | 37.6 | 42.7 | 5.2 | 2.5 | 41.1 | 3.5 | 1.7 |
| Colombia | 40% lose 50% | 37.6 | 42.3 | 4.8 | 2.3 | 40.6 | 3 | 1.5 |
| Colombia | 50% lose 40% | 37.6 | 42.2 | 4.7 | 2.3 | 40.4 | 2.9 | 1.4 |
| Colombia | 70% lose 30% | 37.6 | 42.1 | 4.5 | 2.2 | 40.3 | 2.7 | 1.3 |
| Colombia | 100% lose 20% | 37.6 | 41.8 | 4.2 | 2.1 | 39.8 | 2.2 | 1.1 |
| Mexico | 30% lose 80% | 34.9 | 41.6 | 6.8 | 8.5 | 41.6 | 6.8 | 8.5 |
| Mexico | 40% lose 60% | 34.9 | 41.8 | 6.9 | 8.7 | 41.8 | 6.9 | 8.7 |
| Mexico | 50% lose 50% | 34.9 | 42.1 | 7.3 | 9.1 | 42.1 | 7.3 | 9.1 |
| Mexico | 60% lose 40% | 34.9 | 41.6 | 6.7 | 8.4 | 41.6 | 6.7 | 8.4 |
| Mexico | 80% lose 30% | 34.9 | 41.3 | 6.5 | 8.1 | 41.3 | 6.5 | 8.1 |
-
Notes: Change is the difference between post- and pre-pandemic headcount ratios. The number of new poor is calculated as the change in post- and pre-pandemic headcount ratios times the projected population for 2020 obtained from the World Bank World Development Indicators. pp: percentage points.
-
Source: Authors’ calculations based on ENIGH (2018), EPH (2019), GEIH (2019), PNADC (2019).
Squared Poverty Gap, National Poverty Line
| Pre-Pandemic | Post-Pandemic Without Expanded Social Assistance | Post-Pandemic With Expanded Social Assistance | |||
|---|---|---|---|---|---|
| Country | Squared poverty gap (%) | Squared poverty gap (%) | Change (pp.) | Squared poverty gap (%) | Change (pp.) |
| Panel (a) "Concentrated Losses" Scenario | |||||
| Argentina (urban) | 7.8 | 13.9 | 6.1 | 11.6 | 3.8 |
| Brazil | 9 | 10.9 | 2 | 5.9 | -3 |
| Colombia | 8.9 | 14 | 5 | 12.2 | 3.3 |
| Mexico | 10.7 | 15.2 | 4.5 | 15.2 | 4.5 |
| Panel (b) "Dispersed Losses" Scenario | |||||
| Argentina (urban) | 7.8 | 10.8 | 3 | 8.7 | 1 |
| Brazil | 9 | 9.7 | 0.7 | 5.1 | -3.8 |
| Colombia | 8.9 | 10 | 1.1 | 8.5 | -0.4 |
| Mexico | 10.7 | 13.3 | 2.6 | 13.3 | 2.6 |
| Panel (c) "Actual Losses" Scenario | |||||
| Argentina (urban) | 7.8 | 11.1 | 3.3 | 9 | 1.2 |
| Brazil | 9 | 9.7 | 0.7 | 5.1 | -3.8 |
| Colombia | 8.9 | 10.3 | 1.3 | 8.7 | -0.2 |
| Mexico | 10.7 | 13.6 | 2.9 | 13.6 | 2.9 |
-
Note: Change is the difference between post- and pre-pandemic squared poverty gaps. pp: percentage points.
-
Source: Authors’ calculations based on ENIGH (2018), EPH (2019), GEIH (2019), PNADC (2019).
Squared Poverty Gap, $5.5 PPP Poverty Line
| Pre-Pandemic | Post-Pandemic Without Expanded Social Assistance | Post-Pandemic With Expanded Social Assistance | |||
|---|---|---|---|---|---|
| Country | Squared poverty gap (%) | Squared poverty gap (%) | Change (pp.) | Squared poverty gap (%) | Change (pp.) |
| Panel (a) "Concentrated Losses" Scenario | |||||
| Argentina (urban) | 2.2 | 6.1 | 3.9 | 3.9 | 1.8 |
| Brazil | 7.7 | 9.5 | 1.8 | 4.7 | -3 |
| Colombia | 11.1 | 16.2 | 5.1 | 14.4 | 3.2 |
| Mexico | 6 | 9.7 | 3.7 | 9.7 | 3.7 |
| Panel (b) "Dispersed Losses" Scenario | |||||
| Argentina (urban) | 2.2 | 3 | 0.8 | 1.8 | -0.4 |
| Brazil | 7.7 | 8.3 | 0.6 | 4 | -3.7 |
| Colombia | 11.1 | 12.4 | 1.2 | 10.8 | -0.4 |
| Mexico | 6 | 7.6 | 1.6 | 7.6 | 1.6 |
| Panel (c) "Actual Losses" Scenario | |||||
| Argentina (urban) | 2.2 | 3.2 | 1 | 1.8 | -0.3 |
| Brazil | 7.7 | 8.3 | 0.6 | 4 | -3.7 |
| Colombia | 11.1 | 12.6 | 1.5 | 11 | -0.1 |
| Mexico | 6 | 7.9 | 1.9 | 7.9 | 1.9 |
-
Note: Change is the difference between post- and pre-pandemic squared poverty gaps. pp: percentage points.
-
Source: Authors’ calculations based on ENIGH (2018), EPH (2019), GEIH (2019), PNADC (2019).
Data and code availability
Data is publicly available. The household surveys used here are: Argentina: Encuesta Permanente de Hogares (EPH, 2019), Brazil: Pesquisa Nacional por Amostra de Domicilios Continua (PNADC, 2019), Colombia: Gran Encuesta Integrada de Hogares (GEIH, 2019), Mexico: Encuesta Nacional de Ingresos y Gastos de los Hogares (ENIGH, 2018). Code is open-source and available upon request. As of June 2023, the code will be available at: https://commitmentoequity.org/.