Tax and Benefit Policies to Reduce Poverty in the Netherlands: A Microsimulation Analysis
- The Netherlands Institute for Social Research (SCP), The Netherlands
- CPB Netherlands Bureau for Economic Policy Analysis, The Netherlands
Abstract
With around a million people – or 6% of the population – living below the threshold, poverty remains a tenacious problem in the Netherlands. It is especially prevalent among children, migrants and the very elderly. Planned policies, if implemented, will cause poverty to rise by 28% over the next decades, everything else equal. We use two microsimulation models to estimate the effects of various tax-benefit policies and four larger reforms on poverty. To estimate the costs of implementing these policies and reforms, we also document their effects on employment, income inequality and the government budget. The results indicate that reducing poverty is possible but involves considerable costs in terms of public money and/or jobs. Introducing a budget-neutral universal basic income at the level of the state pension reduces poverty by 60% but requires very high income tax rates and reduces employment by 8%. Other policy options are cheaper but generate smaller reductions in poverty. These findings demonstrate the social trilemma faced by policymakers in modern welfare states: to simultaneously provide adequate minimum income support, maintain sufficient financial incentives for people to find a job, ánd keep the government budget in check. This has become increasingly difficult due to slow wage growth at the bottom of the earnings distribution. However, we also find important differences in cost efficiency. Of the policies with a budgetary impact of 1 billion euros, increasing minimum income support achieves the largest reduction in poverty. Raising the means-tested child budget is a relatively efficient way of reducing child poverty.
1. Introduction
With around a million people – or 6% of the population – living below the threshold, poverty in the Netherlands has hardly declined over the past decades (Goderis, 2020). It is especially prevalent among children, migrants and the very elderly, and it is not expected to disappear in the near future. In fact, if implemented, planned policies will cause poverty to rise by more than a quarter over the next decades, everything else equal (Olsthoorn et al., 2020). In the short term, the steep rise in consumer prices puts further pressure on the standard of living, in particular for those at the bottom of the income distribution. While this is expected to increase poverty in 2022, the extensive support package of the Dutch government is expected to (at least temporarily) mitigate these effects in 2023 (CPB Netherlands Bureau for Economic Policy Analysis, 2022).1
In this paper we use microsimulation analysis to estimate the effects of a broad range of tax-benefit policies and four larger reforms on poverty in the Netherlands.2 We also document the effects on employment, income inequality and the government budget to quantify the costs of reducing poverty and to reveal the inherent trade-offs faced by policymakers. The ultimate aim is to give an in-depth overview of what Dutch tax and benefit policies can do in terms of reducing poverty and at what cost.
The paper builds on several strands of literature. It generally fits within the literature on antipoverty policy in advanced economies; see for example the comprehensive earlier studies by Cantillon et al. (2019), Guio et al., 2021 and Marx et al. (2015). When zooming into the specific aspects of our analysis, it primarily relates to a growing literature that uses microsimulation methods to assess the effects of a range of tax-benefit policies on the distribution of income. Examples include Immervoll et al. (2006) and Atkinson et al. (2017).3 Some of our findings also speak directly to studies that focus on one particular reform, such as raising minimum income benefit or introducing a basic income (see for example Browne and Immervoll, 2017; Hernández et al., 2022 and Martinelli, 2019). In this respect, the studies by Boone et al. (2018) and Aerts et al. (2021) that simulate the effects of introducing a basic income are of particular interest because of their shared focus on the Netherlands. The primary contribution of this study is that it simulates a broader range of antipoverty policies and compares their impact and cost efficiency. We briefly compare our main findings to those of earlier studies in the concluding section.
2. The Dutch system of taxes and benefits
The Dutch tax and benefit system is characterised by a broad variety of highly targeted, income-dependent tax credits, allowances and benefits, which vary in their degree of conditionality. While aimed at providing social assistance in a cost-efficient manner, they have also made the system complex and opaque. It is notoriously difficult for households to assess the consequences of a change in gross income for their net disposable income. As a result, various aspects of the system are the subject of fierce public debate, particularly the allowance scheme, which we describe below.
2.1. Social security: benefits and allowances
The most rudimentary form of social assistance available to Dutch citizens is a minimum income scheme called ‘bijstand’. It provides an income and assets tested safety net of last resort and tops up existing income, if any, so as to ensure that recipients receive the social minimum. The benefit is conditional, as recipients have to meet a number of requirements, such as actively searching for work and engaging in community service as a compensatory activity. The amounts vary with a person’s age and living situation and constitute the government norm for a minimum existence.4 They are updated twice a year based on changes in the reference minimum wage. This is the net income of a couple in the hypothetical situation that one of them receives a before tax benefit equal to the statutory gross minimum wage including holiday supplement, while the other receives nothing (and the pair does not have any other income).5 In practice, the benefit amounts constitute fixed proportions of this reference minimum wage. For working age singles aged above 21 without cost-sharing residents, the net amount equals 70% of the reference minimum wage. This percentage increases with the number of co-residents above the age of 21 but less than proportionally because larger households are assumed to realise economies of scale. As an example, couples receive 100% of the reference minimum wage, while a couple with a 25-year old child living at home receives 130%. No extra benefit is paid for minor children but child allowance and child budget are added to the norm amounts of their households.6
Another pillar of the Dutch social security system is the unconditional state pension, the ‘AOW’, to which each Dutch resident is entitled after they reach the official retirement age, which as of 2022 is 66 years and 7 months.7 Similar to the minimum income scheme, the net state pension is derived from the statutory minimum wage.8 It also proportionally depends on the number of years that someone resided in the Netherlands during the 50 years prior to retirement. As a result of the latter criterion, elderly migrants tend to have lower entitlements and are more likely to be poor. The state pension is financed through taxation on a pay-as-you-go basis. Most retirees also receive a second pillar, capital-funded pension from an employment-based scheme.
Dutch households are also entitled to unemployment benefit (‘WW’), which depends on the number of years a person has been employed; the benefit for widows and widowers (‘Anw’); and three types of disability benefits: unemployment benefits for short-term illness (‘ZW’) and long-term illness and disabilities (‘WIA’), and benefits for people who became disabled before they were 18 or who are enrolled in a vocational or university degree program (‘Wajong’).
Next to social benefits and the state pension, households may also be eligible for various allowances, known as ‘toeslag’ or ‘bijslag’, to cover particular expenses. Three of those are meant to contribute to the costs of caring for children. First, everyone who lives or works in the Netherlands (with some exceptions) and takes care of one or more children is entitled to a child allowance (‘kinderbijslag’). Secondly, households may be entitled to a child budget (‘kindgebonden budget’). This is a supplementary income and assets tested government contribution to the costs of raising a child, paid to parents or caretakers who also receive child allowance. Thirdly, working parents are entitled to an income tested child care allowance (‘kinderopvangtoeslag’) to cover part of the costs of child care.
Three additional, income and assets tested allowances are available to cover the costs of other basic goods and services. In particular, the rent allowance (‘huurtoeslag’) contributes to the costs of renting a home; the healthcare allowance (‘zorgtoeslag’) helps people in paying for (mandatory) health insurance; and, finally, special social assistance (‘bijzondere bijstand’) is available for costs that arise due to special circumstances and that are not covered by other allowances.
The various allowances feature different income definitions, thresholds and phase out rates, which add considerably to the complexity of the system. Moreover, households have to apply in order to receive the funds and the Dutch tax authority typically only checks much later whether the stated income is correct. The main advantage of this approach is that people who experience financial problems can quickly get support. The disadvantages are a non-take up rate of 10% and ex-post downward revisions of almost half of all awarded allowances. Such downward revisions increasingly leave households with excessively high levels of debt. They also contribute to ex-ante income uncertainty among allowance beneficiaries, as people feel increasingly insecure about whether the funds are actually theirs. It has become clear that the allowance system can also be a cause of poverty rather than a tool to prevent it. In light of these problems, the system has come under severe criticism for its complexity and inaccessibility. The call for a simpler system grew even louder after it became public that the Dutch tax authority had wrongly accused thousands of households of child care allowance fraud and demanded huge repayments. In January 2021, these problems led the Dutch government to resign.
2.2. Taxation and tax credits
In the Netherlands, income is divided into three different types of taxable income, and each type is taxed differently under its owns schedule, referred to as a ‘box’. Box 1 includes among other things income from work, benefits, allowances, pensions and homeownership. Box 2 consists of profits and dividends from a substantial financial interest in a company. Finally, Box 3 relates to income from savings and investments (including a second home). Table 1 provides a stylised overview of the Dutch system of taxes and benefits.
Stylized overview of the Dutch system of taxes and benefits
| Gross wages | + |
| Gross profits | + |
| Gross benefits | + |
| Gross pensions | + |
| (Assumed) gross income derived from wealth* | + |
| (Assumed) income derived from home ownership† | + |
| Gross income | |
| Taxes | - |
| Income tax credits | + |
| Fiscal effect of tax deductions | + |
| Net income | |
| Allowances | + |
| Various individual allowances and compensation schemes | + |
| Disposable income |
-
*
Income derived from financial wealth is not taxed directly. Instead, the tax authority makes assumptions about the amount of income derived from the total amount of net household wealth.
-
†
Home ownership is taxed indirectly by assuming that one derives income from owning a home (‘eigenwoningforfait’).
Our policy simulations focus on tax measures and regulations pertaining to income from work, benefits, allowances and pensions. Two tax brackets apply to these Box 1 income components. In 2022, the lower bracket was taxed at 37,1%, while the higher bracket was taxed at 49,5%. However, the effective marginal tax rate does not necessarily equal these tariffs, as households can lower their gross taxable income through tax deductions (‘aftrekposten’) while, at the same time, being entitled to various income tax credits and allowances, some of which depend on income and other characteristics.
The tax credits include a general tax credit (‘algemene heffingskorting’), an in-work tax credit (‘arbeidskorting’), an in-work tax credit for single parents and second earners in couples with children (‘inkomensafhankelijke combinatiekorting’), a tax credit for young people with disabilities (‘jonggehandicaptenkorting’), and tax credits for retirees (‘ouderenkorting’) and single retirees (‘alleenstaandeouderenkorting’). As before, these tax credits have different income definitions, thresholds and phase out rates, which make it difficult for households to assess the effect of a gross income change on their disposable income.
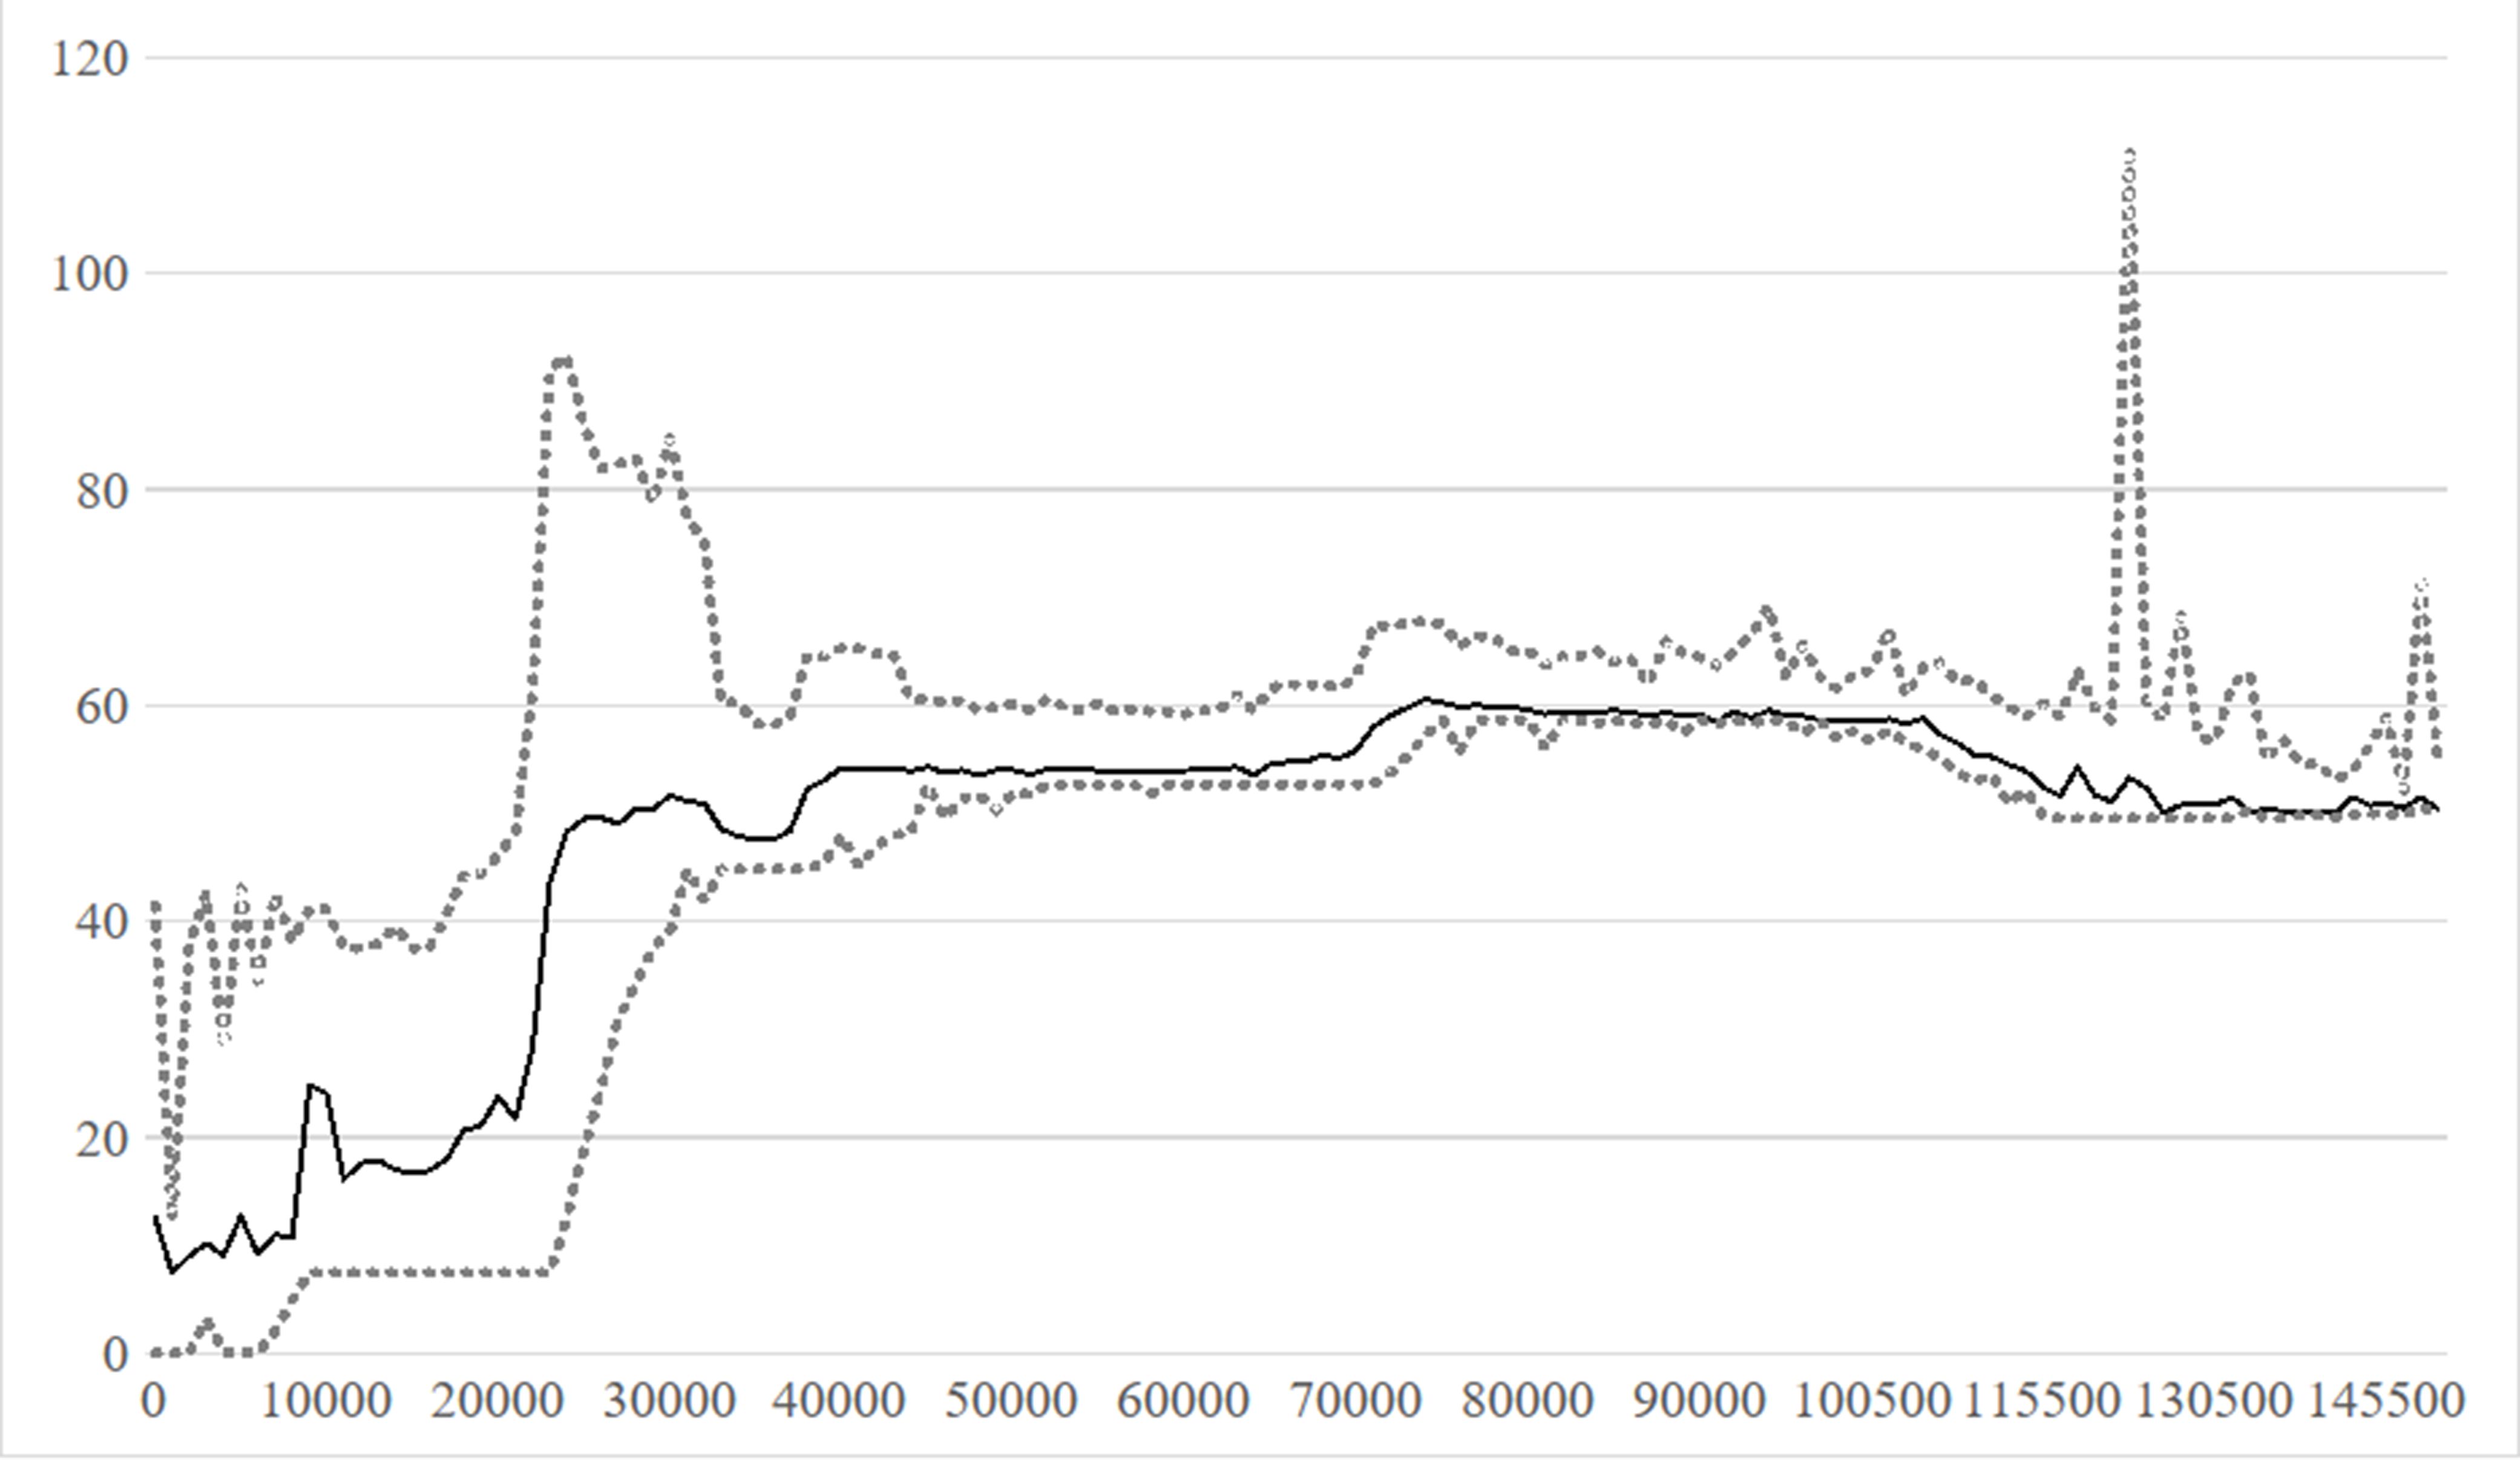
Figure 1 shows the net effective marginal income tax rates that result when taking into account all (income-dependent) components of households’ disposable income. The average effective marginal tax rate is lowest at the bottom of the income distribution. It then gradually increases from around 12% to 22% for higher incomes, before it jumps to almost 50% at the level of the gross minimum wage (almost € 21,000 annually). This is also the level of income which shows the largest variance in the marginal tax rate (as measured by the 5th and 95th percentiles). It demonstrates the effect of the various targeted and income-dependent measures, many of which start to phase out after incomes surpass the minimum wage. For higher incomes, the marginal tax rate remains relatively stable and never goes far above 60%.

Net effective marginal income tax rates in the Netherlands in 2022.. Note: Figure 1 shows the average net effective marginal income tax rates (solid line) and the corresponding 5th and 95th percentiles (dotted lines), all expressed as percentages, for gross individual incomes between € 0 and € 150,000.Sources: CPB calculations based on the MIMOSI microsimulation model.
3. Methodology and data
3.1. Measuring poverty
Poverty is usually defined as pronounced deprivation in well-being. The questions of how well-being should be interpreted and what minimum level constitutes a reasonable threshold are the subjects of long-standing academic debates (e.g. Rawls, 1999; Sen, 1999; and Ravallion, 2016). In this paper, we employ the generalised reference budget approach developed by the SCP and used since 2007 to measure poverty in the Netherlands (Vrooman et al., 2020). According to this approach, an individual agent is poor if he or she consistently lacks the means to obtain the minimum necessities of his community. In practice, this definition is operationalised by comparing someone’s annual disposable income to a budget-based poverty threshold. Two reference budgets are compiled. The first variant, the basic needs budget, includes the expenses that can be viewed as minimum necessities in the Netherlands. These include items that are difficult to avoid such as food, clothing, housing and various others. The second variant, the modest-but-adequate budget, is somewhat less conservative and also contains the minimum expenditures on recreation and social participation. Both budgets are for the most part derived from expert data of the National Institute for Family Finance Information (Nibud) and have been validated through the use of consensual focus groups (Hoff et al., 2010). Table 2 lists the items and amounts for a single-person household in 2017. According to the basic needs criterion, the poverty threshold amounted to €1,039 per month. According to the modest-but-adequate criterion, it stood at €1,135 per month. Thresholds for other household types are derived by applying the equivalence scale of Statistics Netherlands (Siermann et al., 2004). Since the modest-but-adequate criterion was deemed most appropriate in the focus groups, this is the one we use in our analysis.
The basic needs and modest-but-adequate budgets for a single person in 2017 (monthly amounts in euro)
| Minimum necessities | Additional expenses for social participation and recreation | ||
|---|---|---|---|
| Rent* | 443 | Additional contributions and subscriptions | 18.5 |
| Gas | 60 | Receive visitors | 19.5 |
| Electricity | 20 | To visit family and friends | 5.5 |
| Water | 9 | Holiday/going out | 39 |
| Telephone, television and internet | 54 | Additional transportation | 13.5 |
| Insurance† | 45 | ||
| Contributions and subscriptions | 2 | ||
| Transportation | 14 | ||
| Clothing and shoes | 56 | ||
| Inventory | 74 | ||
| Maintenance home and garden | 24 | ||
| Food | 201 | ||
| Laundry and cleaning supplies | 6 | ||
| Personal care | 21 | ||
| Miscellaneous | 10 | ||
| Total minimum necessities | 1039 | Total social participation and recreation | 96 |
-
Source: Vrooman et al. (2020).
-
*
This amount is obtained by estimating the average rent of a reference home.
-
†
Mandatory health insurance is excluded because its costs are deducted from income.
It is possible to annually compile new budgets but this is a time consuming process and could cause abrupt year-on-year changes in the poverty threshold if experts change their views. The SCP therefore uses an indexation mechanism instead, based on earlier work by Citro and Michael (1995). It annually updates the threshold in line with the 5-year moving average of basic spending on food, clothes and housing.9 In practice, this means that the threshold typically rises faster than the consumer price index but slower than an entirely relative poverty threshold, and is therefore often characterised as ‘quasi-relative’.10 The indexation method allows the content of reference budgets to be reassessed not on an annual basis but – as in the present case of the SCP’s reference budget approach – for example every five to ten years.
To determine whether someone is poor, the SCP compares their annual income to its (annualised) poverty threshold. Following Citro and Michael (1995), it takes into account all disposable money and near-money income that is available for the consumption of goods and services in the reference budget.11 This has two advantages over using gross income. First, non-discretionary expenditures on items other than the ones in the reference budget are deducted. Examples include income tax payments, out-of-pocket health spending and the costs that people have to incur in order to generate income, such as child care expenditures. Second, near-money, in-kind benefits that can be used to buy items in the reference budget are added to income. These can be for instance food stamps, rent allowance or financial support in paying energy bills.12,13
Once it is determined who is poor and who is not poor, one needs to aggregate the individual information in a macro number that indicates the level of poverty in society. In this paper we report the simulated effects of tax-benefit policies on two poverty outcomes: the percentage of people living below the poverty line (incidence) and the total shortfall – or aggregate deficit – of all poor people (intensity).
The SCP approach is not the only method for measuring poverty in the Netherlands. Statistics Netherlands (CBS) biennially reports estimates based on its low income threshold (CBS, 2021). This represents a constant level of purchasing power equal to the amount of minimum income benefit in 1979, when it was historically most generous (CBS, 2021). The European Union instead uses the at-risk-of-poverty (AROP) threshold, which is fully relative and amounts to 60 percent of median disposable income (Besharov and Couch, 2012). A disadvantage of these alternative methods is that they are not based on an actual assessment of what is minimally necessary in the Netherlands. In addition, the fixed (constant price) character of the low income threshold also raises doubts, as the Netherlands has become considerably more prosperous over the past decades and the norms for a minimum existence have presumably increased as well. The EU’s AROP threshold does reflect changes in prosperity but determines poverty solely by comparing someone’s income to the median and is often seen more as an inequality measure (Darvas, 2019; Van Praag and Ferrer-i-Carbonell, 2004). The generalised reference budget approach does not have these disadvantages and is therefore our preferred method for measuring poverty.14 As a robustness check, in the appendix we also present the main outcomes for the AROP threshold.
3.2. The microsimulation models MIMOSI and MICSIM
The CPB developed and maintains the microsimulation models MIMOSI and MICSIM, which are used to simulate the effects of tax and benefit policies on household disposable income and structural employment, respectively. The models are harmonised in the sense that they use (roughly) the same input microdata and the same accounting model of the Dutch tax-benefit system.
MIMOSI simulates the effects of changes in real gross income and tax-benefit policies on net household disposable income for a representative sample of 100,000 Dutch households obtained from Statistics Netherlands.15 For the simulations in this paper we relied on micro data from 2016.16 To simulate subsequent years we adjusted the weight of each household to maintain the representativeness of the sample regarding demographic and macro-economic developments (see Koot et al., 2016).
MIMOSI essentially performs an accounting exercise for the households in the sample by going through all the steps shown in Table 1 above. Therefore, the model does not simulate any behavioural responses to policy changes. The model can simulate the effects for past, current and future years. For years in the future MIMOSI implements announced planned policy changes and uses forecasts of relevant macroeconomic variables to simulate the effects of policy parameters that are indexed annually by e.g. inflation and wage growth.17
The simulation results are used to estimate changes in poverty, income inequality, the effective marginal tax rate and the government budget. MIMOSI is also used to regularly forecast year-on-year changes in real disposable income of Dutch households.
MICSIM is a behavioural microsimulation model that estimates the structural (long-run) labour supply effects of tax and benefit policies in the Netherlands. For any given policy change, it simulates the changes in labour market participation, both in terms of the number of workers and in terms of the hours worked.
The core of MICSIM is a discrete choice model for labour supply. Preferences and elasticities are estimated through the so-called labour market panel (‘Arbeidsmarktpanel’). This is a data set that combines the Dutch Labour Force Survey (‘Enquete Beroepsbevolking’) with administrative data collected by Statistics Netherlands. The size of the data set allows for relatively precisely estimated preferences over income, leisure and formal child care, and the corresponding labour supply elasticities. In addition, the simulated behavioural responses were compared with the findings in a number of quasi-experimental studies. Jongen et al. (2014) and De Boer et al. (2020) provide a more detailed description of the model.
3.3. Outcome measures
We use two indicators to measure poverty (our main outcome). The first corresponds to the incidence of poverty and captures the percentage of people living below the poverty line. The second indicator instead reflects the intensity of poverty and equals the total income shortfall – or aggregate deficit – of all poor people. The reported effects of the various policies are expressed as percentage changes in both indicators. Furthermore, we distinguish between the effects on poverty in the general population and the effects on poverty in the subgroups of the population targeted by the policies (for example, poverty among children in the case of raising the child budget).
In addition to poverty, we use three other outcomes – income inequality, employment and the government budget – to document the costs of reducing poverty. The first, income inequality, is measured by the Gini coefficient. The effects are expressed as percentage changes in the Gini (see also Koot et al., 2016). An increase in the Gini coefficient indicates a rise in income inequality. Income inequality in the Netherlands has been hovering between 0.29 and 0.31 over the past ten years and remains low compared to most other countries. In 2019, the Netherlands ranked 16th among the 37 OECD member countries with available data (CBS Statline, 2022a; Organisation for Economic Co-operation and Development (OECD), 2022a).
To measure employment, we use the total number of hours worked. This indicator implicitly combines the number of employed people with the number of hours worked per person and hence reflects both the extensive and intensive margins of labour supply. Again, the reported effects are expressed as percentage changes. An increase (decrease) of 0.1% corresponds to approximately 7,500 more (fewer) labour years. Employment in the Netherlands has been steadily increasing since 2014 and reached a total of 7.8 million labour years in 2019 for a total population of 17.3 million (CBS Statline, 2022b). Unemployment fell from 8.3% in 2014 to 4.4% in 2019 (CBS Statline, 2022c).18 Finally, the state of the government budget is measured by the EMU balance, which corresponds to the overall difference between government revenues and spending. The reported ex-ante budgetary effects capture the change in the EMU balance, expressed in billions of euros at 2021 prices. These effects do not take into account the fiscal consequences of any changes in employment. However, such consequences may be considerable for policies that cost a lot of jobs. When we discuss such policies, we also report the ex-ante budgetary effects that result when we add the expected budgetary consequences of changes in people’s labour market decisions. The Dutch government budget compares favourably to most other EU member states (Eurostat, 2022b). In 2019, the EMU balance stood at +1.8% of GDP, while the level of EMU debt amounted to 48.5% of GDP (CBS Statline, 2022d).
3.4. Simulation assumptions and baseline scenario
The results presented below are shown as deviations from the structural or long-run baseline scenario. This scenario reflects the state of poverty, employment, income inequality and the government budget when all planned policies (listed in Table 3) have been fully implemented and no new policies are introduced.
Planned policies of previous and current governments
| 1: The lower threshold of the higher bracket of the Box 1 income tax will be raised from 2025 onwards. 2: The minimum income benefit is gradually reduced because the double tax credit that is applied to the reference minimum wage – this is the net amount a couple would end up with in the hypothetical case that one of them would receive a gross benefit equal to the statutory gross minimum wage, while the other would have no income - on which the minimum income benefit is based is gradually phased out. 3: The transferability of the general tax credit, the in-work tax credit, and the in-work tax credit for single parents and second earners in couples with children will be abolished. 4: The imputed income from homeownership will be reduced by 0.05%. 5: The deduction for zero (or very low) home acquisition debt (‘wet Hillen’) will be abolished. 6: The reduction percentage of the health care allowance will be further increased. 7: The lower threshold of the second bracket of the Box 1 income tax for pensioners will be indexed to a limited extent (75%) for people born after 1945. 8: The pension agreement of 2020 will lead to a 0.3% reduction in pensions by 2060 (after 2060 it will further lower pensions but this period is excluded from our analysis). 9: The tax credit for the self-employed will not be indexed. 10: The maximum rate for tax deductions will be further reduced to the lower tariff in the two-bracket system of income tax over the period until 2023. 11: The mortgage redemption requirement to be eligible for mortgage interest deduction will be gradually increased over the period until 2042. |
We simulate the baseline scenario in two steps. In the first step, we use data for 2016 and simulate the evolution of poverty and other outcomes in the period until 2021, taking into account demographic and economic projections, as well as planned policies during this period. In the second step, we simulate that all planned policies after 2021 are at once implemented in 2021. Hence, we make no explicit assumptions about the long-run demographic and macroeconomic trends and this structural forecast is based purely on planned policies.
Together, these two steps yield the baseline scenario that we use as the counterfactual in our analysis. In this baseline scenario, the incidence of poverty is projected to have fallen from 5.4% in 2017 to 5.0% in 2021.19 Structural or long-run poverty as a result of planned policies of previous and current governments is forecasted to be 6.4%. This indicates that the incidence of poverty is expected to rise by 28% in the decades after 2021, everything else equal. The intensity of poverty is instead predicted to increase by 13%. The main cause for this long-run increase in poverty is a planned reduction of the minimum income benefit, which is slowly being phased in.20
The baseline scenario estimates income inequality, as measured by the Gini coefficient, to have been 0.26 in 2016.21 Structural inequality is forecasted to be 0.6% point higher.
The structural effects on employment are computed in MICSIM and levels are usually not published, as certain groups – such as the elderly – are excluded from the simulations to keep the model tractable. The CPB does however publish forecasts of structural employment, based on both planned policies and demographic projections. According to these forecasts, the number of employed people will increase from 9.7 million people in 2018 to 10.5 million in the long run, while the average number of hours worked will remain constant at 30.7 hours per person (Ebregt et al., 2019).
While MIMOSI estimates changes in the structural EMU balance, expressed in euros, it does not produce forecasts of the structural level of the government deficit. According to CPB estimates, based on both planned policies and demographic projections, the Dutch government debt as a percentage of GDP is expected to increase from 48% in 2020 to 100% in 2060 (Adema and Van Tilburg, 2019).
4. Results
4.1. Selected individual policy options
Table 4 reports the results of simulating various individual policy options. At this stage of the analysis we limit ourselves to existing tax-benefit policies and focus primarily on the ones that target low income households. The policies are ordered according to the age group they are most relevant for: the children, the working age population, the elderly or the general population.
Simulated effects of various individual policy options§
| Policy options | Ex-ante budgetary effect € bn | Poverty in persons % | Poverty in euros % | Poverty in persons (within group) % | Poverty in euros (within group) % | Employment % | Income inequality % |
|---|---|---|---|---|---|---|---|
| I. Policies aimed at children | |||||||
| 1: Raise child budget from third child onwards 2: Raise child budget for single parents 3: Raise child budget, combination of 1 and 2 4: Make in−work tax credit for second earners/single parents refundable | −0.2 −0.1 −0.3 −0.1 | −2.5 −0.9 −3.5 −0.1 | −1.1 −0.4 −1.5 −0.1 | −7.2 −2.3 −9.9 −0.3 | −3.4 −1.3 −4.6 −0.2 | 0.0 0.0 0.0 0.0 | −0.1 −0.1 −0.1 0.0 |
| II. Policies aimed at the working age population | |||||||
| 5: Make in−work tax credit refundable 6: Raise in−work tax credit for low incomes 7: In−work tax credit, combination of 5 and 6 8: Raise minimum income benefit to state pension level 9: Reverse reduction in minimum income benefit after 2021 10: Raise minimum income benefit to 70% of reference minimum wage per hh member | −0.3 −1.2 −2.5 −1.4 (−2.9*) −0.9 (−1.9*) −1.8 (−3.7*) | −0.8 −3.1 −6.3 −20.0 −16.7 −10.7 | −0.8 −1.7 −4.7 −8.8 −7.3 −4.3 | −1.1† −8.8† −14.0† −57.0† −48.0† −27.3† | −1.1† −4.5† −9.3† −57.1† −48.3† −21.3† | 0.0 −0.1‡ −0.2‡ −0.9‡ −0.6‡ −1.2‡ | −0.1 −0.4 −0.7 −0.9 −0.6 −0.5 |
| III. Policies aimed at the elderly | |||||||
| 11: Make tax credit for retirees refundable 12: Raise healthcare allowance for the elderly only by € 0.3 bn 13: Raise the tax deductibility of healthcare costs for the elderly only by € 0.3 bn | −0.8 −0.3 −0.3 | −1.7 −0.4 −0.2 | −2.2 −0.5 −0.1 | −10.0 −2.8 −1.6 | −14.6 −4.0 −1.1 | . . . | −0.4 −0.2 −0.1 |
| IV. General policies | |||||||
| 14: Make general tax credit refundable 15: Make general tax credit refundable and raise it by € 0.5 bn 16: Raise the tax deductibility of healthcare costs by € 0.3 bn | −4.8 −5.5 −0.3 | −16.0 −17.5 −0.9 | −19.1 −20.1 −0.5 | . . . | . . . | −0.8‡ −0.8‡ . | −1.1 −1.3 −0.1 |
-
Note: The reported effects document the changes relative to the structural baseline scenario (counterfactual), which assumes that all policies currently being gradually phased in are fully implemented but no additional policy changes occur.
-
*
The amounts between brackets show the total ex-ante effect when taking into account behavioural responses.
-
†
For the policies 5 to 10, the relevant group corresponds to a subcategory of the working age population, in particular workers (policies 5 to 7) or recipients of minimum income benefit (policies 8 to 10).
-
‡
Negative employment effects have an (unquantified) upward effect on poverty.
-
§
Table A1 in the appendix presents the results for the AROP threshold.
We start with policies that focus on reducing poverty among children. Earlier research revealed that children in single parent families are most likely to be poor and that the risk of poverty increases with the number of children in the family (Hoff et al., 2019). The first three policy options listed in Table 4 are specifically targeted at single parents and large families. In particular, the first option raises the (means tested) child budget amounts for the third and any subsequent children up to the point where they match the amount paid for the second child. The results show that this option costs € 0.2 bn and reduces the incidence and intensity of poverty in the general population by 2.5% and 1.1%, respectively. When we focus only on children, the estimated reductions in poverty are 7.2% and 3.4%. Employment and income inequality show small estimated declines, although the employment effect disappears due to rounding. The small impact on employment is representative for child policies more generally, which contribute to the costs of children but do not fundamentally alter the relative payoff of paid work vis-à-vis other activities. Overall, despite its complexity and its small adverse effect on labour market incentives, raising the child budget for large families is a relatively cost efficient way of reducing child poverty.
The second policy option instead raises the child budget for single parents. It does so up to the point where the disposable income of single parents who receive minimum income benefit equals 90 percent of the disposable income of couples on benefit (an increase from its current level of 87.7 percent).22 This option targets a smaller group than the first policy option. It is therefore cheaper in terms of budget but also lifts fewer people out of poverty, while showing similar effects on employment and inequality. The third policy option reported in Table 4 combines the first two and generates effects that are roughly equal to the sum of the individual effects, which illustrates the complementarity of both options.
The fourth policy option does not use the child budget but instead makes the in-work tax credit for second earners/single parents refundable. This tax credit supports parents that combine working with caring for young children. The policy option starts from the notion that some second earners/single parents with low earnings from work pay less income tax than the in-work tax credit they are entitled to. Making the tax credit refundable means that these households receive the difference as an allowance. The results in Table 4 reveal modest effects across the board, illustrating the limited responsiveness of the target groups to the increased work incentives generated by the in-work tax credit.
We next turn to policies that are aimed at reducing poverty among the working age population. We first look at options to combat in-work poverty. Policy option 5 in Table 4 makes the in-work tax credit refundable, analogous to the Earned Income Tax Credit (EITC) in the US. This primarily helps families with low earnings from work because they are the ones who currently pay insufficient income tax to fully benefit from the tax credit. It also means that the marginal tax rate on income from work at the lower end of the income distribution becomes lower, which increases the incentives for benefit recipients to find a job. Implementing this option costs € 0.3 bn. Overall poverty declines by 0.8%, while in-work poverty falls by 1.1% (both in terms of the incidence and in terms of the intensity of poverty). Employment remains almost the same while income inequality decreases by 0.1%.
Policy option 6 raises the in-work tax credit for low incomes. As it currently stands, the amount of tax credit that workers receive follows an inverted U-shaped process. Initially it increases at a very moderate pace with annual earnings. Only when earnings start exceeding a threshold of around € 10,000, the amount starts rising quickly. Eventually, when earnings surpass the threshold of around € 35,000, the amount starts slowly decreasing until it reaches zero. Policy option 6 proposes to let the fast build-up of the amount of in-work tax credit start from zero earnings rather than from the threshold of € 10,000. This costs € 1.2 bn and reduces the incidence and intensity of poverty by 3.1% and 1.7%, respectively. For in-work poverty these effects amount to 8.8% and 4.5%. Because the maximum amount of tax credit is now reached at a lower level of earnings, it becomes more attractive to work fewer hours. As a result, the policy option comes at the expense of a small reduction in employment. Income inequality is expected to fall by 0.4%. Policy option 7 represents a combination of options 5 and 6 but generates effects that are larger than the sum of the individual effects, which illustrates that the options mutually reinforce each other considerably.
The in-work tax credit helps the working poor but does not support the working age population with no income from work. For those people (as well as for workers with insufficient earnings), the minimum income scheme provides a safety net of last resort. Policy options 8 to 10 in Table 4 represent alternative ways of increasing the minimum income benefit. Option 8 raises it to the level of the state pension, which is fairly generous and – even in the absence of other income – lifts many recipients above the poverty line (Goderis, 2020). Our baseline simulation, which does not account for behavioural responses, indicates that this policy option costs € 1.4 bn. However, raising minimum income benefit by this much makes other activities considerably more attractive relative to paid work. This is likely to have non-negligible effects on people’s labour market decisions. Table 4 therefore also reports the simulated budgetary impact (€ 2.9 bn) that results when we add the expected fiscal consequences of such changes in behaviour. The estimated effects of this policy option are considerable. The share of people living below the poverty line falls by 20.0%, while their total income shortfall declines by 8.8%. For benefit recipients specifically, it would even eradicate more than half of existing poverty, both in terms of people and money. As pointed out, the policy option is likely to affect labour market participation and hence employment is expected to drop by 0.9%. Income inequality also falls by 0.9%.
Policy option 9 does not raise the minimum income benefit but instead prevents it from further declining. As explained in section 3.4, this decline started in 2012 and is planned to continue until 2035. Policy option 9 proposes to maintain the benefit reductions that have been implemented up to 2021 but to prevent any further cuts from 2022 onwards. Since the baseline scenario assumes that all planned policies, including the gradual decline of the minimum income benefit, have been fully implemented, this policy option represents an increase in minimum income support, relative to counterfactual. The budgetary effect is smaller than for option 8 and amounts to € 0.9 bn (€ 1.9 bn when we account for changes in behaviour). The effects on poverty are also somewhat smaller. In particular, the incidence is reduced by 16.7%, while the intensity falls by 7.3%. Among recipients of minimum income support, almost half of poverty is eliminated, both in terms of people and money. Employment and income inequality both fall by 0.6%.
Policy option 10 raises the minimum income benefit to 70% of the reference minimum wage (discussed in section 2.1) for each household member above the age of 21. Hence, the amount of the benefit now simply increases proportionally with the number of adults: 70% of the reference minimum wage for a single-person household, 140% for a couple, and so on. Implementing this option costs € 1.8 bn (€ 3.7 bn when we incorporate the effects of changes in behaviour). Poverty in persons falls by 10.7%, while poverty in euros declines by 4.3%. When we consider benefit recipients only, the effects on poverty are larger (27.3% and 21.3%, respectively). The policy option reduces employment by 1.2% and income inequality by 0.5%.
In addition to children and people of working age, we also assessed three policy options aimed specifically at the elderly. Poverty among people of retirement age is very low in the Netherlands, due to the relatively generous state pension. However, not everybody is fully entitled to this pension, as it depends on the years resided in the Netherlands. In addition, some of the elderly face considerable health-related expenditures which can also push them below the poverty line. Policy option 11 makes the tax credit for retirees refundable. The tax credit for retirees is a fixed income tax discount of around € 1,600 for retirees with incomes up to € 37,000. Above that threshold, the discount starts decreasing until it reaches zero at an income of around € 48,000. For retirees with low taxable incomes, the amount of income tax can be insufficient to be able to fully use the available tax credit. Policy option 11 makes the tax credit for retirees refundable so that it is always fully used. This raises the income of retirees at the bottom of the income distribution. The option costs € 0.8 bn and lowers poverty in the general population by 1.7% (incidence) and 2.2% (intensity). These effects are larger among the elderly: 10.0% and 14.6%, respectively. Income inequality is reduced by 0.4%. Any effects on employment are likely to be negligible because of the low labour market participation of the elderly population. Policy option 12 instead raises the healthcare allowance for the elderly by € 0.3 bn. This allowance is an income and assets tested contribution towards the cost of health insurance. For incomes up to € 21,000, the 2020 monthly amounts were € 104 and € 199 for households with and without a benefit partner, respectively. For higher incomes, the amounts are gradually reduced until they become zero at an income of around € 30,000 or € 39,000, respectively. Policy option 12 raises these amounts proportionally until a total budgetary impact of € 0.3 bn is reached. However, the healthcare allowance for the lowest incomes amounts to the cheapest health insurance policy. Since people’s benefit cannot exceed the cost of their insurance, any effect of this policy option is therefore likely to be limited. The results in Table 4 confirm this.
Policy option 13 provides an alternative way of easing the financial burden of healthcare. It raises the tax deductibility of healthcare costs specifically for the elderly with low incomes. The current tax rules stipulate that particular types of out-of-pocket health expenditures are deductible in as far as they exceed an income dependent threshold. In addition, for elderly people with incomes below € 35,000, a multiplying factor of 113% applies. This means that they can deduct more than they actually spent. Policy option 13 raises this multiplying factor up to the point where the expected budgetary impact reaches € 0.3 bn. This further supports elderly people with low incomes and considerable out-of-pocket health spending. Table 4 shows modest effects on poverty, which is to be expected given the already low poverty among people of retirement age.
Having discussed the policy options for different age groups, we now turn to the final three options listed in Table 4, which are aimed at reducing poverty among the general population. Policy option 14 makes the general tax credit refundable. In 2020, this tax credit amounted to € 2,711 for incomes below € 20,712. For higher incomes, it was linearly reduced at a rate of around 5.7% until it reached zero for incomes above € 68,508. Most households are in principle eligible for this tax credit. However, people with low incomes may not be able to fully use it because their income tax is too low. The policy option makes the general tax credit refundable so that everyone can fully use it. The option costs € 4.8 bn and reduces poverty by 16.0% (people) and 19.1% (euros), respectively. It also lowers employment by 0.8% and reduces income inequality by 1.1%. The adverse effect on employment reflects the fact that the general tax credit is not specifically targeted at people with paid work but also supports the non-working part of the population.
Policy option 15 also makes the general tax credit refundable but at the same time raises it by € 0.5 bn. The latter is done in such a way that the upper and lower income thresholds of the phase out trajectory remain the same and the linear rate at which the tax credit declines for higher levels of income is raised (hence the phase out path becomes steeper). This means that the effective marginal tax rate in income increases, which weakens the incentives of people to work. Policy option 15 costs € 5.4 bn and reduces the incidence and intensity of poverty by 17.5% and 20.1%, respectively. It lowers employment by 0.8% and reduces income inequality by 1.3%. The last option in Table 4, policy option 16, raises the tax deductibility of healthcare costs. This is identical to option 13 except that it applies not only to the elderly but to the whole population. As before, it costs € 0.3 bn. The reduction in poverty is considerably larger however: 0.9% (incidence) and 0.5% (intensity), respectively.
The sixteen policy options in Table 4 vary widely in terms of their budgetary costs. There is therefore no a priori reason why their effects on poverty should be of a similar magnitude. But even when accounting for differences in costs, the effects on poverty are hardly comparable. While raising the child budget or the minimum income benefit offers the most bang for the buck, policy options aimed at the working poor, the elderly or the general population are less efficient in combating poverty. To some extent this is to be expected given the relatively high incidence of poverty among children and minimum income benefit recipients. But even the most cost efficient policies provide far from a free lunch. Lowering poverty by 20 percent through raising minimum income benefit to the level of the state pension, for example, costs almost 3 billion euros. This is around half the total budget of the minimum income scheme in the Netherlands. In addition to the budgetary costs, raising minimum income support – through lowering labour market incentives – also costs jobs. The general picture that emerges from these results is that reducing poverty is possible but comes at the expense of public money and/or jobs. It illustrates the ‘social trilemma’ faced by policymakers in modern welfare states (Cantillon and Vandenbroucke, 2014; Cantillon et al., 2019). Due to slow wage growth at the bottom of the earnings distribution, it becomes increasingly difficult to simultaneously provide adequate minimum income support, maintain sufficient financial incentives for people to find a job, ánd keep the government budget in check.
4.2. Individual policy options with a fixed budgetary cost
To compare the cost efficiency of anti-poverty policies, Table 5 lists the effects of various options with a fixed budgetary cost of € 1.0 bn. If policymakers would have a billion euros to spent, which policies are expected to yield the biggest reductions in poverty? As before, we order the policies according to age groups. Starting with children, policy option 1 lifts the (means tested) child budget amounts from the third child onwards to the amount that parents receive for their second child. In addition, all amounts are proportionally raised further. Policy option 2 instead proportionally increases the child allowance, which is a universal government contribution to the costs of children. Moving on to the working age population, policy option 3 raises the in-work tax credit for all eligible workers, while policy option 4 increases the benefit amounts for all recipients of minimum income benefit. Policy options 5 and 6 instead lift the incomes of the elderly population. The first does so by making their tax credit refundable and proportionally raising the amounts for all those that are eligible. The second instead raises the healthcare allowance specifically for the elderly. Finally, the last three policies in Table 5 are of a more general nature. Option 7 raises the rent allowance, which is an income and assets tested government contribution to the costs of renting a home.23 Options 8 and 9 instead increase the healthcare allowance and general tax credit, respectively.
Simulated effects of selected individual policy options with an imposed budgetary impact of € 1.0 bn§
| Policy options | Ex-ante budgetary effect € bn | Poverty in persons % | Poverty in euros % | Poverty in persons (within group) % | Poverty in euros (within group) % | Employment % | Income inequality % |
|---|---|---|---|---|---|---|---|
| I. Policies aimed at children | |||||||
| 1: Raise child budget from third child onwards and further increase it for each child 2: Raise child allowance | −1.0 −1.0 | −7.3 −4.2 | −3.3 −2.1 | −19.8 −10.9 | −10.2 −6.4 | −0.2‡ −0.1‡ | −0.4 −0.2 |
| II. Policies aimed at the working age population | |||||||
| 3: Raise in−work tax credit 4: Raise minimum income benefit | −1.0 −1.0 (−2.0*) | −0.6 −17.9 | −0.2 −7.9 | −1.9† −55.7† | −0.7† −55.9† | 0.1 −0.7‡ | 0.0 −0.7 |
| III. Policies aimed at the elderly | |||||||
| 5: Make tax credit for retirees refundable and raise it 6: Raise healthcare allowance for the elderly only | −1.0 −1.0 | −1.8 −1.9 | −2.4 −2.0 | −10.9 −15.3 | −16.0 −14.5 | . . | −0.5 −0.9 |
| IV. General policies | |||||||
| 7: Raise rent allowance 8: Raise healthcare allowance 9: Raise general tax credit | −1.0 −1.0 −1.0 | −11.2 −5.6 −2.0 | −7.8 −4.7 −1.3 | . . . | . . . | −0.1‡ −0.1‡ 0.0 | −1.1 −0.7 −0.3 |
-
Note: The reported effects document the changes relative to the structural baseline scenario (counterfactual), which assumes that all policies currently being gradually phased in are fully implemented but no additional policy changes occur.
-
*
The amount between brackets shows the total ex-ante effect when taking into account behavioural responses.
-
†
For the policies 3 and 4, the relevant group corresponds to a subcategory of the working age population, in particular workers (policy 3) or recipients of minimum income benefit (policy 4).
-
‡
Negative employment effects have an (unquantified) upward effect on poverty.
-
§
Table A2 in the appendix presents the result for the AROP threshold.
The policy options in Table 5 yield widely different effects. Raising the minimum income benefit is exclusively aimed at the lowest incomes and therefore has the largest impact. It lifts almost one fifth of the poor population out of poverty and lowers their joint income shortfall by around 8%. Among minimum income benefit recipients, it eliminates poverty by more than half, both in persons and in euros. These reductions in poverty not only have an adverse effect on the government budget of initially € 1.0 bn but also make paid work less attractive. This lowers employment by 0.7%. It also means fewer people in a paid job and more people on minimum income support, leading to an estimated doubling of the budgetary effect. Hence, raising minimum income support is effective in combating poverty but costs fairly much in terms of money and jobs. A somewhat smaller impact on poverty is achieved when instead investing the taxpayer’s money in raising the rent allowance. This also targets the lowest incomes – although not as much as minimum income support – and therefore has a considerable impact as well. It leads to around 11% fewer poor people and an 8% reduction in the intensity of poverty. An advantage of this option is that it costs fewer jobs than raising minimum income support. The other options in Table 5 yield smaller reductions in poverty, which is at least partly because they are less targeted (Koot and Gielen, 2021). Raising the child budget from the third child onwards and further increasing it for each child lowers the incidence and intensity of poverty by 7.3% and 3.3%, respectively. Among children alone, it eliminates around one fifth of the poverty in persons and around one tenth of the poverty in euros. It also has a small downward effect on total employment. The child budget is in principle less targeted at low incomes than the next most effective policy, which is the healthcare allowance. Still, it offers a poverty reduction that is of at least similar magnitude. A likely explanation is that its focus on children, particularly those in large families, compensates for its lower degree of targeting because poverty is especially prevalent among this group. This also explains why raising the child allowance – which is not means tested at all and is therefore relatively inefficient – still generates non-negligible effects on poverty. The remaining four policy options have (mostly) smaller effects, which is to be expected. The general tax credit and the in-work tax credit have relatively long phase out trajectories and are therefore rather crude instruments for reducing poverty. The two options aimed at the elderly are also not very effective, most likely because poverty among this age group is rare to begin with.
4.3. Larger reforms of the income support system
Next we study four more radical reforms that are often mentioned as possible solutions to the complexity of the Dutch tax and benefit system: two basic income scenarios, a scenario in which the various Dutch tax credits are transformed into their negative income tax equivalents, and a scenario in which various allowances are replaced by a single allowance, meant to cover a number of different costs. In all scenarios, we achieve budget neutrality through proportionally increasing the Box 1 income tax rates (see section 2.2) to compensate for the increase in government spending.
The first two scenarios, which are described in Table 6 below, assume the introduction of a universal basic income (UBI). We define a UBI as a net cash transfer which is provided universally (instead of targeted towards a particular group) and unconditionally (instead of requiring the recipient to reciprocate, e.g. by participating in job market training or community service). A UBI has long been touted as a solution to poverty (see e.g. Gentilini et al. 2020 for a literature review). Naturally, the effects depend on the amount that is transferred and on how the UBI is financed. In both of the scenarios we simulate, the UBI is combined with a simplification of the tax and benefit system but the degree of simplification and the amount of transferred UBI are different (see Table 6).
Basic income scenarios
| Baseline | Scenario 1 | Scenario 2 | |
|---|---|---|---|
| UBI | Euros per month | ||
| Per adult | 0 | 560 | 635 |
| Per household | 0 | 500 | 600 |
| Total single adult household | 0 | 1060 | 1235 |
| Total per adult in a couple | 0 | 810 | 935 |
| UBI | Euros per year | ||
| Total single adult household | 0 | 12,722 | 14,822 |
| Total per adult in a couple | 0 | 9,722 | 11,222 |
| Benefits | |||
| Minimum income scheme (‘bijstand’) | maintained | abolished | abolished |
| Disability benefits for young people (‘Wajong’) | maintained | abolished | abolished |
| Public pension (‘AOW’) and benefits for widows/widowers (‘Anw’) | maintained | netted with UBI | abolished |
| Unemployment and disability benefits (‘WW’, ‘ZW’ and ‘WIA’) | maintained | netted with UBI | netted with UBI |
| Taxes, tax deductions and tax credits | |||
| Tariff first bracket Box 1 | 37.1% | 52.7% | 56.5% |
| Tariff second bracket Box 1 | 49.5% | 70.4% | 75.4% |
| Income tax credits | maintained | abolished | abolished |
| Tax on imputed income from homeownership (‘eigenwoningforfait’) | maintained | abolished | abolished |
| Mortgage interest rate tax deduction (‘hypotheekrenteaftrek’) | maintained | abolished | abolished |
| Allowances | |||
| Rent allowance (‘huurtoeslag’) | maintained | maintained | maintained |
| Child allowance (‘kinderbijslag’) | maintained | maintained | increased to 300 euros per child per month |
| Child budget (‘kindgebonden budget’) | maintained | maintained | abolished |
| Child care allowance (‘kinderopvangtoeslag’) | maintained | maintained | abolished |
| Healthcare allowance (‘zorgtoeslag’) | maintained | maintained | abolished |
| Study subsidies (‘studiefinanciering’) | maintained | abolished | abolished |
-
Note: Due to rounding, the annual UBI amounts do not exactly correspond to 12 times the monthly amount.
In scenario 1, the UBI is set equal to the maximum amount of minimum income benefit a single adult is entitled to in 2025, which is the final year of the current government’s tenure. The UBI is therefore higher than the amount of minimum income benefit in our baseline scenario. Note that both of our UBI scenarios assign an income to individuals as well as households. In scenario 1 each individual receives 560 euros per month, and each household 500 euros per month. This implies that the total UBI of a couple is not twice but approximately 1.5 times the amount of UBI of a single person household. The rationale behind this choice is related to the current design of the Dutch tax and benefit system, which is characterised by a mixture of individual and household-level measures. We analyse how a basic income can simplify the current system by replacing these measures with individual and household UBI components.
The introduction of the UBI in scenario 1 is combined with a simplification of the tax and benefit system. First of all, the minimum income scheme and the disability benefit for young people are abolished. Other disability and unemployment benefits, as well as public pensions are netted with the UBI, meaning that an adult receives at least the amount of UBI. Second, Box 1 of the tax system is simplified: all income tax credits, the tax on imputed income from homeownership and the mortgage interest rate tax deduction are abolished.24 Finally, we abolish the study subsidies available to Dutch students. Taken together, these simplifications are not sufficient to cover the costs of introducing the UBI. To achieve budget neutrality, the tariffs in the first and second tax brackets are increased from 37.1% to 52.7% and from 49.5% to 70.4%, respectively.
Basic income scenario 2 builds upon scenario 1 but further simplifies the social security system by abolishing the healthcare allowance, the child budget and the childcare allowance. To compensate for this loss of income, the UBI and the (universal) child allowance are increased (see Table 6). The tariffs in the first and second tax brackets are further increased to 56.5% and 75.4%, respectively, to maintain budget neutrality.
In addition to the two basic income scenarios, we also look at what would happen if the Dutch government would instead introduce a negative income tax – the third reform that we consider –, which is often mentioned as an alternative to a UBI. This idea was popularised by Milton Friedman in the 1960s and amounts to a system which reverses the direction in which tax is paid for incomes below a certain threshold (Friedman, 1962). Note that a generic, universal negative income tax can be designed in such a way that the outcome does not differ from our UBI scenarios.
The scenario we simulate here is more targeted. The Dutch tax system features a number of income-dependent tax credits and some households pay less taxes than the total amount of tax credits they are entitled to. We previously simulated the effects of making some of these tax credits refundable. In the negative income tax scenario we allow for all tax credits to become refundable. To achieve budget neutrality, the tariffs in the first and second brackets are increased from 37.1% to 38.5% and from 49.5% to 51.3%, respectively.
Finally, we complete our analysis of Dutch tax-benefit reforms by studying a fourth scenario, which assumes that the various existing allowances are replaced by a single one. Simplifying the allowance system in this way may lower poverty by reducing non-take-up. However, it can also come at the expense of targeting specific groups, which may actually result in higher poverty. Following Koot and Gielen (2021) , we replace the rent allowance, healthcare allowance and child budget by one unified allowance. We determine the amount of this allowance by implementing a two-step procedure. In the first step, we estimate the parameters that should be used to determine the amount of allowance if it were to minimise the impact on household income. In the second step, we adjust these parameters in such a way that budget neutrality is guaranteed. This results in the following equation for the amount of the unified allowance (Koot and Gielen, 2021):
where ‘rent’ refers to rent between 3000 and 8400 euros per year, ‘single parent’ is a dummy variable which equals 1 for single-parent households and 0 otherwise, and ‘health care costs’ refer to the sum of the health care insurance premiums and deductibles.
The effects of the four simulated reforms are summarised in Table 7 below.
Simulated effects of larger reforms†
| Poverty in persons | Poverty in euros | Employment | Income inequality | |
|---|---|---|---|---|
| % | % | % | % | |
| Universal Basic Income | ||||
| Scenario 1 | −45.3 | −62.4 | −6.4* | −10.0 |
| Scenario 2 | −60.5 | −62.3 | −8.3* | −11.7 |
| Negative income tax | −14.8 | −19.3 | −0.9* | −2.1 |
| Unified allowance | 11.0 | 13.1 | 0.6 | −0.7 |
-
Note: The reported effects document the changes relative to the structural baseline scenario (counterfactual), which assumes that all policies currently being gradually phased in are fully implemented but no additional policy changes occur.
-
*
Negative employment effects have an (unquantified) upward effect on poverty.
-
†
Table A3 in the appendix presents the result for the AROP threshold.
Basic income scenario 1 results in a dramatic decrease in overall poverty. The number of poor people in the Netherlands is reduced by 45.3%, while poverty measured in euros decreases by 62.4%. The working poor benefit the most: more than half of this group is lifted out of poverty. As the UBI is set equal to the minimum level of social assistance, households on benefit are not necessarily better off. The poverty rates among pensioners and those on disability benefits even increase. This is because their net public pensions and benefits are netted with the UBI, while the higher tax rates and abolishment of the mortgage interest rate deduction and tax credits lower any other net income they receive, such as pillar 2 pension benefits.
Table 8 shows boxplots of the percentage change in household disposable income for different income groups and household types. It illustrates the large redistributive effects of this scenario. While the lowest and next-lowest quintiles of the income distribution record positive median income effects of 7% and 3.1%, respectively, the next-highest and highest quintiles see their median incomes fall by 4.4% and 8.1%, respectively. The table also points at large differences more generally. The incomes of some groups increase dramatically, particularly where it concerns single-earner couples, while others suffer severe losses.
Boxplots of the percentage change in household disposable income for different household groups in UBI scenario 1
| Distribution of effect on disposable income | |||||
|---|---|---|---|---|---|
| 5% | 25% | 50% (median effect) | 75% | 95% | |
| % change | |||||
| All households | −18.4 | −8.3 | −1.5 | 7.2 | 31.4 |
| Income percentiles | |||||
| 1-20% | −19.2 | −12.5 | 7 | 18.5 | 51.7 |
| 21-40% | −8.9 | −3.4 | 3.1 | 9 | 33.6 |
| 40-60% | −12.2 | −4.1 | 0 | 4.3 | 25 |
| 61-80% | −15.5 | −8.5 | −4.4 | 1.7 | 19.9 |
| 81-100% | −22.4 | −12.9 | −8.1 | −1 | 12.5 |
| Income source | |||||
| Employment | −16.4 | −7.6 | −0.4 | 8.8 | 31.4 |
| Benefits | −29.9 | −5.9 | 6.4 | 10.5 | 36 |
| Pension | −19.1 | −10.9 | −4.7 | 0.7 | 25.3 |
| Household type | |||||
| Dual earners | −18.1 | −9.5 | −5 | 1.5 | 22.4 |
| Single earners | −18.8 | −6.1 | 1.6 | 8.5 | 31.8 |
| Single-earner couples | −5.2 | 11 | 20.2 | 32.6 | 61.1 |
| With/without children | |||||
| With children | −19.2 | −11.3 | −4.9 | 6.7 | 30 |
| Without children | −15.8 | −5.6 | 1.5 | 10 | 33.5 |
Reducing poverty has a price, as scenario 1 lowers structural employment by 6.4%. This is the result of two distinct effects. The first is a negative income effect, which originates from the extra income support that the UBI provides and the disincentive to work that comes with it. The second is a negative substitution effect, which occurs because the higher tax rates needed to finance the UBI also make work less attractive. The income and substitution effects imply that workers work fewer hours (the intensive margin) and people who are not employed are less likely to find paid employment (the extensive margin). In our analysis, these adverse effects on employment manifest themselves mostly among second earners in couples with children. The employment of singles and single parents is least affected.
Basic income scenario 2 assumes a larger UBI and higher marginal tax rates than scenario 1. Consequently, this scenario results in an even larger poverty reduction, but also in an even lower structural employment, as the income and substitution effects are amplified (see Table 7). The abolition of the child care allowance and child budget has an additional disincentivising effect on single parents and second earners in couples with children. This scenario also has large redistributive consequences. Income inequality falls by 11.7%. Moreover, the median effect on household disposable income is most favourable for the lowest quintile of the income distribution and gradually decreases for higher quintiles (see Table 9). Nevertheless, not all low income households are doing better under this scenario. For many of the ones with children, for example, the increases in the UBI and (universal) child allowance do not fully cover the loss of the child care allowance and child budget. By contrast, the incomes of richer households, who receive less or no child budget and less child care allowance, may actually increase because of the higher (universal) child allowance. These opposite effects are illustrated by the results in Table 9, which document a wide variety in the predicted income change for families with children.
Boxplots of the percentage change in household disposable income for different household groups in UBI scenario 2
| Distribution of effect on disposable income | |||||
|---|---|---|---|---|---|
| 5% | 25% | 50% (median effect) | 75% | 95% | |
| % change | |||||
| All households | −19.6 | −9.3 | −1.9 | 9.7 | 33.4 |
| Income percentiles | |||||
| 1−20% | −14.8 | −10.6 | 8.6 | 19.6 | 54.3 |
| 21−40% | −14.2 | −6.9 | 1.9 | 10.7 | 35 |
| 40−60% | −14.5 | −5.8 | 0.4 | 6 | 29.4 |
| 61−80% | −18.6 | −8.5 | −3.8 | 4.4 | 23.9 |
| 81−100% | −27.5 | −14.5 | −8.5 | 0 | 14.8 |
| Income source | |||||
| Employment | −20.5 | −7.2 | 1 | 11 | 34.6 |
| Benefits | −30.2 | −4.7 | 10.7 | 15 | 41.6 |
| Pension | −16.1 | −11.6 | −8.1 | −3.3 | 21.2 |
| Household type | |||||
| Dual earners | −22 | −10.2 | −5 | 3.7 | 25.4 |
| Single earners | −16.5 | −8.6 | 0.5 | 11 | 33.7 |
| Single−earner couples | −5.9 | 13.6 | 23.8 | 33.4 | 64.3 |
| With/without children | |||||
| With children | −27.6 | −11.3 | −2.1 | 10.1 | 35.4 |
| Without children | −17.1 | −5.8 | 3 | 12.4 | 35.9 |
This scenario starkly illustrates the trade-off between universal and simple welfare policies on the one hand, and more complex, targeted measures on the other: while the latter (at least on paper) represent a cost efficient way to support the needs of different types of households, they also result in a vast social security system with myriad household-specific policies.
We next discuss the results for the third reform that we consider: the negative income tax. This scenario is a much less fundamental system overhaul compared to the UBI scenarios but is still effective in reducing poverty: the number of poor people is reduced by 14.8% and poverty in euros falls by 19.3%. Income inequality decreases by 2.1% (see Table 7). Because of the increase in tax rates, the median effect on household disposable income is -1.5% (Table 10). When looking at different types of households specifically, they all document negative median income effects, except for single-earner couples. As before, the latter clearly benefit the most from these reforms. The decline in structural employment is only 0.9%. This scenario hence shows that it is possible to substantially reduce poverty without a large system overhaul and large universal transfers. Naturally, poverty could be reduced even more by increasing the maximum tax credits, but this would also lead to a larger decline in employment.
Boxplots of the percentage change in household disposable income for different household groups in the negative income tax scenario
| Distribution of effect on disposable income | |||||
|---|---|---|---|---|---|
| 5% | 25% | 50% (median effect) | 75% | 95% | |
| % change | |||||
| All households | −2.1 | −1.7 | −1.5 | 0.4 | 7.5 |
| Income percentiles | |||||
| 1−20% | −1.6 | −1.5 | −1.2 | 0.7 | 12.8 |
| 21−40% | −1.8 | −1.6 | −1.4 | 1.5 | 8.9 |
| 40−60% | −2 | −1.7 | −1.5 | 0.5 | 6.9 |
| 61−80% | −2.1 | −1.8 | −1.6 | −0.1 | 5 |
| 81−100% | −2.6 | −2 | −1.8 | −0.5 | 2.9 |
| Income source | |||||
| Employment | −2.2 | −1.8 | −1.5 | −0.4 | 7.1 |
| Benefits | −2.1 | −1.6 | −1.5 | −1 | 11 |
| Pension | −1.9 | −1.5 | −1.2 | 1.1 | 7.3 |
| Household type | |||||
| Dual earners | −2.2 | −1.8 | −1.4 | 1.1 | 6.5 |
| Single earners | −2.1 | −1.8 | −1.5 | −1.2 | 3.7 |
| Single-earner couples | 1 | 3.8 | 6.4 | 9.6 | 17.1 |
| With/without children | |||||
| With children | −2.2 | −1.6 | −0.9 | 2.9 | 9.8 |
| Without children | −2.2 | −1.8 | −1.6 | −1.3 | 5.8 |
The fourth and last reform in our simulation analysis is the unified allowance. The results show that it would increase employment by 0.6% and lower the Gini-coefficient by 0.7% (see Table 7). At the same time, it would also lead to substantially more poverty. This seemingly contradictory result can be explained as follows. Due to the chosen parameters for the amount of the unified allowance, households with incomes around the minimum wage gain from the reform, while households with a slightly lower income lose out. The latter tend to be households on benefits, as Table 11 shows. While the introduction of the unified allowance would have only a small negative median effect on income, it would have more substantial effects on the lower incomes. This would incentivise these households to increase employment, which would then result in an increase in structural employment. Naturally, the increase in poverty could be prevented by raising the allowance but this would come at the expense of lower employment. This scenario clearly points at a long-run trade-off between poverty reduction and employment. It also shows that policymakers face the difficult choice between simplifying policies on the one hand and making sure they target the right households on the other. Nevertheless, as Table 11 shows, the unified allowance for most households does a reasonable job in limiting the effects on income. This demonstrates that simplifying the allowance system and thereby reducing non-take-up is a real possibility for policymakers.
Boxplots of the percentage change in household disposable income for different household groups in the unified allowance scenario
| Distribution of effect on disposable income | |||||
|---|---|---|---|---|---|
| 5% | 25% | 50% (median effect) | 75% | 95% | |
| % change | |||||
| All households | −5.5 | −0.4 | −0.1 | −0.1 | 9.2 |
| Income percentiles | |||||
| 1−20% | −14.3 | −4.1 | −0.3 | 4 | 13.4 |
| 21−40% | −3.6 | −1 | −0.1 | 6.9 | 10.9 |
| 40−60% | −4 | −0.1 | −0.1 | −0.1 | 4.8 |
| 61−80% | −2.4 | −0.2 | −0.1 | −0.1 | −0.1 |
| 81−100% | −0.5 | −0.2 | −0.1 | −0.1 | −0.1 |
| Income source | |||||
| Employment | −3.9 | −0.2 | −0.1 | −0.1 | 8.3 |
| Benefits | −15.9 | −5.2 | −0.3 | 1.4 | 9.9 |
| Pension | −5.1 | −0.4 | −0.1 | 2.8 | 10.1 |
| Household type | |||||
| Dual earners | −3.3 | −0.2 | −0.1 | −0.1 | 3.3 |
| Single earners | −8.3 | −0.5 | −0.1 | 4.3 | 11.3 |
| Single−earner couples | −5.8 | −1.5 | −0.1 | −0.1 | 5.9 |
| With/without children | |||||
| With children | −6.8 | −2.2 | −0.2 | −0.1 | 1.6 |
| Without children | −4.3 | −0.2 | −0.1 | −0.1 | 9.7 |
5. Discussion and conclusions
Poverty remains a tenacious problem in the Netherlands and the current government has expressed a firm intention to reduce it. Which tax and benefit policy options does it have and what are the costs and benefits of these options? In this paper we have tried to answer these questions by simulating the effects of a range of individual policy measures and four budget-neutral reforms of the income support system. Our results indicate that reducing poverty is possible but involves considerable costs in terms of public money and/or jobs. This political trade-off runs like a red thread through our results and is most starkly illustrated by the simulated effects of introducing a universal basic income at the level of the (relatively generous) state pension. This is expected to structurally reduce the number of poor people by 60% but, under the budget neutrality constraint, would require the lower and higher income tax rates to be raised to the (almost unprecedented) levels of 56.5% and 75.4%, respectively. Unsurprisingly, these changes would have a big impact on employment, with an estimated 8.3% of jobs disappearing. Even policymakers that are firmly committed to reducing poverty would probably be hesitant to pay such a high price. Other policy options are cheaper but also generate smaller reductions in poverty.
Despite the general trade-off that policymakers face, our analysis also points at important differences in the cost efficiency of policies. Spending a billion euros on a more generous minimum income scheme exclusively helps the lowest incomes and therefore achieves a larger poverty reduction than a similar investment in other existing tax and benefit policies. At the same time, it costs a lot of jobs and extra money to accommodate the new inflow of benefit recipients. An alternative and cheaper option – with a somewhat smaller impact on poverty – is raising the rent allowance. Increasing the child budget is also relatively cost efficient, presumably because of the high incidence of poverty among Dutch children. Policy options aimed at the working poor, the elderly or the general population are less efficient in reducing poverty.
Both the policy trade-off and the relative efficiency of means-tested benefits that we identify in our analysis were also demonstrated in earlier simulation studies. Examples include Atkinson et al. (2017) and Martinelli (2019) for the UK and Boone et al. (2018) for the Netherlands. As also emphasised by these authors, one should keep in mind that our results do not reflect the administrative burden of implementing the various policy options. While some of the targeted measures may be more cost efficient in theory, they can add considerably to the complexity and bureaucracy of the social security system. A possible consequence is that claiming benefits remains feasible only for people with a considerable ability to think and act.
Footnotes
1.
To put these numbers into perspective, poverty in the Netherlands remains low compared to many other EU member states. In 2018, for example, the at-risk-of-poverty (AROP) rate was 13.3%, while the EU-average stood at 16.8%. Only 5 out of the 27 current members recorded lower rates than the Netherlands (Eurostat, 2022a).
2.
Our analysis originates from an ex ante policy evaluation carried out by the CPB Netherlands Bureau for Economic Policy Analysis (henceforth CPB) and the Netherlands Institute for Social Research (henceforth SCP) in the run-up to the 2021 election. See Olsthoorn et al. (2020) for an overview of results for policymakers. While in this paper we focus entirely on the analysis of tax-benefit policies and reforms, CPB and SCP also qualitatively assessed labour market reforms and investments in health care and education that can reduce poverty in the long run by increasing people’s human capital and employability.
3.
See Figari et al. (2015) for an overview of microsimulation approaches for assessing the effects of tax and benefit policies on the distribution of income.
4.
Disposable income at the social minimum is in most cases well below the poverty threshold used in this paper (Goderis, 2020).
5.
The statutory gross minimum wage is itself indexed annually by the average growth of contract wages in the private and public sectors.
6.
For the subsequent (selected) household types, the net amounts per month during the second half of 2021 were as follows. Singles and single parents, aged 18, 19 or 20: € 266. Couples, both aged 18, 19 or 20, without children: € 533. Couples, aged 18, 19 or 20, with children: € 841. Singles and single parents from 21 years to retirement age: € 1,079. Couples from 21 years to retirement age, with or without children: € 1,541. Singles from 21 years to retirement age with one cost-sharing co-resident: € 771. Couples from 21 years to retirement age with one cost-sharing co-resident: € 1,336. Singles and single parents residing in an institution: € 376. Couples residing in an institution: € 607.
7.
The retirement age increases to 67 years in 2024.
8.
The net amounts per month during the second half of 2021 were € 1,227 for singles and € 1,677 for couples.
9.
Using a 5-year moving average limits the sensitivity of the poverty threshold to short-run fluctuations. It is also consistent with the observation that perceptions of what is minimally necessary in society typically react with some delay to socioeconomic developments (Vrooman, 2009).
10.
Spending on food, clothes and housing typically grows with a country’s prosperity, but at a less than proportional pace because spending on other items grows faster.
11.
Subject to data availability.
12.
The disposable income concept includes all primary income (labour and capital market income) plus social security benefits, minus taxes and social security contributions, minus other non-discretionary expenditures on non-reference budget items, plus near-money, in-kind benefits that can be used to buy items in the budget.
13.
To ensure consistency between the reference budgets and the income concept, we do not add the rent allowance that households actually receive to their income but instead add the (hypothetical) amount they would receive if they were to rent a property with a rent equal to the amount in the reference budget (Goderis et al., 2018).
14.
For more information on this approach, we refer the reader to Vrooman et al. (2020).
15.
MIMOSI uses data on household income components and other characteristics necessary to simulate net disposable income. Statistics Netherlands collects register-based microdata on all Dutch households but MIMOSI only requires a (representative) sample of 100,000 households to run reliable simulations for the Netherlands.
16.
The most recent year that was available at the time of performing the simulations.
17.
MIMOSI includes all tax-benefit policies with the exception of supplementary local provisions provided by municipalities, such as special social assistance (‘bijzondere bijstand’), city passes (‘stadspassen’) and municipal tax waivers (‘kwijtschelding lokale lasten’). When assessing the simulation results, it is important to keep in mind that MIMOSI assumes full take-up of benefits and allowances. In reality, non-take-up remains a concern in the Netherlands. 35% of all entitled households, for example, does not claim minimum income benefit (Netherlands Labour Authority, 2021).
18.
13 out of 38 OECD member countries recorded lower unemployment rates (Organisation for Economic Co-operation and Development (OECD), 2022b).
19.
Note that Mimosi slightly underestimates the poverty rate in 2017. Hoff et al. (2019) use register-based microdata on all Dutch households and document a poverty rate of 5.7%.
20.
The projected rise in poverty could be mitigated by (as yet unplanned) compensating policies but any such measures, as well as other unforeseen future changes in the determinants of poverty, are excluded from our analysis.
21.
MIMOSI also seems to slightly underestimate income inequality, as Statistics Netherlands reports a Gini coefficient of 0.29 (CBS Statline, 2022a).
22.
This means that the income position of these single parents is effectively restored to the level that prevailed before the minimum income scheme reform of 2015.
23.
To be precise, policy option 7 constitutes an increase in the amount of rent allowance people would receive if they were to rent the reference home (see footnote 13).
24.
We do not abolish other tax deductions as they do not necessarily complicate the system.
25.
We obtained the median equivalised net income from the Eurostat EU-SILC and ECHP surveys database, see https://ec.europa.eu/eurostat/databrowser/view/ILC_DI03/default/table.
Appendix
In this appendix we replicate the poverty effects shown in Tables 4, 5 and 7 for the AROP threshold, which for a single person household is set equal to 60% of the median disposable personal income.25 This equalled 17,065 euros in 2021, and was hence more than 2,000 euros higher than the threshold based on the modest-but-adequate criterion of the Netherlands Institute for Social Research (SCP) used in the main text (14,991 euros). Using this definition, the poverty rate is 9.7% in the baseline scenario. Because a larger number of people is poor in this definition, the measures presented in the main text are less effective in reducing poverty.
The differences are most stark for measures pertaining to minimum income benefits (in particular, policy options 8 and 9 in Table 4 and its equivalent Table A1 and policy option 4 in Table 5 and its equivalent Table A2). The basic income measures, which replace the minimum income benefit, are also less effective when the AROP threshold is used, see Table A3.
Simulated effects of various individual policy options, poverty threshold equals 60% of median net disposable income
| Policy options | Poverty in persons % | Poverty in euros % | Poverty in persons (within group) % | Poverty in euros (within group) % |
|---|---|---|---|---|
| I. Policies aimed at children | ||||
| 1: Raise child budget from third child onwards | −1.3 | −1.0 | −3.7 | −3.2 |
| 2: Raise child budget for single parents | −0.5 | −0.5 | −1.2 | −1.7 |
| 3: Raise child budget, combination of 1 and 2 | −1.9 | −1.6 | −5.1 | −4.9 |
| 4: Make in−work tax credit for second earners/single parents refundable | −0.1 | −0.1 | −0.4 | −0.2 |
| II. Policies aimed at the working age population | ||||
| 5: Make in−work tax credit refundable | −0.6 | −0.7 | −0.8* | −0.9* |
| 6: Raise in−work tax credit for low incomes | −3.0 | −2.4 | −7.7* | −7.0* |
| 7: In−work tax credit, combination of 5 and 6 | −5.4 | −5.1 | −11.8* | −11.4* |
| 8: Raise minimum income benefit to state pension level | −4.6 | −11.0 | −9.9* | −44.2* |
| 9: Reverse reduction in minimum income benefit after 2021 | −2.3 | −7.7 | −5.2* | −30.6* |
| 10: Raise minimum income benefit to 70% of reference minimum wage per hh member | −7.9 | −5.2 | −24.0* | −18.8* |
| III. Policies aimed at the elderly | ||||
| 11: Make tax credit for retirees refundable | −2.0 | −2.1 | −12.4 | −12.8 |
| 12: Raise healthcare allowance for the elderly only by € 0.3 bn | −1.0 | −0.6 | −6.6 | −4.5 |
| 13: Raise the tax deductibility of healthcare costs for the elderly only by € 0.3 bn | −0.4 | −0.2 | −2.8 | −1.6 |
| IV. General policies | ||||
| 14: Make general tax credit refundable | −13.7 | −16.3 | . | . |
| 15: Make general tax credit refundable and raise it by € 0.5 bn | −14.5 | −17.3 | . | . |
| 16: Raise the tax deductibility of healthcare costs by € 0.3 bn | −0.5 | −0.5 | . | . |
-
Note: The reported effects document the changes relative to the structural baseline scenario (counterfactual), which assumes that all policies currently being gradually phased in are fully implemented but no additional policy changes occur.
-
*
For the policies 5 to 10, the relevant group corresponds to a subcategory of the working age population, in particular workers (policies 5 to 7) or recipients of minimum income benefit (policies 8 to 10).
Simulated effects of selected individual policy options with an imposed budgetary impact of € 1.0 bn, poverty threshold equals 60% of median net disposable income
| Policy options | Poverty in persons % | Poverty in euros % | Poverty in persons (within group) % | Poverty in euros (within group) % |
|---|---|---|---|---|
| I. Policies aimed at children | ||||
| 1: Raise child budget from third child onwards and further increase it for each child | −4.1 | −3.5 | −9.8 | −11.1 |
| 2: Raise child allowance | −1.3 | −1.1 | −2.9 | −3.5 |
| II. Policies aimed at the working age population | ||||
| 3: Raise in−work tax credit | −0.4 | −0.3 | −1.3* | −1.0* |
| 4: Raise minimum income benefit | −6.9 | −4.4 | −13.8* | −10.1* |
| III. Policies aimed at the elderly | ||||
| 5: Make tax credit for retirees refundable and raise it | −2.4 | −2.3 | −14.4 | −14.2 |
| 6: Raise healthcare allowance for the elderly only | −2.8 | −2.3 | −18.3 | −16.0 |
| IV. General policies | ||||
| 7: Raise rent allowance | −5.3 | −7.9 | . | . |
| 8: Raise healthcare allowance | −3.5 | −4.4 | . | . |
| 9: Raise general tax credit | −1.4 | −1.4 | . | . |
-
Note: The reported effects document the changes relative to the structural baseline scenario (counterfactual), which assumes that all policies currently being gradually phased in are fully implemented but no additional policy changes occur.
-
*
For the policies 3 and 4, the relevant group corresponds to a subcategory of the working age population, in particular workers (policy 3) or recipients of minimum income benefit (policy 4).
Simulated effects of larger reforms, poverty threshold equals 60% of median net disposable income
| Poverty in persons | Poverty in euros | |
|---|---|---|
| % | % | |
| Universal Basic Income | ||
| Scenario 1 | −28.3 | −48.4 |
| Scenario 2 | −26.1 | −52.9 |
| Negative income tax | −14.1 | −16.1 |
| Unified allowance | 5.1 | 10.4 |
-
Note: The reported effects document the changes relative to the structural baseline scenario (counterfactual), which assumes that all policies currently being gradually phased in are fully implemented but no additional policy changes occur.
References
- 1
-
2
Presentation 8th World Congress International Microsimulation AssociationThe fiscal and (re-)distributive consequences of introducing a hypothetical basic income in the Netherlands: a 2019 microsimulation exercise, Presentation 8th World Congress International Microsimulation Association, Antwerp, Centre for Social Policy, University of Antwerp.
-
3
Reducing poverty and inequality through tax-benefit reform and the minimum wage: the UK as a case-studyThe Journal of Economic Inequality 15:303–323.https://doi.org/10.1007/s10888-017-9365-7
-
4
Counting the PoorNew York: Oxford University Press.https://doi.org/10.1093/acprof:oso/9780199860586.001.0001
-
5
Feit en fictie omtrent het basisinkomen in Nederland: een wetenschappelijke verkenning mogelijk gemaakt door Instituut GakUtrecht/Antwerpen: Instituut GAK/University of Antwerp.
-
6
Mechanics of replacing benefit systems with a basic income: comparative results from a microsimulation approachThe Journal of Economic Inequality 15:325–344.https://doi.org/10.1007/s10888-017-9366-6
-
7
Decent Incomes for All: Improving Policies in EuropeOxford: Oxford University Press.
-
8
A glass ceiling on poverty reduction? An empirical investigation into the structural constraints on minimum income protectionsJournal of European Social Policy 30:129–143.
-
9
Reconciling Work and Poverty Reduction: How Successful Are European Welfare States?Oxford: Oxford University Press.
- 10
-
11
Ongelijkheid in inkomen en vermogenThe Hague/Heerlen/Bonaire: Statistics Netherlands, huishoudens’. https://opendata.cbs.nl/statline/#/CBS/nl/dataset/84476NED/table?ts=1662576843098, Accessed, 7 September 2022.
-
12
Arbeidsvolume; bedrijfstak, geslacht, nationale rekeningenThe Hague/Heerlen/Bonaire: Statistics Netherlands, https://opendata.cbs.nl/statline/#/CBS/nl/dataset/84164NED/table?ts=1662629125150, Accessed, 8 September 2022.
-
13
Arbeidsdeelname en werkloosheid per maandThe Hague/Heerlen/Bonaire: Statistics Netherlands, https://opendata.cbs.nl/statline/#/CBS/nl/dataset/80590ned/table?ts=1662629533726, Accessed, 8 September 2022.
-
14
Saldo en schuld; overheidssectorenThe Hague/Heerlen/Bonaire: Statistics Netherlands, https://opendata.cbs.nl/statline/#/CBS/nl/dataset/84118NED/table?ts=1662632351769, Accessed, 8 September 2022.
- 15
-
16
Macro-Economische Verkenning 2023The Hague: CPB Netherlands Bureau for Economic Policy Analysis.
-
17
Why is it So Hard to Reach the EU’s Poverty Target?Social Indicators Research 141:1081–1105.https://doi.org/10.1007/s11205-018-1872-9
-
18
MICSIM 2.0. A behavioural microsimulation model for the analysis of tax-benefit reforms in the Netherlands: an updated version. CPB background documentThe Hague: CPB Netherlands Bureau for Economic Policy Analysis.
-
19
Arbeidsparticipatie en gewerkte uren tot en met 2060’. CPB background documentThe Hague: CPB Netherlands Bureau for Economic Policy Analysis.
-
20
At-risk-of-poverty rate by poverty thresholds, age and sex - EU-SILC and ECHP surveys [ilc_li02] databasehttp://appsso.eurostat.ec.europa.eu/nui/show.do?dataset=ilc_li02, Accessed, 6 September 2022.
-
21
Government deficit/surplus, debt and associated datahttps://ec.europa.eu/eurostat/databrowser/view/GOV_10DD_EDPT1__custom_3331801/default/table?lang=en, Accessed, 8 September 2022.
-
22
Microsimulation and policy analysis, Vol, 2, Amsterdam, ElsevierMicrosimulation and policy analysis, Vol, 2, Amsterdam, Elsevier.
-
23
Capitalism and FreedomChicago: University of Chicago Press.https://doi.org/10.7208/chicago/9780226264189.001.0001
-
24
Streng Maar Onrechtvaardig: De Bijstand GewogenDe Nederlandse bijstand is niet toereikend, Streng Maar Onrechtvaardig: De Bijstand Gewogen, Amsterdam, Van Gennep.
-
25
De SCP-Methode Voor Het Meten van Armoede: Herijking En RevisieThe Hague: The Netherlands Institute for Social Research (SCP.
-
26
Improving the understanding of poverty and social exclusion in EuropeLuxembourg: Publications Office of the European Union.
-
27
Moving towards fairer regional minimum income schemes in SpainJournal of European Social Policy 32:452–466.https://doi.org/10.1177/09589287221088174
-
28
The Minimum Agreed upon. Consensual Budget Standards for the NetherlandsThe Hague: The Netherlands Institute for Social Research (SCP).
-
29
Armoede in Kaart 2019The Hague: The Netherlands Institute for Social Research (SCP).
-
30
The Distributional Effects of Government Spending and TaxationHousehold incomes and redistribution in the European Union: quantifying the equalizing properties of taxes and benefits, The Distributional Effects of Government Spending and Taxation, London, Palgrave Macmillan.
-
31
MICSIM: a behavioural microsimulation model for the analysis of tax-benefit reform in the Netherlands. CPB background documentThe Hague: CPB Netherlands Bureau for Economic Policy Analysis.
-
32
Tax by Design for the NetherlandsTowards Simpler Income-Dependent Tax Credits and Tax Rebates, Tax by Design for the Netherlands, Oxford.
-
33
MIMOSI: microsimulatiemodel voor belastingen, sociale zekerheid, loonkosten en koopkracht’. CPB Background DocumentThe Hague: CPB Netherlands Bureau for Economic Policy Analysis.
-
34
A basic income trilemma: affordability, adequacy and the advantages of radically simplified welfareJournal of Social Policy 49:461–482.
-
35
Handbook of Income DistributionThe welfare state and antipoverty policy in rich countries, Handbook of Income Distribution, Vol, 2, Elsevier.
-
36
Niet-gebruik van de algemene bijstand: Een onderzoek naar de omvang, kenmerken, langdurigheid en aanpakThe Hague: Netherlands Labour Authority.
-
37
Kansrijk ArmoedebeleidThe Hague: CPB Netherlands Bureau for Economic Policy Analysis and Netherlands Institute for Social Research (SCP).
- 38
- 39
- 40
- 41
-
42
Happiness quantified; a satisfaction calculus approachOxford: Oxford University Press.
-
43
Rules of Relief: Institutions of Social Security, and Their ImpactThe Hague: The Netherlands Institute for Social Research (SCP).
-
44
Minimum Income Standards and Reference Budgets169–183, Measuring Poverty in the Netherlands: The Generalized Reference Budget Approach, Minimum Income Standards and Reference Budgets, Bristol, Policy Press, p, 10.2307/j.ctv125jsbv.
Article and author information
Author details
Funding
No specific funding for this article is reported.
Acknowledgements
The authors would like to thank two anonymous referees, the editor (Matteo Richiardi), Josien Arts, Monique de Haard, Stella Hoff, Bart van Hulst, Patrick Koot, Martin Olsthoorn, Michiel Ras, Lex Thijssen, Eugene Verkade, Jean Marie Wildeboer Schut and participants at the 8th World Congress of the International Microsimulation Association for helpful comments and suggestions.
Publication history
- Version of Record published: April 30, 2023 (version 1)
Copyright
© 2023, Goderis and Vlekke
This article is distributed under the terms of the Creative Commons Attribution License, which permits unrestricted use and redistribution provided that the original author and source are credited.