Tax and Benefit Policies to Reduce Poverty in the Netherlands: A Microsimulation Analysis
- The Netherlands Institute for Social Research (SCP), The Netherlands
- CPB Netherlands Bureau for Economic Policy Analysis, The Netherlands
Figures

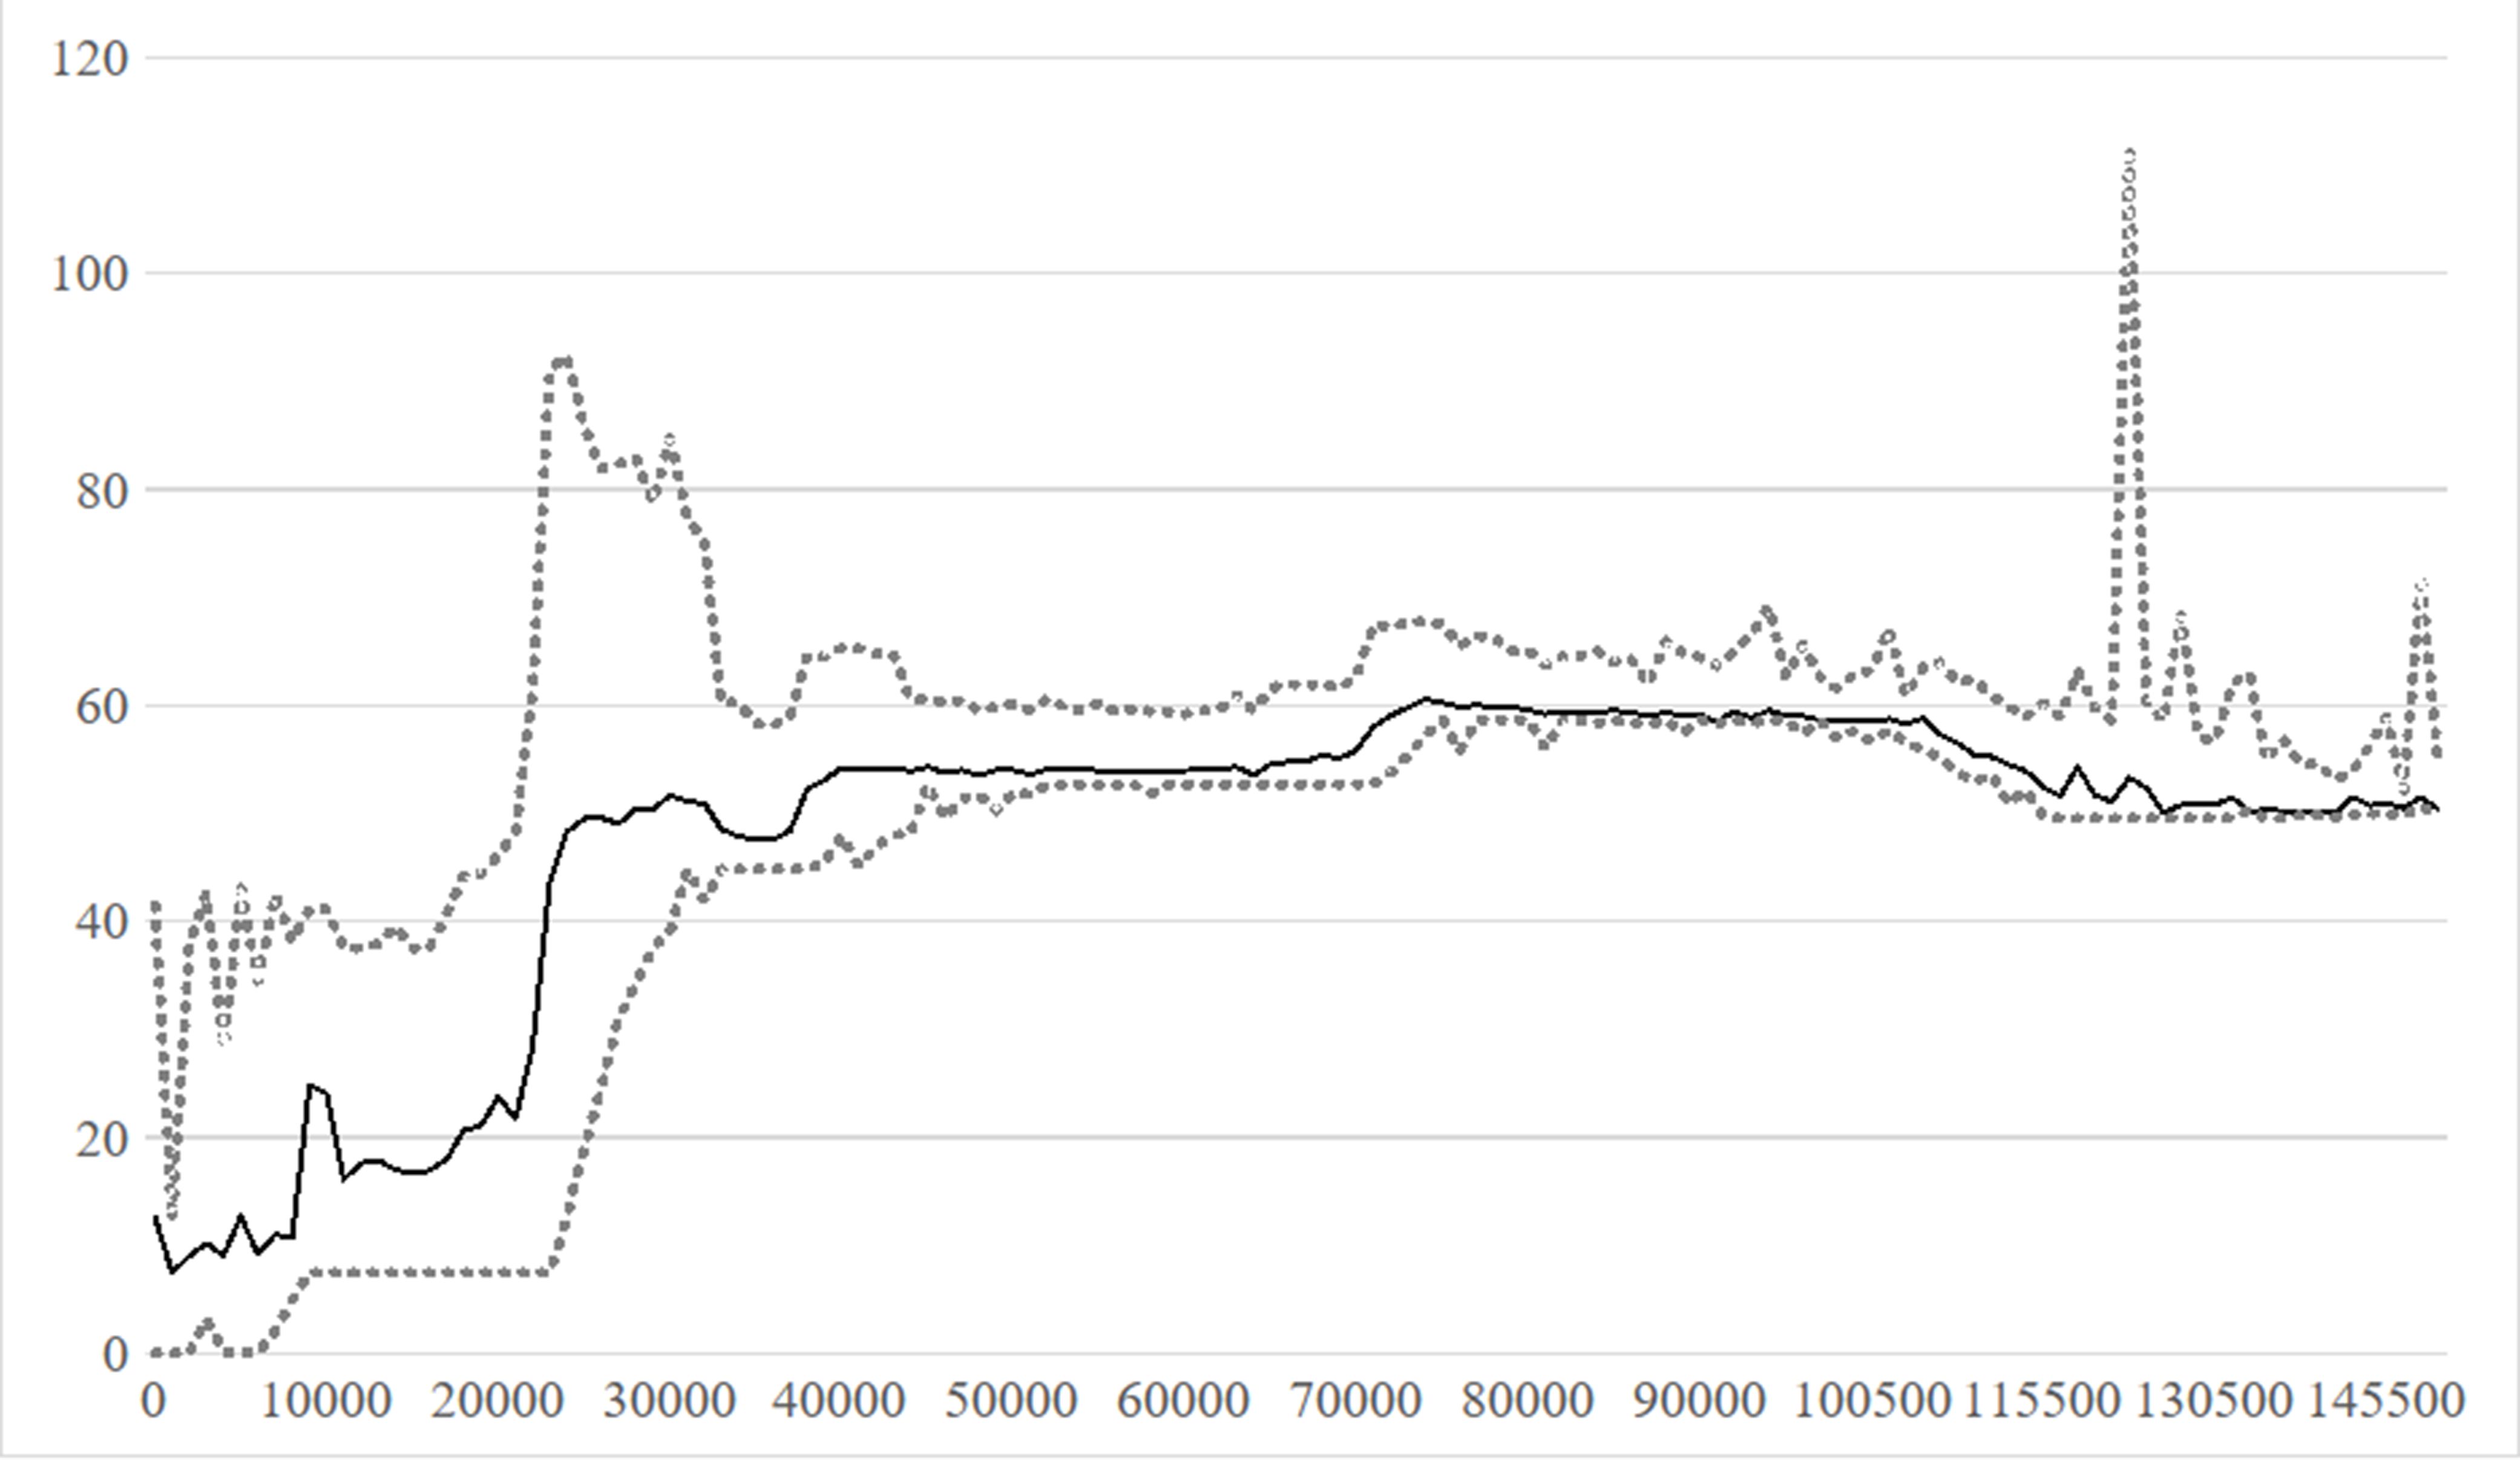
Net effective marginal income tax rates in the Netherlands in 2022.. Note: Figure 1 shows the average net effective marginal income tax rates (solid line) and the corresponding 5th and 95th percentiles (dotted lines), all expressed as percentages, for gross individual incomes between € 0 and € 150,000.Sources: CPB calculations based on the MIMOSI microsimulation model.
Tables
Stylized overview of the Dutch system of taxes and benefits
| Gross wages | + |
| Gross profits | + |
| Gross benefits | + |
| Gross pensions | + |
| (Assumed) gross income derived from wealth* | + |
| (Assumed) income derived from home ownership† | + |
| Gross income | |
| Taxes | - |
| Income tax credits | + |
| Fiscal effect of tax deductions | + |
| Net income | |
| Allowances | + |
| Various individual allowances and compensation schemes | + |
| Disposable income |
-
*
Income derived from financial wealth is not taxed directly. Instead, the tax authority makes assumptions about the amount of income derived from the total amount of net household wealth.
-
†
Home ownership is taxed indirectly by assuming that one derives income from owning a home (‘eigenwoningforfait’).
The basic needs and modest-but-adequate budgets for a single person in 2017 (monthly amounts in euro)
| Minimum necessities | Additional expenses for social participation and recreation | ||
|---|---|---|---|
| Rent* | 443 | Additional contributions and subscriptions | 18.5 |
| Gas | 60 | Receive visitors | 19.5 |
| Electricity | 20 | To visit family and friends | 5.5 |
| Water | 9 | Holiday/going out | 39 |
| Telephone, television and internet | 54 | Additional transportation | 13.5 |
| Insurance† | 45 | ||
| Contributions and subscriptions | 2 | ||
| Transportation | 14 | ||
| Clothing and shoes | 56 | ||
| Inventory | 74 | ||
| Maintenance home and garden | 24 | ||
| Food | 201 | ||
| Laundry and cleaning supplies | 6 | ||
| Personal care | 21 | ||
| Miscellaneous | 10 | ||
| Total minimum necessities | 1039 | Total social participation and recreation | 96 |
-
Source: Vrooman et al. (2020).
-
*
This amount is obtained by estimating the average rent of a reference home.
-
†
Mandatory health insurance is excluded because its costs are deducted from income.
Planned policies of previous and current governments
| 1: The lower threshold of the higher bracket of the Box 1 income tax will be raised from 2025 onwards. 2: The minimum income benefit is gradually reduced because the double tax credit that is applied to the reference minimum wage – this is the net amount a couple would end up with in the hypothetical case that one of them would receive a gross benefit equal to the statutory gross minimum wage, while the other would have no income - on which the minimum income benefit is based is gradually phased out. 3: The transferability of the general tax credit, the in-work tax credit, and the in-work tax credit for single parents and second earners in couples with children will be abolished. 4: The imputed income from homeownership will be reduced by 0.05%. 5: The deduction for zero (or very low) home acquisition debt (‘wet Hillen’) will be abolished. 6: The reduction percentage of the health care allowance will be further increased. 7: The lower threshold of the second bracket of the Box 1 income tax for pensioners will be indexed to a limited extent (75%) for people born after 1945. 8: The pension agreement of 2020 will lead to a 0.3% reduction in pensions by 2060 (after 2060 it will further lower pensions but this period is excluded from our analysis). 9: The tax credit for the self-employed will not be indexed. 10: The maximum rate for tax deductions will be further reduced to the lower tariff in the two-bracket system of income tax over the period until 2023. 11: The mortgage redemption requirement to be eligible for mortgage interest deduction will be gradually increased over the period until 2042. |
Simulated effects of various individual policy options§
| Policy options | Ex-ante budgetary effect € bn | Poverty in persons % | Poverty in euros % | Poverty in persons (within group) % | Poverty in euros (within group) % | Employment % | Income inequality % |
|---|---|---|---|---|---|---|---|
| I. Policies aimed at children | |||||||
| 1: Raise child budget from third child onwards 2: Raise child budget for single parents 3: Raise child budget, combination of 1 and 2 4: Make in−work tax credit for second earners/single parents refundable | −0.2 −0.1 −0.3 −0.1 | −2.5 −0.9 −3.5 −0.1 | −1.1 −0.4 −1.5 −0.1 | −7.2 −2.3 −9.9 −0.3 | −3.4 −1.3 −4.6 −0.2 | 0.0 0.0 0.0 0.0 | −0.1 −0.1 −0.1 0.0 |
| II. Policies aimed at the working age population | |||||||
| 5: Make in−work tax credit refundable 6: Raise in−work tax credit for low incomes 7: In−work tax credit, combination of 5 and 6 8: Raise minimum income benefit to state pension level 9: Reverse reduction in minimum income benefit after 2021 10: Raise minimum income benefit to 70% of reference minimum wage per hh member | −0.3 −1.2 −2.5 −1.4 (−2.9*) −0.9 (−1.9*) −1.8 (−3.7*) | −0.8 −3.1 −6.3 −20.0 −16.7 −10.7 | −0.8 −1.7 −4.7 −8.8 −7.3 −4.3 | −1.1† −8.8† −14.0† −57.0† −48.0† −27.3† | −1.1† −4.5† −9.3† −57.1† −48.3† −21.3† | 0.0 −0.1‡ −0.2‡ −0.9‡ −0.6‡ −1.2‡ | −0.1 −0.4 −0.7 −0.9 −0.6 −0.5 |
| III. Policies aimed at the elderly | |||||||
| 11: Make tax credit for retirees refundable 12: Raise healthcare allowance for the elderly only by € 0.3 bn 13: Raise the tax deductibility of healthcare costs for the elderly only by € 0.3 bn | −0.8 −0.3 −0.3 | −1.7 −0.4 −0.2 | −2.2 −0.5 −0.1 | −10.0 −2.8 −1.6 | −14.6 −4.0 −1.1 | . . . | −0.4 −0.2 −0.1 |
| IV. General policies | |||||||
| 14: Make general tax credit refundable 15: Make general tax credit refundable and raise it by € 0.5 bn 16: Raise the tax deductibility of healthcare costs by € 0.3 bn | −4.8 −5.5 −0.3 | −16.0 −17.5 −0.9 | −19.1 −20.1 −0.5 | . . . | . . . | −0.8‡ −0.8‡ . | −1.1 −1.3 −0.1 |
-
Note: The reported effects document the changes relative to the structural baseline scenario (counterfactual), which assumes that all policies currently being gradually phased in are fully implemented but no additional policy changes occur.
-
*
The amounts between brackets show the total ex-ante effect when taking into account behavioural responses.
-
†
For the policies 5 to 10, the relevant group corresponds to a subcategory of the working age population, in particular workers (policies 5 to 7) or recipients of minimum income benefit (policies 8 to 10).
-
‡
Negative employment effects have an (unquantified) upward effect on poverty.
-
§
Table A1 in the appendix presents the results for the AROP threshold.
Simulated effects of selected individual policy options with an imposed budgetary impact of € 1.0 bn§
| Policy options | Ex-ante budgetary effect € bn | Poverty in persons % | Poverty in euros % | Poverty in persons (within group) % | Poverty in euros (within group) % | Employment % | Income inequality % |
|---|---|---|---|---|---|---|---|
| I. Policies aimed at children | |||||||
| 1: Raise child budget from third child onwards and further increase it for each child 2: Raise child allowance | −1.0 −1.0 | −7.3 −4.2 | −3.3 −2.1 | −19.8 −10.9 | −10.2 −6.4 | −0.2‡ −0.1‡ | −0.4 −0.2 |
| II. Policies aimed at the working age population | |||||||
| 3: Raise in−work tax credit 4: Raise minimum income benefit | −1.0 −1.0 (−2.0*) | −0.6 −17.9 | −0.2 −7.9 | −1.9† −55.7† | −0.7† −55.9† | 0.1 −0.7‡ | 0.0 −0.7 |
| III. Policies aimed at the elderly | |||||||
| 5: Make tax credit for retirees refundable and raise it 6: Raise healthcare allowance for the elderly only | −1.0 −1.0 | −1.8 −1.9 | −2.4 −2.0 | −10.9 −15.3 | −16.0 −14.5 | . . | −0.5 −0.9 |
| IV. General policies | |||||||
| 7: Raise rent allowance 8: Raise healthcare allowance 9: Raise general tax credit | −1.0 −1.0 −1.0 | −11.2 −5.6 −2.0 | −7.8 −4.7 −1.3 | . . . | . . . | −0.1‡ −0.1‡ 0.0 | −1.1 −0.7 −0.3 |
-
Note: The reported effects document the changes relative to the structural baseline scenario (counterfactual), which assumes that all policies currently being gradually phased in are fully implemented but no additional policy changes occur.
-
*
The amount between brackets shows the total ex-ante effect when taking into account behavioural responses.
-
†
For the policies 3 and 4, the relevant group corresponds to a subcategory of the working age population, in particular workers (policy 3) or recipients of minimum income benefit (policy 4).
-
‡
Negative employment effects have an (unquantified) upward effect on poverty.
-
§
Table A2 in the appendix presents the result for the AROP threshold.
Basic income scenarios
| Baseline | Scenario 1 | Scenario 2 | |
|---|---|---|---|
| UBI | Euros per month | ||
| Per adult | 0 | 560 | 635 |
| Per household | 0 | 500 | 600 |
| Total single adult household | 0 | 1060 | 1235 |
| Total per adult in a couple | 0 | 810 | 935 |
| UBI | Euros per year | ||
| Total single adult household | 0 | 12,722 | 14,822 |
| Total per adult in a couple | 0 | 9,722 | 11,222 |
| Benefits | |||
| Minimum income scheme (‘bijstand’) | maintained | abolished | abolished |
| Disability benefits for young people (‘Wajong’) | maintained | abolished | abolished |
| Public pension (‘AOW’) and benefits for widows/widowers (‘Anw’) | maintained | netted with UBI | abolished |
| Unemployment and disability benefits (‘WW’, ‘ZW’ and ‘WIA’) | maintained | netted with UBI | netted with UBI |
| Taxes, tax deductions and tax credits | |||
| Tariff first bracket Box 1 | 37.1% | 52.7% | 56.5% |
| Tariff second bracket Box 1 | 49.5% | 70.4% | 75.4% |
| Income tax credits | maintained | abolished | abolished |
| Tax on imputed income from homeownership (‘eigenwoningforfait’) | maintained | abolished | abolished |
| Mortgage interest rate tax deduction (‘hypotheekrenteaftrek’) | maintained | abolished | abolished |
| Allowances | |||
| Rent allowance (‘huurtoeslag’) | maintained | maintained | maintained |
| Child allowance (‘kinderbijslag’) | maintained | maintained | increased to 300 euros per child per month |
| Child budget (‘kindgebonden budget’) | maintained | maintained | abolished |
| Child care allowance (‘kinderopvangtoeslag’) | maintained | maintained | abolished |
| Healthcare allowance (‘zorgtoeslag’) | maintained | maintained | abolished |
| Study subsidies (‘studiefinanciering’) | maintained | abolished | abolished |
-
Note: Due to rounding, the annual UBI amounts do not exactly correspond to 12 times the monthly amount.
Simulated effects of larger reforms†
| Poverty in persons | Poverty in euros | Employment | Income inequality | |
|---|---|---|---|---|
| % | % | % | % | |
| Universal Basic Income | ||||
| Scenario 1 | −45.3 | −62.4 | −6.4* | −10.0 |
| Scenario 2 | −60.5 | −62.3 | −8.3* | −11.7 |
| Negative income tax | −14.8 | −19.3 | −0.9* | −2.1 |
| Unified allowance | 11.0 | 13.1 | 0.6 | −0.7 |
-
Note: The reported effects document the changes relative to the structural baseline scenario (counterfactual), which assumes that all policies currently being gradually phased in are fully implemented but no additional policy changes occur.
-
*
Negative employment effects have an (unquantified) upward effect on poverty.
-
†
Table A3 in the appendix presents the result for the AROP threshold.
Boxplots of the percentage change in household disposable income for different household groups in UBI scenario 1
| Distribution of effect on disposable income | |||||
|---|---|---|---|---|---|
| 5% | 25% | 50% (median effect) | 75% | 95% | |
| % change | |||||
| All households | −18.4 | −8.3 | −1.5 | 7.2 | 31.4 |
| Income percentiles | |||||
| 1-20% | −19.2 | −12.5 | 7 | 18.5 | 51.7 |
| 21-40% | −8.9 | −3.4 | 3.1 | 9 | 33.6 |
| 40-60% | −12.2 | −4.1 | 0 | 4.3 | 25 |
| 61-80% | −15.5 | −8.5 | −4.4 | 1.7 | 19.9 |
| 81-100% | −22.4 | −12.9 | −8.1 | −1 | 12.5 |
| Income source | |||||
| Employment | −16.4 | −7.6 | −0.4 | 8.8 | 31.4 |
| Benefits | −29.9 | −5.9 | 6.4 | 10.5 | 36 |
| Pension | −19.1 | −10.9 | −4.7 | 0.7 | 25.3 |
| Household type | |||||
| Dual earners | −18.1 | −9.5 | −5 | 1.5 | 22.4 |
| Single earners | −18.8 | −6.1 | 1.6 | 8.5 | 31.8 |
| Single-earner couples | −5.2 | 11 | 20.2 | 32.6 | 61.1 |
| With/without children | |||||
| With children | −19.2 | −11.3 | −4.9 | 6.7 | 30 |
| Without children | −15.8 | −5.6 | 1.5 | 10 | 33.5 |
Boxplots of the percentage change in household disposable income for different household groups in UBI scenario 2
| Distribution of effect on disposable income | |||||
|---|---|---|---|---|---|
| 5% | 25% | 50% (median effect) | 75% | 95% | |
| % change | |||||
| All households | −19.6 | −9.3 | −1.9 | 9.7 | 33.4 |
| Income percentiles | |||||
| 1−20% | −14.8 | −10.6 | 8.6 | 19.6 | 54.3 |
| 21−40% | −14.2 | −6.9 | 1.9 | 10.7 | 35 |
| 40−60% | −14.5 | −5.8 | 0.4 | 6 | 29.4 |
| 61−80% | −18.6 | −8.5 | −3.8 | 4.4 | 23.9 |
| 81−100% | −27.5 | −14.5 | −8.5 | 0 | 14.8 |
| Income source | |||||
| Employment | −20.5 | −7.2 | 1 | 11 | 34.6 |
| Benefits | −30.2 | −4.7 | 10.7 | 15 | 41.6 |
| Pension | −16.1 | −11.6 | −8.1 | −3.3 | 21.2 |
| Household type | |||||
| Dual earners | −22 | −10.2 | −5 | 3.7 | 25.4 |
| Single earners | −16.5 | −8.6 | 0.5 | 11 | 33.7 |
| Single−earner couples | −5.9 | 13.6 | 23.8 | 33.4 | 64.3 |
| With/without children | |||||
| With children | −27.6 | −11.3 | −2.1 | 10.1 | 35.4 |
| Without children | −17.1 | −5.8 | 3 | 12.4 | 35.9 |
Boxplots of the percentage change in household disposable income for different household groups in the negative income tax scenario
| Distribution of effect on disposable income | |||||
|---|---|---|---|---|---|
| 5% | 25% | 50% (median effect) | 75% | 95% | |
| % change | |||||
| All households | −2.1 | −1.7 | −1.5 | 0.4 | 7.5 |
| Income percentiles | |||||
| 1−20% | −1.6 | −1.5 | −1.2 | 0.7 | 12.8 |
| 21−40% | −1.8 | −1.6 | −1.4 | 1.5 | 8.9 |
| 40−60% | −2 | −1.7 | −1.5 | 0.5 | 6.9 |
| 61−80% | −2.1 | −1.8 | −1.6 | −0.1 | 5 |
| 81−100% | −2.6 | −2 | −1.8 | −0.5 | 2.9 |
| Income source | |||||
| Employment | −2.2 | −1.8 | −1.5 | −0.4 | 7.1 |
| Benefits | −2.1 | −1.6 | −1.5 | −1 | 11 |
| Pension | −1.9 | −1.5 | −1.2 | 1.1 | 7.3 |
| Household type | |||||
| Dual earners | −2.2 | −1.8 | −1.4 | 1.1 | 6.5 |
| Single earners | −2.1 | −1.8 | −1.5 | −1.2 | 3.7 |
| Single-earner couples | 1 | 3.8 | 6.4 | 9.6 | 17.1 |
| With/without children | |||||
| With children | −2.2 | −1.6 | −0.9 | 2.9 | 9.8 |
| Without children | −2.2 | −1.8 | −1.6 | −1.3 | 5.8 |
Boxplots of the percentage change in household disposable income for different household groups in the unified allowance scenario
| Distribution of effect on disposable income | |||||
|---|---|---|---|---|---|
| 5% | 25% | 50% (median effect) | 75% | 95% | |
| % change | |||||
| All households | −5.5 | −0.4 | −0.1 | −0.1 | 9.2 |
| Income percentiles | |||||
| 1−20% | −14.3 | −4.1 | −0.3 | 4 | 13.4 |
| 21−40% | −3.6 | −1 | −0.1 | 6.9 | 10.9 |
| 40−60% | −4 | −0.1 | −0.1 | −0.1 | 4.8 |
| 61−80% | −2.4 | −0.2 | −0.1 | −0.1 | −0.1 |
| 81−100% | −0.5 | −0.2 | −0.1 | −0.1 | −0.1 |
| Income source | |||||
| Employment | −3.9 | −0.2 | −0.1 | −0.1 | 8.3 |
| Benefits | −15.9 | −5.2 | −0.3 | 1.4 | 9.9 |
| Pension | −5.1 | −0.4 | −0.1 | 2.8 | 10.1 |
| Household type | |||||
| Dual earners | −3.3 | −0.2 | −0.1 | −0.1 | 3.3 |
| Single earners | −8.3 | −0.5 | −0.1 | 4.3 | 11.3 |
| Single−earner couples | −5.8 | −1.5 | −0.1 | −0.1 | 5.9 |
| With/without children | |||||
| With children | −6.8 | −2.2 | −0.2 | −0.1 | 1.6 |
| Without children | −4.3 | −0.2 | −0.1 | −0.1 | 9.7 |
Simulated effects of various individual policy options, poverty threshold equals 60% of median net disposable income
| Policy options | Poverty in persons % | Poverty in euros % | Poverty in persons (within group) % | Poverty in euros (within group) % |
|---|---|---|---|---|
| I. Policies aimed at children | ||||
| 1: Raise child budget from third child onwards | −1.3 | −1.0 | −3.7 | −3.2 |
| 2: Raise child budget for single parents | −0.5 | −0.5 | −1.2 | −1.7 |
| 3: Raise child budget, combination of 1 and 2 | −1.9 | −1.6 | −5.1 | −4.9 |
| 4: Make in−work tax credit for second earners/single parents refundable | −0.1 | −0.1 | −0.4 | −0.2 |
| II. Policies aimed at the working age population | ||||
| 5: Make in−work tax credit refundable | −0.6 | −0.7 | −0.8* | −0.9* |
| 6: Raise in−work tax credit for low incomes | −3.0 | −2.4 | −7.7* | −7.0* |
| 7: In−work tax credit, combination of 5 and 6 | −5.4 | −5.1 | −11.8* | −11.4* |
| 8: Raise minimum income benefit to state pension level | −4.6 | −11.0 | −9.9* | −44.2* |
| 9: Reverse reduction in minimum income benefit after 2021 | −2.3 | −7.7 | −5.2* | −30.6* |
| 10: Raise minimum income benefit to 70% of reference minimum wage per hh member | −7.9 | −5.2 | −24.0* | −18.8* |
| III. Policies aimed at the elderly | ||||
| 11: Make tax credit for retirees refundable | −2.0 | −2.1 | −12.4 | −12.8 |
| 12: Raise healthcare allowance for the elderly only by € 0.3 bn | −1.0 | −0.6 | −6.6 | −4.5 |
| 13: Raise the tax deductibility of healthcare costs for the elderly only by € 0.3 bn | −0.4 | −0.2 | −2.8 | −1.6 |
| IV. General policies | ||||
| 14: Make general tax credit refundable | −13.7 | −16.3 | . | . |
| 15: Make general tax credit refundable and raise it by € 0.5 bn | −14.5 | −17.3 | . | . |
| 16: Raise the tax deductibility of healthcare costs by € 0.3 bn | −0.5 | −0.5 | . | . |
-
Note: The reported effects document the changes relative to the structural baseline scenario (counterfactual), which assumes that all policies currently being gradually phased in are fully implemented but no additional policy changes occur.
-
*
For the policies 5 to 10, the relevant group corresponds to a subcategory of the working age population, in particular workers (policies 5 to 7) or recipients of minimum income benefit (policies 8 to 10).
Simulated effects of selected individual policy options with an imposed budgetary impact of € 1.0 bn, poverty threshold equals 60% of median net disposable income
| Policy options | Poverty in persons % | Poverty in euros % | Poverty in persons (within group) % | Poverty in euros (within group) % |
|---|---|---|---|---|
| I. Policies aimed at children | ||||
| 1: Raise child budget from third child onwards and further increase it for each child | −4.1 | −3.5 | −9.8 | −11.1 |
| 2: Raise child allowance | −1.3 | −1.1 | −2.9 | −3.5 |
| II. Policies aimed at the working age population | ||||
| 3: Raise in−work tax credit | −0.4 | −0.3 | −1.3* | −1.0* |
| 4: Raise minimum income benefit | −6.9 | −4.4 | −13.8* | −10.1* |
| III. Policies aimed at the elderly | ||||
| 5: Make tax credit for retirees refundable and raise it | −2.4 | −2.3 | −14.4 | −14.2 |
| 6: Raise healthcare allowance for the elderly only | −2.8 | −2.3 | −18.3 | −16.0 |
| IV. General policies | ||||
| 7: Raise rent allowance | −5.3 | −7.9 | . | . |
| 8: Raise healthcare allowance | −3.5 | −4.4 | . | . |
| 9: Raise general tax credit | −1.4 | −1.4 | . | . |
-
Note: The reported effects document the changes relative to the structural baseline scenario (counterfactual), which assumes that all policies currently being gradually phased in are fully implemented but no additional policy changes occur.
-
*
For the policies 3 and 4, the relevant group corresponds to a subcategory of the working age population, in particular workers (policy 3) or recipients of minimum income benefit (policy 4).
Simulated effects of larger reforms, poverty threshold equals 60% of median net disposable income
| Poverty in persons | Poverty in euros | |
|---|---|---|
| % | % | |
| Universal Basic Income | ||
| Scenario 1 | −28.3 | −48.4 |
| Scenario 2 | −26.1 | −52.9 |
| Negative income tax | −14.1 | −16.1 |
| Unified allowance | 5.1 | 10.4 |
-
Note: The reported effects document the changes relative to the structural baseline scenario (counterfactual), which assumes that all policies currently being gradually phased in are fully implemented but no additional policy changes occur.
Data and code availability
MIMOSI and MICSIM are developed and maintained by the CPB Netherlands Bureau for Economic Policy Analysis (abbreviated as CPB). The code used to compute the results discussed in this paper is not made publicly available, because it is not suitable for use by external researchers without training and support. A short model description of MIMOSI for researchers and policy makers, with an explanation of outputs and examples of policy simulations, is available in Dutch via this link: MIMOSI: Microsimulatiemodel voor belastingen, sociale zekerheid, loonkosten en koopkracht | CPB.nl. A more technical model description of MICSIM for researchers is available in English via this link: MICSIM 2.0 (cpb.nl). Requests to review the code can be made to info@cpb.nl.
MIMOSI uses annual observations on household income components and other characteristics necessary to simulate net disposable income. Statistics Netherlands collects register-based microdata on all Dutch households but MIMOSI only requires a representative sample of 100,000 households to run reliable simulations for the Netherlands. Doing so significantly speeds up the computation time. Therefore, at the request of the CPB, Statistics Netherlands made a sample of the register-based microdata on household gross, net and disposable income and wealth and demographic and socio-economic characteristics. For the simulations in this paper we relied on a sample from 2016, the most recent year available at the time of performing the simulations. The source register-based microdata can be made available by Statistics Netherlands upon request within the European Union under strict conditions for statistical research.
For the computation of net disposable income, MICSIM relies on MIMOSI. In addition, MICSIM uses the annual observations of the Labour Force Survey (in Dutch: Enquete Beroepsbevolking), which contains the education level of adult members of the household. Statistics Netherlands supplements this data set with additional register-based data on socio-economic characteristics and data on child care from the Dutch Tax Authority. This data can be made available by Statistics Netherlands upon request within the European Union under strict conditions for statistical research.
All data and code is preserved for at least five years after publication.