Worlds Apart: Postcodes with the Highest and Lowest Poverty Rates in Today’s Australia
- NATSEM, University of Canberra, Australia. This article was originally presented to National Social Policy Conference "2001", Sydney, July 2001.
Figures

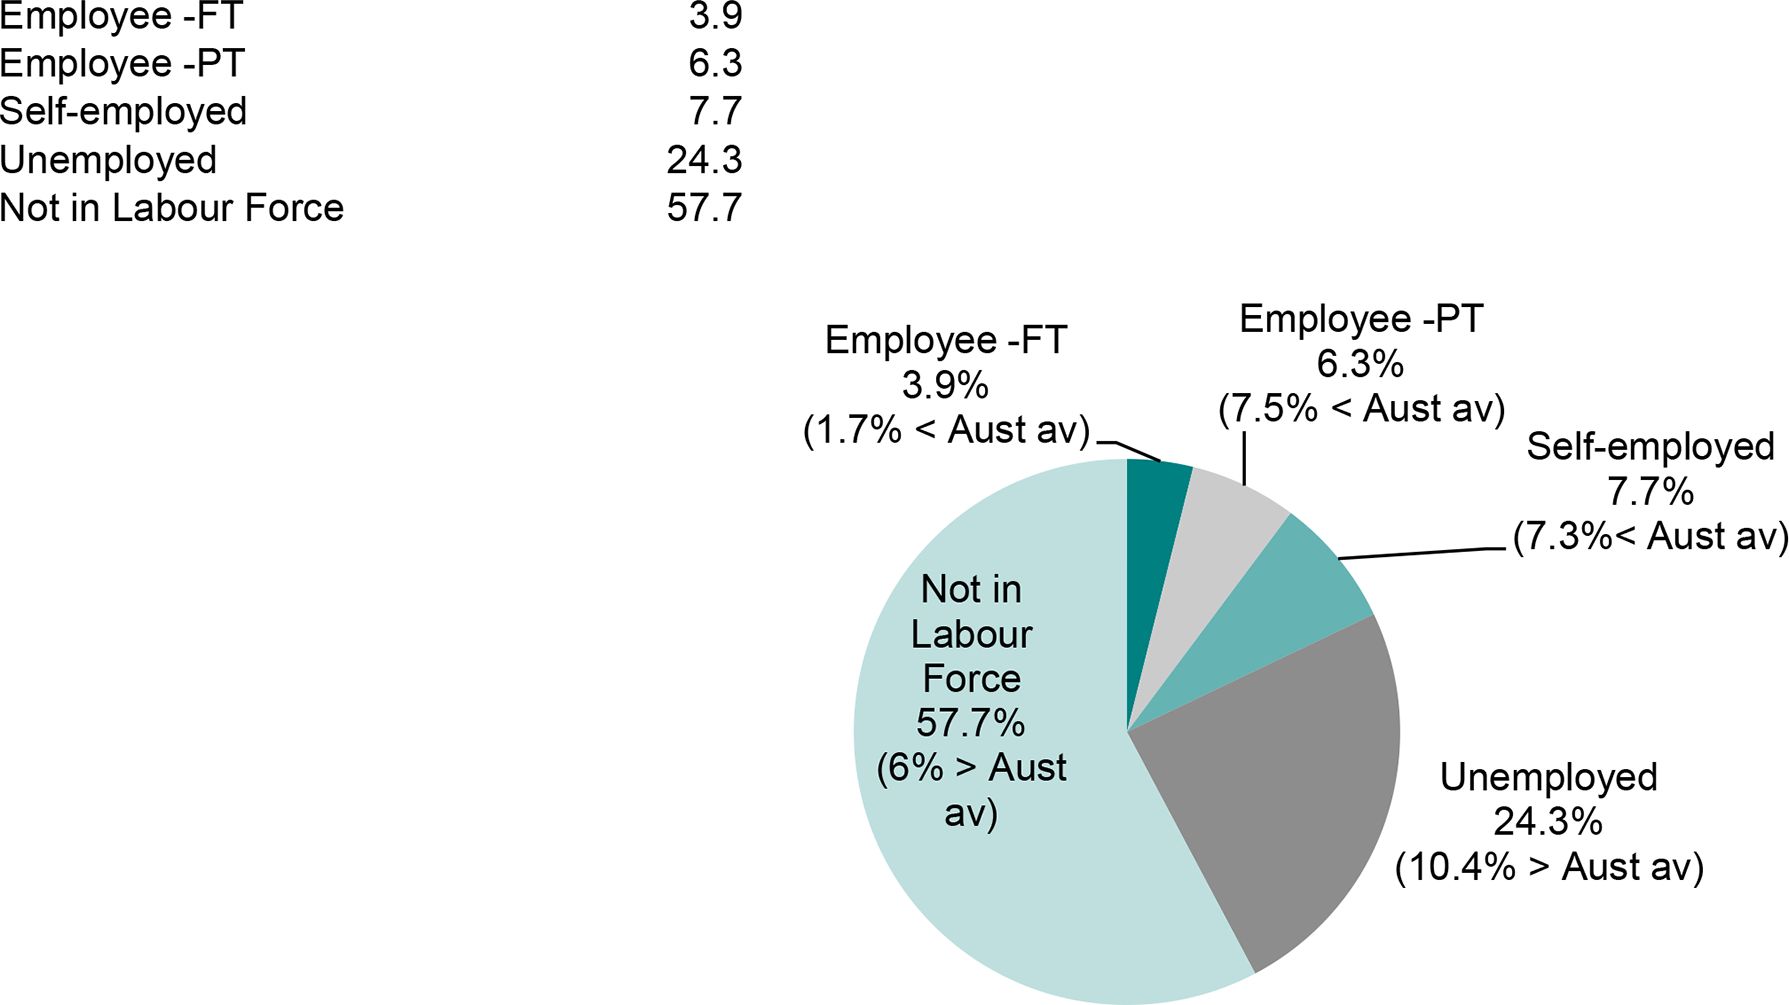
Labour force status of household reference person in poor households in Carlton South (and percentage point difference from national average). Data source: 1998-99 HES and Marketinfo/2001 weights.

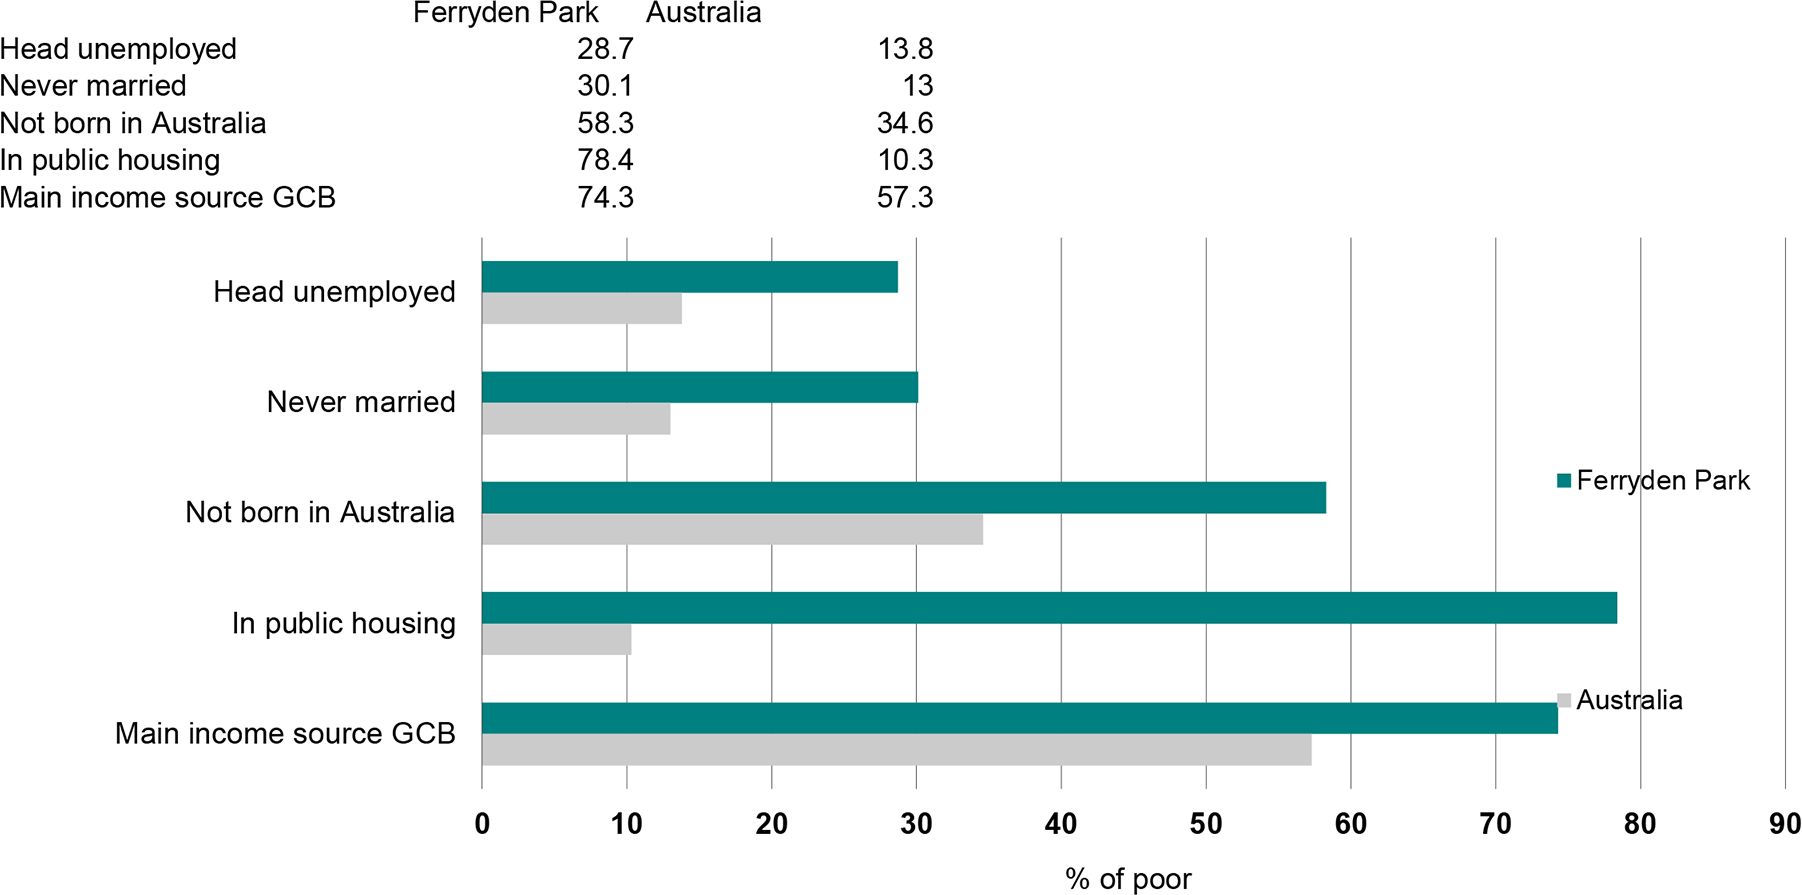
Selected household characteristics of poor residents of Ferryden Park and all poor Australians. Data source: 1998-99 HES and Marketinfo/2001 weights.
Tables
Number of postcodes and number with less than 1000 households, by state
| Total number of postcodes | Number of postcodes with less than 1000 households | |
|---|---|---|
| New South Wales | 589 | 181 |
| Victoria | 625 | 305 |
| Queensland | 392 | 154 |
| South Australia | 321 | 178 |
| Western Australia | 289 | 171 |
| Tasmania | 108 | 62 |
-
Source: 1998-99 HES and Marketinfo/2001 weights.
NSW postcodes with highest and lowest poverty rates
| Highest poverty rate | Lowest poverty rate | NSW average | Australian average | |
|---|---|---|---|---|
| Postcode number | 2834 | 2088 | ||
| Postcode name | Lightning Ridge | Spit Junction | ||
| Poverty rates | % | % | % | % |
| People | 25.9 | 0.7 | 9.8 | 10.3 |
| Adults | 22.4 | 0.9 | 8.8 | 9.3 |
| Children | 39.6 | 0.2 | 12.5 | 12.9 |
-
Note: Poverty rates are measured at the household level, which means they are not directly comparable to most other poverty studies. Only includes postcodes with over 1000 households.
-
Source: 1998-99 HES and Marketinfo/2001 weights.
-
*
Using the Henderson half average poverty line
Victorian postcodes with highest and lowest poverty rates
| Highest poverty rate | Lowest poverty rate | Victorian average | Australian average | |
|---|---|---|---|---|
| Postcode number | 3053 | 3186 | ||
| Postcode name | Carlton South | Brighton | ||
| Poverty rates | % | % | % | % |
| People | 25.2 | 1.4 | 10.1 | 10.3 |
| Adults | 22.4 | 1.3 | 9.2 | 9.3 |
| Children | 38.5 | 1.8 | 12.8 | 12.9 |
-
Note: Poverty rates are measured at the household level, which means they are not directly comparable to most other poverty studies.
-
Source: 1998-99 HES and Marketinfo/2001 weights.
-
*
Using the Henderson half average poverty line.
Queensland postcodes with highest and lowest poverty rates
| Highest poverty rate | Lowest poverty rate | Queensland average | Australian average | |
|---|---|---|---|---|
| Postcode number | 4671 | 4069 | ||
| Postcode name | Gin Gin | Kenmore | ||
| Poverty rates | % | % | % | % |
| People | 21.6 | 3.4 | 10.6 | 10.3 |
| Adults | 20.0 | 2.9 | 9.6 | 9.3 |
| Children | 25.9 | 4.6 | 13.3 | 12.9 |
-
Note: Poverty rates are measured at the household level, which means they are not directly comparable to most other poverty studies.
-
Source: 1998-99 HES and Marketinfo/2001 weights.
-
*
Using the Henderson half average poverty line.
South Australian postcodes with highest and lowest poverty rates
| Highest poverty rate | Lowest poverty rate | South Australian average | Australian average | |
|---|---|---|---|---|
| Postcode number | 5010 | 5725 | ||
| Postcode name | Ferryden Park | Roxby Downs | ||
| Poverty rates | % | % | % | % |
| People | 29.8 | 1.4 | 12.1 | 10.3 |
| Adults | 27.2 | 0.9 | 11.2 | 9.3 |
| Children | 36.9 | 2.6 | 14.6 | 12.9 |
-
Note: Poverty rates are measured at the household level, which means they are not directly comparable to most other poverty studies.
-
Source: 1998-99 HES and Marketinfo/2001 weights.
-
*
Using the Henderson half average poverty line.
West Australian postcodes with highest and lowest poverty rates
| Highest poverty rate | Lowest poverty rate | West Australian average | Australian average | |
|---|---|---|---|---|
| Postcode number | 6000 | 6015 | ||
| Postcode name | Perth City | City Beach | ||
| Poverty rates | % | % | % | % |
| People | 19.0 | 2.8 | 10.3 | 10.3 |
| Adults | 18.5 | 2.5 | 9.4 | 9.3 |
| Children | 23.3 | 3.5 | 12.7 | 12.9 |
-
Note: Poverty rates are measured at the household level, which means they are not directly comparable to most other poverty studies.
-
Source: 1998-99 HES and Marketinfo/2001 weights.
-
*
Using the Henderson half average poverty line.
Tasmanian postcodes with highest and lowest poverty rates
| Highest poverty rate | Lowest poverty rate | Tasmanian average | Australian average | |
|---|---|---|---|---|
| Postcode number | 7215 | 7053 | ||
| Postcode name | St. Mary’s | Taroona | ||
| Poverty rates | % | % | % | % |
| People | 20.5 | 6.4 | 13.0 | 10.3 |
| Adults | 18.5 | 6.2 | 12.3 | 9.3 |
| Children | 26.4 | 7.0 | 14.9 | 12.9 |
-
Note: Poverty rates are measured at the household level, which means they are not directly comparable to most other poverty studies.
-
Source: 1998-99 HES and Marketinfo/2001 weights.
-
*
Using the Henderson half average poverty line.
Characteristics of people in poverty in poorest postcodes and Australia
| Postcode | 2834 | 3053 | 4671 | 5010 | 6000 | 7215 | Australia |
|---|---|---|---|---|---|---|---|
| % of total in poverty | |||||||
| Age of the household reference person | |||||||
| Less than 25 years | 2.1 | 10.3 | 0.8 | 9.5 | 23.2 | 4.8 | 4.6 |
| 25-34 years | 35.2 | 24.7 | 21.6 | 31.6 | 28.4 | 22.9 | 25.9 |
| 35-44 years | 22.6 | 32.5 | 35.8 | 22.9 | 26 | 32.5 | 30.7 |
| 45-54 years | 19.9 | 22.1 | 17.9 | 19.8 | 14 | 18.6 | 17.1 |
| 55-64 years | 13.7 | 3.4 | 15.4 | 3.9 | 4.6 | 13.8 | 10.7 |
| 65 years or more | 6.6 | 7 | 8.6 | 12.3 | 3.9 | 7.3 | 11.1 |
| 100 | 100 | 100 | 100 | 100 | 100 | 100 | |
| Sex of the reference person | |||||||
| Male | 43.3 | 52.6 | 43 | 42.1 | 51.4 | 36.9 | 37.6 |
| Female | 56.7 | 47.4 | 57 | 57.9 | 48.6 | 63.1 | 62.4 |
| 100 | 100 | 100 | 100 | 100 | 100 | 100 | |
| Labour force status of the reference person | |||||||
| Employee – full-time | 1.9 | 3.9 | 4.7 | 3.8 | 1.2 | 3.8 | 5.6 |
| Employee – part-time | 17 | 6.3 | 16.2 | 8.5 | 16.9 | 15 | 13.8 |
| Self employed | 14.3 | 7.7 | 18.9 | 3.5 | 4.7 | 15.6 | 15 |
| Unemployed | 24.5 | 24.3 | 16.3 | 28.7 | 26.6 | 12.2 | 13.8 |
| Not in the labour force | 42.3 | 57.7 | 43.8 | 55.6 | 50.7 | 53.4 | 51.7 |
| 100 | 100 | 100 | 100 | 100 | 100 | 100 | |
| Principal source of income for the household | |||||||
| Wage and salary | 9.9 | 7.6 | 17.1 | 10.6 | 13.4 | 13.1 | 16.3 |
| Self-employed | 7 | 3.5 | 9.2 | 0.3 | 5.1 | 10 | 7.6 |
| Other | 11.2 | 28.6 | 8.7 | 11.8 | 19.1 | 8.7 | 12.7 |
| Government cash benefits | 68.3 | 60.2 | 59.6 | 74.3 | 56.8 | 63.6 | 57.3 |
| Zero or negative income | 3.5 | 0.1 | 5.4 | 3 | 5.5 | 4.7 | 6 |
| 100 | 100 | 100 | 100 | 100 | 100 | 100 | |
| Occupation of the reference person | |||||||
| NA (ie not working in occupation) | 66.9 | 82 | 60.2 | 84.3 | 77.3 | 65.6 | 65.6 |
| Managers and professionals | 9 | 12.6 | 17.6 | 2.9 | 8.7 | 13.9 | 13.7 |
| Tradespersons | 4.7 | 0 | 3.1 | 1.6 | 0.1 | 3.9 | 3.1 |
| Clerical, sales and service | 10.8 | 0.9 | 9.8 | 4.8 | 6.7 | 9.8 | 9.8 |
| Labourers, production and transport workers | 8.7 | 4.5 | 9.4 | 6.4 | 7.2 | 6.8 | 7.8 |
| 100 | 100 | 100 | 100 | 100 | 100 | 100 | |
| Tenure type | |||||||
| Owner | 43.8 | 13.9 | 42.4 | 10.9 | 18.6 | 43.2 | 34.9 |
| Purchaser | 15.6 | 10.1 | 26.4 | 7.7 | 7.3 | 23.8 | 22.8 |
| Public housing | 2.1 | 36.9 | 22.7 | 78.4 | 14.6 | 3.7 | 10.3 |
| Private renter | 28.8 | 38.4 | 8.4 | 2.3 | 55 | 21.9 | 27.1 |
| Other, rent-free | 9.7 | 0.7 | 0 | 0.7 | 4.5 | 7.4 | 5 |
| 100 | 100 | 100 | 100 | 100 | 100 | 100 | |
| Marital status of the reference person | |||||||
| Never Married | 13.1 | 30.9 | 6.1 | 30.1 | 46.9 | 8.8 | 13 |
| Separated/divorced/widowed | 26.6 | 19 | 16.7 | 20 | 14 | 17.1 | 23.1 |
| Married | 60.3 | 50.1 | 77.2 | 49.9 | 39 | 74.1 | 63.9 |
| 100 | 100 | 100 | 100 | 100 | 100 | 100 | |
| Household type | |||||||
| Single person | 23.7 | 21.6 | 12.3 | 20.6 | 47.1 | 16.1 | 15.4 |
| Couple only | 14.1 | 7.8 | 20.4 | 13.2 | 9.3 | 16.2 | 15.4 |
| Couple with children | 42.7 | 39.2 | 49.6 | 32.8 | 24.2 | 53.8 | 40.7 |
| Sole parent | 14.5 | 20.3 | 10.4 | 28.3 | 9.5 | 9.9 | 20 |
| Multiple families | 5 | 11.1 | 7.3 | 5.1 | 10 | 4 | 8.5 |
| 100 | 100 | 100 | 100 | 100 | 100 | 100 | |
| Number of dependents in the household | |||||||
| None | 46 | 39 | 39.8 | 37.3 | 68.2 | 37.9 | 38.3 |
| One | 6.6 | 20.2 | 13 | 18.7 | 18 | 12.7 | 13.4 |
| Two | 15.8 | 39.7 | 15.5 | 31.7 | 13.5 | 20.4 | 22.2 |
| Three | 20 | 0 | 21.2 | 1 | 0.3 | 21.5 | 18.6 |
| Four | 11.5 | 1 | 8.1 | 11.3 | 0 | 7.2 | 6.4 |
| Five or more | 0.1 | 0 | 2.4 | 0 | 0 | 0.2 | 1 |
| 100 | 100 | 100 | 100 | 100 | 100 | 100 | |
| Country of birth of the reference person | |||||||
| Australia | 81.7 | 29.4 | 76.2 | 41.7 | 51.4 | 86.6 | 65.4 |
| Other | 4.4 | 12.8 | 5.2 | 28.4 | 10.3 | 2.7 | 8.2 |
| Europe/former USSR | 13 | 24.6 | 13.7 | 18 | 19.6 | 10.1 | 14.6 |
| Asia | 0.8 | 33.2 | 5 | 11.9 | 18.6 | 0.6 | 11.7 |
| 100 | 100 | 100 | 100 | 100 | 100 | 100 | |
-
Source: 1998-99 HES and Marketinfo/2001 weights.
-
*
Using the Henderson half average poverty line.
Characteristics of the high poverty postcodes
| 2834 | 3053 | 4671 | 5010 | 6000 | 7215 | Aust-ralia | |
|---|---|---|---|---|---|---|---|
| Average total income (annual) | 25 164 | 40 011 | 28 955 | 22 480 | 36 995 | 27 568 | 45 574 |
| Average disposable income (annual) | 21 999 | 31 740 | 25 471 | 20 600 | 29 188 | 23 993 | 36 581 |
| Age of the household reference person | |||||||
| Less than 25 years | 3.5 | 21.7 | 1.9 | 7.5 | 16.2 | 3.8 | 4.2 |
| 25-34 years | 22.1 | 28.1 | 14.1 | 22.4 | 27.9 | 18.3 | 20.2 |
| 35-44 years | 22.8 | 21.5 | 32.1 | 26.6 | 21.4 | 29.8 | 29.1 |
| 45-54 years | 19.8 | 14.5 | 23.1 | 16.3 | 17.9 | 19.6 | 22.9 |
| 55-64 years | 18 | 7.3 | 15.3 | 11.3 | 7.3 | 14.2 | 11.4 |
| 65 years or more | 13.9 | 6.9 | 13.6 | 15.9 | 9.3 | 14.2 | 12.2 |
| Sex of the reference person | |||||||
| Male | 55.9 | 55.7 | 58.2 | 53.1 | 64 | 56.3 | 63 |
| Female | 44.1 | 44.3 | 41.8 | 46.9 | 36 | 43.7 | 37 |
| Labour force status of reference person | |||||||
| Employee – full-time | 22.3 | 41 | 29.5 | 26.4 | 44.8 | 28 | 49.6 |
| Employee – part-time | 14.8 | 12.7 | 12.6 | 15.9 | 11 | 14.6 | 10.6 |
| Self employed | 8.8 | 2.8 | 12 | 1.7 | 3.5 | 10.7 | 7.8 |
| Unemployed | 9.3 | 7 | 5 | 9 | 6.9 | 3.5 | 2.4 |
| Not in the labour force | 44.8 | 36.6 | 40.8 | 47 | 33.8 | 43.1 | 29.6 |
| Principal source of income for the household | |||||||
| Wage and salary | 34.4 | 50.4 | 42.1 | 37.2 | 54.7 | 38.9 | 61.4 |
| Self-employed | 6.9 | 2 | 10.7 | 0.6 | 3.9 | 10.2 | 6.8 |
| Other | 8.5 | 12.6 | 7.4 | 4.5 | 15.9 | 8.3 | 6.6 |
| Government cash benefits | 49.3 | 35 | 38.7 | 56.9 | 24.5 | 41.7 | 24.6 |
| Zero or negative income | 0.9 | 0 | 1.2 | 0.9 | 1.1 | 1 | 0.6 |
| Occupation of the reference person | |||||||
| NA (ie not working in occupation) | 54.1 | 43.6 | 45.9 | 56 | 40.7 | 46.6 | 32 |
| Managers and professionals | 12.3 | 36.4 | 18.3 | 7 | 35.3 | 20.7 | 32.3 |
| Tradespersons | 6.3 | 2.2 | 6.9 | 7.3 | 3.2 | 10.3 | 10.1 |
| Clerical, sales and service | 12.1 | 10.6 | 9.9 | 6.1 | 11.2 | 9.8 | 13.1 |
| Labourers, production and transport workers | 15.2 | 7.2 | 19 | 23.6 | 9.6 | 12.6 | 12.6 |
| Tenure type | |||||||
| Owner | 57.8 | 14.9 | 45.8 | 11.2 | 19.6 | 45 | 36.9 |
| Purchaser | 10.9 | 10.6 | 32.1 | 12.9 | 16.7 | 29.8 | 33.8 |
| Public housing | 1.9 | 21 | 17.5 | 68 | 4.8 | 2.8 | 5 |
| Private renter | 22.9 | 52.1 | 4.6 | 7.6 | 56.5 | 18.7 | 22.2 |
| Other, rent-free | 6.4 | 1.3 | 0 | 0.4 | 2.3 | 3.6 | 2.2 |
| Marital status of the reference person | |||||||
| Never Married | 14.2 | 36 | 5 | 21 | 38.1 | 7.8 | 10.4 |
| Separated/divorced/widowed | 24.1 | 17.4 | 14.8 | 22.5 | 16.1 | 15.6 | 16.4 |
| Married | 61.7 | 46.6 | 80.2 | 56.5 | 45.8 | 76.6 | 73.2 |
| Household type | |||||||
| Single person | 20.6 | 17 | 7.5 | 14.2 | 33.1 | 12.2 | 9.6 |
| Couple only | 23.5 | 14.6 | 26.7 | 17.1 | 22.9 | 27.6 | 19.7 |
| Couple with children | 32.6 | 26.1 | 45.5 | 34.1 | 20.5 | 45.4 | 45.4 |
| Sole parent | 12.1 | 14 | 9.1 | 24.5 | 7.4 | 8.9 | 11.5 |
| Multiple families | 11.2 | 28.3 | 11.2 | 10.2 | 16.1 | 5.9 | 13.7 |
| Number of dependents in the household | |||||||
| None | 60.3 | 59.5 | 46.9 | 46.1 | 73 | 49.1 | 45.3 |
| One | 10.7 | 17.8 | 11.6 | 19.2 | 19.2 | 13 | 16.5 |
| Two | 13.6 | 21.5 | 19.1 | 23.3 | 7.3 | 20.8 | 21.7 |
| Three | 11.4 | 0.3 | 13.4 | 3 | 0.4 | 12.8 | 11.9 |
| Four | 3.8 | 0.8 | 6 | 7.1 | 0 | 3.7 | 3.5 |
| Five or more | 0.2 | 0.2 | 3 | 1.3 | 0 | 0.6 | 1.1 |
| Country of birth of the reference person | |||||||
| Australia | 75.7 | 47.6 | 78 | 50 | 55.7 | 87.4 | 69.2 |
| Other | 4.9 | 12.3 | 5.6 | 13.9 | 12.2 | 3.1 | 7.3 |
| Europe/former USSR | 19 | 17.3 | 14.2 | 16.9 | 16.4 | 9.2 | 16.1 |
| Asia | 0.3 | 22.8 | 2.2 | 19.2 | 15.7 | 0.4 | 7.3 |
-
Source: 1998-99 HES and Marketinfo/2001 weights.
Characteristics of the low poverty postcodes
| 2088 | 3186 | 4069 | 5725 | 6015 | 7053 | Australia | |
|---|---|---|---|---|---|---|---|
| Average total income (annual) | 97 677 | 87 880 | 79 073 | 87 412 | 88 544 | 51 203 | 45 574 |
| Average disposable income (annual) | 67 953 | 62 773 | 58 338 | 63 243 | 63 901 | 40 572 | 36 581 |
| Age of the household reference person | |||||||
| Less than 25 years | 4.5 | 2.4 | 3 | 8.4 | 2.3 | 2.1 | 4.2 |
| 25-34 years | 21.5 | 10.8 | 9.7 | 37.2 | 7.4 | 8.3 | 20.2 |
| 35-44 years | 24.9 | 28.1 | 27.9 | 34.5 | 25.3 | 29.3 | 29.1 |
| 45-54 years | 25.5 | 30.9 | 33.6 | 13.9 | 32.6 | 32.5 | 22.9 |
| 55-64 years | 12 | 12.6 | 15.4 | 4 | 17.3 | 13 | 11.4 |
| 65 years or more | 11.6 | 15.3 | 10.4 | 1.9 | 15.2 | 14.9 | 12.2 |
| Sex of the reference person | |||||||
| Male | 68.7 | 73.3 | 75 | 90.1 | 80.2 | 64.2 | 63 |
| Female | 31.3 | 26.7 | 25 | 9.9 | 19.8 | 35.8 | 37 |
| Labour force status of the reference person | |||||||
| Employee – full-time | 69 | 65.4 | 66.8 | 85.8 | 63.4 | 54.5 | 49.6 |
| Employee – part-time | 7 | 5 | 9.3 | 3.2 | 6.7 | 10.3 | 10.6 |
| Self employed | 6.3 | 6.3 | 5.9 | 6.4 | 8.2 | 6 | 7.8 |
| Unemployed | 0.4 | 0.9 | 0.8 | 0.3 | 0.3 | 1.6 | 2.4 |
| Not in the labour force | 17.2 | 22.5 | 17.1 | 4.3 | 21.4 | 27.6 | 29.6 |
| Principal source of income for the household | |||||||
| Wage and salary | 73.3 | 71.5 | 75.9 | 88.3 | 70.5 | 64.3 | 61.4 |
| Self-employed | 7.6 | 7.3 | 5.8 | 5.6 | 9.1 | 5.4 | 6.8 |
| Other | 10 | 12.3 | 9.2 | 2 | 14.7 | 10 | 6.6 |
| Government cash benefits | 9.1 | 8.9 | 9.1 | 4 | 5.7 | 19.8 | 24.6 |
| Zero or negative income | 0 | 0 | 0.1 | 0 | 0.1 | 0.5 | 0.6 |
| Occupation of the reference person | |||||||
| NA (ie not working in occupation) | 17.6 | 23.4 | 17.9 | 4.6 | 21.7 | 29.2 | 32 |
| Managers and professionals | 67.7 | 67.1 | 64.5 | 33.1 | 66.1 | 54.5 | 32.3 |
| Tradespersons | 3.7 | 2 | 5.1 | 21.5 | 2.2 | 4.5 | 10.1 |
| Clerical, sales and service | 7.6 | 6.3 | 9.3 | 6.1 | 6.8 | 9.8 | 13.1 |
| Labourers, production and transport workers | 3.3 | 1.2 | 3.2 | 34.7 | 3.2 | 2.1 | 12.6 |
| Tenure type | |||||||
| Owner | 40.7 | 51.7 | 46.6 | 23 | 58.9 | 45.1 | 36.9 |
| Purchaser | 21 | 25.1 | 38.1 | 36.7 | 28.7 | 39.9 | 33.8 |
| Public housing | 0.9 | 0.2 | 0.1 | 0 | 10.1 | 2.2 | 5 |
| Private renter | 35.9 | 20.9 | 13.8 | 38.8 | 2.3 | 11.7 | 22.2 |
| Other, rent-free | 1.5 | 2 | 1.4 | 1.5 | 0 | 1.2 | 2.2 |
| Marital status of the reference person | |||||||
| Never Married | 17.9 | 10.1 | 6.7 | 5 | 6.8 | 7.8 | 10.4 |
| Separated/divorced/widowed | 14.5 | 15.3 | 11 | 7.6 | 9.3 | 17.2 | 16.4 |
| Married | 67.6 | 74.7 | 82.3 | 87.5 | 83.9 | 75 | 73.2 |
| Household type | |||||||
| Single person | 16.6 | 11.4 | 4.3 | 5 | 6.3 | 8.7 | 9.6 |
| Couple only | 25 | 22.2 | 18.5 | 17.9 | 24.1 | 20.9 | 19.7 |
| Couple with children | 35 | 47.1 | 56.5 | 64.3 | 54.8 | 48.6 | 45.4 |
| Sole parent | 7.5 | 7.1 | 9 | 4.2 | 6.1 | 10.8 | 11.5 |
| Multiple families | 15.9 | 12.3 | 11.8 | 8.5 | 8.7 | 11 | 13.7 |
| Number of dependents in the household | |||||||
| None | 54.7 | 48.3 | 38.4 | 34.7 | 42.4 | 44 | 45.3 |
| One | 15.1 | 17.3 | 18.1 | 12 | 15.7 | 15.9 | 16.5 |
| Two | 20.6 | 21.4 | 25.1 | 34 | 22.2 | 24.5 | 21.7 |
| Three | 8.3 | 12.6 | 13.7 | 18.5 | 18.9 | 11.6 | 11.9 |
| Four | 1.2 | 0.4 | 3.7 | 0.8 | 0.8 | 3 | 3.5 |
| Five or more | 0 | 0 | 0.9 | 0 | 0 | 1 | 1.1 |
| Country of birth of the reference person | |||||||
| Australia | 57.5 | 73.5 | 66.1 | 82.2 | 67.2 | 71.7 | 69.2 |
| Other | 12.1 | 7.8 | 6.8 | 7.9 | 9.4 | 5.5 | 7.3 |
| Europe/former USSR | 14.6 | 13.6 | 17.8 | 9.7 | 18 | 19 | 16.1 |
| Asia | 15.9 | 5 | 9.3 | 0.2 | 5.4 | 3.8 | 7.3 |
-
Source: 1998-99 HES and Marketinfo/2001 weights.
Data and code availability
Please contact the authors for information on data and code availability.