The Retirement Decision in Dynamic Microsimulation Models: An Exploratory Review
- Inštitut za ekonomska raziskovanja, Slovenia
Abstract
This article conducts an exploratory review of the decision to retire in microsimulation models (MSM) by asking two research questions: Which theoretical and methodological approaches from the scientific literature on retirement are used in MSM? What is the theoretical and methodological quality of those models? Retirement is a central topic in microsimulation. The knowledge about the concrete way in which the transition probabilities of retiring are modelled is, however, scattered across the individual MSM’s documentation. This review constitutes a first attempt at centralising the available knowledge. It has three main objectives: to link the treatment of retirement in the MSM tradition to the broader theoretical and methodological paradigms governing the study of retirement decisions, to deepen the knowledge basis on MSM, and to encourage further discussion and knowledge-sharing about how retirement decisions are modelled in MSM. Using the systematic review methodology first outlined by Moher et al. (2009), a general analysis including 32 models was conducted, after which 26 models were examined in detail. The review found a relatively uniform application of econometric methods when estimating retirement decisions, whereas some theoretical frames and variables are less well-represented.
1. Introduction
How is the decision to retire modelled in dynamic microsimulation models (MSM)? This article attempts to answer this question and start a discussion on the topic via an exploratory review of retirement modelling in OECD countries’ MSM.
From the outset, pension modelling1 has been an essential element of microsimulation approaches. Since the 1990s, population ageing and its corollary pension reform have grown into one of the perennial, protracted discussions in the social policies of Western and increasingly non-Western countries. The question has only gained importance as the decline in fertility typical of the post-industrial society and the retirement wave of the baby-boomer generation set in.
Microsimulation has long been known as a technique to project the possible consequences of policy changes onto a population, with Orcutt (1957) being regarded as its founding father. However, only during the past few decades, thanks to technological advances, has the use of MSM has genuinely spread. MSM is now widely accepted as a method of ex-ante evaluation for such disparate topics as tax reforms, spatial planning, or health policies.
The essence of MSM may be defined as “experimenting with a virtual society of thousands— or millions—of individuals who are created in a computer” (Spielauer, 2011). These simulated individuals' behaviour is governed by parameters determined by the researcher, or by stochastic processes. It should also be noted that microsimulation is a rather complex technique, as it encompasses several fields of knowledge (informatics, statistics, economics, and social policy). This complexity is compounded by the lack of standard software for microsimulation.
Despite the complexity, MSM have flourished in recent decades (for a review, see Li and O’Donoghue, 2013). Many among these models focus on the topic of retirement: Li et al. (2014) identify pensions as the most modelled topic (with 34 models addressing it). This topic lends itself particularly well to the method: as the same authors (Li et al., 2014) point out, pension policies only mature in the long term. The pension topic also fits the conditions set out by Spielauer (2011, p. 14-15) for the use of MSM: it involves a highly heterogeneous population with too many relevant combinations of characteristics to be split into groups; it features decisions adopted at the micro- (individual) level that have a large, complex, aggregated impact on the population as a whole (for instance, on public finances), and it involves individuals with histories that are relevant (for instance, pension entitlements are influenced by past work careers).
Current MSM reviews provide extensive accounts of the type of MSM used to analyse pension dynamics, the data on which they are based, and their objectives. Dekkers and Van den Bosch (2016) document 17 semi-public models for pensions in the EU alone. Coda Moscarola (in OECD, 2015) identifies 38 models dealing with pensions worldwide in an update of Li and O’Donoghue (2013) review. These studies provide a bird’s eye view of MSM and highlight several of their technical details: the type of data used, the longitudinal or cross-sectional nature, and the order of events in the microsimulation (Dekkers and Van den Bosch, 2016); the base population and type of data, the type of time modelling, the open or closed nature of the model, and the use of alignment algorithms. Li and O’Donoghue (2013) and Coda Moscarola (in OECD, 2015) briefly survey the use of behavioural equations. However, none of the sources delve further into the concrete definition of retirement, how the decision to retire is operationalised or modelled, or how that operationalisation fits within the sprawling scientific literature on retirement. Consequently, there is no way to compare the quality of the retirement components in the analysed MSM.
The broad question posed above (“How is the decision to retire modelled in dynamic MSM?”) forms the backbone of this overview. It can be further specified as two separate research questions: Which theoretical and methodological approaches from the scientific literature on retirement are used in MSM? What is the theoretical and methodological quality of those models?
By answering these research questions, the study intends to achieve three objectives. First, it attempts to link the treatment of retirement in the MSM tradition to the broader theoretical and methodological paradigms governing the study of retirement decisions. Second, it aims to deepen the knowledge basis of MSM by zooming in on the modelling of a specific item. Third, it encourages further discussion and knowledge-sharing about how retirement decisions are best modelled by microsimulation.
When doing the above, it is essential to acknowledge the limitations of the article, the first being the gaps in public knowledge. Due to the nature of microsimulation models, which are often developed to support policy-making by public administrations, the amount of public information available is somewhat reduced or available only in the local language. In this sense, this study does not aim to be an exhaustive review, but rather a starting point for consolidating the knowledge of modelling techniques. Practitioners' reactions, and corrections to the presented information are encouraged.
The second limitation relates to the treatment of the MSM’s technical aspects. The focus on the substantive topic (retirement) reduces the scope of the review and precludes the detailed discussion of other aspects of the models, such as their software architecture or alignment techniques.
A third limitation is rooted in the fact that one aspect of retirement (i.e. the retirement decision) is singled out for a thorough analysis at the cost of other topics, such as the determinants of retirement incomes or the modelling of alternative routes to retirement, such as disability pensions.
The article is structured into five sections. After the introduction, Section 2 frames the research questions within the current scientific retirement research, as MSM are not created in a vacuum, but rather incorporate many existing insights. The third section sets out the methodology for the overview and uses the literature’s conceptual categories to produce a set of categories to classify the models. The fourth section presents the review’s findings, and the final section relates those findings to the retirement literature and produces some concluding remarks.
2. Retirement in the scientific literature
Retirement has been studied across many disciplinary traditions, such as economics, sociology, psychology, and political economy. To provide a complete overview of this literature would be overambitious and outside this article’s scope. Therefore, this section focuses on the sociological and economic approaches which allow for the statistical modelling of retirement decisions based on economic and socio-demographic variables, leaving the psychological and human resources literature aside. The main objective of this short overview is, rather than to be exhaustive, to illustrate the myriad ways in which retirement is studied. The first subsection focuses on the conceptual issues, the second on the factors influencing retirement, and the third on the methods and data used to study those factors.
2.1 The retirement concept
Retirement has been defined several times, both at the scientific and policy levels. Fisher et al. (2016, p. 232) point to the challenges posed by the many conceptualisations and their impact on the study of retirement timing. Here, these conceptualisations are shortly reviewed along three dimensions: the substantive elements present in the definition, the nature of the retirement transition, and the level at which the retirement decision is made.
In 1995, the OECD (Dorn and Sousa-Poza, 2005) presents a summary overview of the substantive elements referred to above:
“being a recipient of a public or private old-age pension, regardless of the current employment status;
being out of the labour force, regardless of the reason for ceasing work and no matter whether an old-age pension is being drawn; or
having a self-described status of retired, regardless of employment status and receipt of a pension”.
The central components of those definitions are: receiving a pension, the worker’s departure from a labour force, and their self-perceived status. The three elements are identifiable across several definitions in the literature. Samwick and Wise (2003) argue that, depending on the context, retirement may be defined as the exit from a particular firm, from the main job (as defined by Fisher et al., 2016), or from the labour force altogether, as operationalised by Samwick (1998) and Merkurieva et al. (2018). Riedel et al. (2015) opt for the same definition, and define retirement in purely operational terms, based on the European Labour Force Survey, as being no longer economically active. Hospido and Zamarro (2014) define retirement in the same terms and include older persons' transitions to statuses other than self-reported retirement (unemployed, homemaker, permanently sick or disabled). Other authors (Gruber and van der Laan, 2009; Hofäcker et al., 2015; Radl and Himmelreicher, 2015; Trentini, 2021) use only self-reported retirement, which may include pre-retirement, in which people may work part-time. Fischer and Sousa-Poza (2006) combine two criteria: self-reported status, and being out of the labour force.
Common amongst the above definitions is their operational nature: they refer to concrete, measurable constructs. Other authors, such as Topa et al. (2009), provide an extensive discussion of the retirement concept as a process, divide it into two sub-components (retirement planning and retirement decision) and explore their relationship.
The second conceptual dimension refers to how retirement relates to the transitions to and from the labour market. If retirement is conceptualised as an absorbing state, once a retirement decision has taken place, the retiree is assumed not to go back into the labour market (Belloni and Alessie, 2013; Dahl et al., 1999; Knoef et al., 2013; Laun et al., 2019). Other authors assume the opposite: retirees may experience several transitions from work to retirement and vice versa (Berkel and Börsch-Supan, 2003; Rust and Phelan, 1997).2 This choice has important theoretical and empirical implications. If retirement is assumed to be a non-absorbing state, the question arises as to whether the retirement decision may be regarded as indistinguishable from other decisions concerning labour-market supply (e.g., the decision to work or not to work). If this is the case, the variables influencing that transition will likely be the same as those influencing the labour-market supply during earlier life phases. Empirically, retirement as a non-absorbing state has been linked to Anglo-Saxon countries (cf. infra). However, the emergence of part-time retirement schemes and an increase in the number of working retirees in some European countries, such as Portugal (Eurofund, 2012), have produced an overlap between work and retirement elsewhere. These changes may have consequences both in terms of concept-building and microsimulation modelling.
The third conceptual dimension refers to the level at which the retirement decision is made, i.e. whether a personal decision, as opposed to a joint decision taken with other household members. Whereas the decision has traditionally been modelled at the individual level, several authors have looked at the joint modelling of retirement decisions within a household (Bertogg et al., 2021; Casanova, 2010; Hospido and Zamarro, 2014; Merkurieva et al., 2018; Radl and Himmelreicher, 2015).
2.2 The modelling of retirement3
Here, the reviewed articles are organised along two paradigmatic lines: the econometric literature and the interdisciplinary approaches focusing on socio-economic variables.4 The discussion does not limit itself to the MSM literature, but instead attempts to provide a brief general overview of the current developments across disciplines.
The econometric tradition assumes individuals approach the retirement decision rationally, as an optimisation problem in which utility is maximised within the constraints given by his or her preferences, expected utility and assets, and some socio-economic control variables.
Within this tradition, a distinction can be further made between structural and reduced-form models (see, for instance, Heckman and Vytlacil, 2005 for a clear explanation of both techniques). Structural models attempt to grasp the entire environment within which a particular phenomenon occurs. Conversely, reduced-form equations focus on policy evaluation and the effect of specific treatments (i.e. policy interventions) on the behaviour of rational agents, often exploiting discontinuities in policies to create quasi-experimental settings in which they compare identical observations to assess the treatment variable’s effect (Manoli and Weber, 2011). The variables used do not correspond precisely to the operationalisation of concepts such as utility or leisure preferences (Dahl et al., 1999). Applied to the context of retirement, an example of a structural model is that of Gustman and Steinmeier (2008), in which married men are assumed to maximise their expected utility in accordance with the value they attach to consumption and leisure, subject to an asset constraint defined by the return rate, wages, their partner’s income (treated as exogenous), pension benefits and consumption itself. All parameters related to these variables are then estimated using the Generalised Method of Moments. Other examples of structural econometric models applied to retirement are Berkovec and Stern (1991), the rest of Gustman and Steinmeier (1983; Gustman and Steinmeier, 1994; 2002; 2008), Casanova, 2010, and Rust and Phelan (1997).
An example of a reduced form model is that of Dahl et al. (1999), in which the authors develop a formal model where an individual chooses his status in the labour market according to a utility-maximisation function. This model is operationalised by multinomial logits incorporating several explanatory variables (family situation, the presence of children, age, educational level, being a civil servant, income, spouse characteristics, and industries) to explain the transitions into early retirement. Other authors produce similar analyses focusing on the influence of policies (; Manoli and Weber, 2011), economic crises (Sirven and Barnay, 2017), and financial incentives (Asch, Haider, and Zissimopoulos 2005). Hospido and Zamarro (2014) use a reduced-form model to explain retirement from a couple’s perspective.
The Option Value Model can acquire a purely structural form if the preference parameters are estimated, as has been done by and Gruber and Wise (2004). Nevertheless, taking into consideration the difficulty of estimating these parameters successfully, as pointed out by Asch et al. (2005), the model is used chiefly in its reduced form (Belloni and Alessie, 2013; Hanappi et al., 2012; Manoli and Weber, 2011; Samwick and Wise, 2003).
Parallel to the econometric tradition, a sprawling literature has emerged at the crossroads of other disciplines (social policy, sociology, health studies). The present section relies mainly on multidisciplinary review articles (Scharn et al., 2018; Topa et al., 2017).
Several classifications of the factors influencing retirement have emerged throughout the years. Feldman (1994) introduced the distinction between the push factors that coerce workers to retire, and the pull factors which motivate them. He arranged those factors into four groups: the individual’s history (work history, marital status, demographic status, health status, attitudes towards work and attitudes towards retirement), opportunity structures in the career path (age-related performance decrements, discrimination, industry and primary vs secondary labour-market jobs), organisational factors (financial rewards, retirement counselling, flexibility in managing older workers) and external environment (macroeconomic uncertainty, social security, economic growth, inflation and government programs to assist older workers). The distinction remains relevant to this date (Beier et al., 2019; Kim and Beehr, 2019; De Preter et al., 2013; Scharn et al., 2018; Sousa et al., 2023; Wang and Wanberg, 2017).
Feldman’s classification echoes in more recent review studies, such as Topa et al. (2017), who classify push and pull factors along four levels: individual (income, financial security, and health), job (job satisfaction), work (organisational pressures, workplace timing for retirement, and job stress) and family (family pull). Wang and Shultz (2010) identify all factors influencing the retirement process and similarly group them into four levels: individual attributes, job and organisational factors, family factors, and socio-economic factors.
Scharn et al. (2018) proceed differently and define 12 factors: demographic factors, health, lifestyle, social factors, social participation, work characteristics, job demands, contextual factors, financial factors, retirement preferences, macro effects, and birth cohort.
2.3 Methodology, data and results
The models referred to above are tested using a variety of statistical techniques. The structural components of the Option-Value model have been estimated by linear regression or a grid search (Gruber and Wise, 2004; Lumsdaine et al., 1992). Other approaches are probit (Böckerman and Ilmakunnas, 2020) and logit regressions (Trentini, 2021), event history analysis (Hagan, Jones, and Rice 2009; Mäcken et al., 2022), variations of Cox regressions (van der Mark Kerstin Gabriëlle, 2016), multilevel event history analysis (Van Bavel and De Winter, 2013; De Breij, Huisman, and Deeg 2020; Radl and Himmelreicher, 2015), multilevel analysis (Bertogg et al., 2021; De Preter et al., 2013), sequence analysis (Hoven et al., 2018), nonparametric estimates (Manoli and Weber, 2011) and piecewise exponential functions (Radl, 2013). Machine-learning algorithms have also recently been applied (Garibay et al., 2022).
The data with which the models described above are tested vary widely. Both cross-sectional (van den Berg et al., 2010; Fischer and Sousa-Poza, 2006; Fleischmann, 2014; van der Zwaan et al., 2019) and longitudinal data have been used (Van Bavel and De Winter, 2013; Bertogg et al., 2021; Böckerman and Ilmakunnas, 2020; de Breij et al., 2020; Hagan et al., 2009; ; De Preter et al., 2013; Radl and Himmelreicher, 2015; Trentini, 2021). These data originate from a variety of administrative and survey sources.
Most of the studies focus on particular aspects of retirement. For example, Sundstrup et al. (2021), Hagan et al. (2009) and highlight the role of health. De Preter et al. (2013) also point at health and grandparenting, which Van Bavel and De Winter (2013) find influential. Trentini, 2021 and de Breij et al. (2020) focus on education. The findings from Böckerman and Ilmakunnas (2020) suggest a considerable influence of working conditions on retirement. Manoli and Weber (2011) and Hoven et al. (2018) examine financial incentives and socio-economic conditions. Lopez and Slavov (2020) illuminate the differential retirement patterns of immigrants. The role of spouses and gender norms has also been underlined (Bertogg et al., 2021; Radl and Himmelreicher, 2015), as has that of policies (Boot et al., 2019).
The high number of variables assessed makes it impossible to draw general conclusions from their results. Topa et al. (2017) find, based on a meta-analysis of 151 articles, that the age at which co-workers retire, followed by organisational pressures, are the factors that best explain early retirement; with health, financial security, and family pull being significant as well. Job stress, job satisfaction, and income were found to have the smallest effect (while still remaining significant). They are all positively related to early retirement, except for job satisfaction and income.
Scharn et al. (2018) point at the disparate findings of studies across countries. One of the articles in their review which analysed education (Rubb, 2009) found no effects stemming from overeducation on early retirement in the United States. In another study (Schils, 2008), education did not affect early retirement in the Netherlands or Germany, but a higher educational level positively affected the probability of early retirement in the United Kingdom. In other words, the findings of the different studies seem to be highly contingent across regions and may be related to the institutional regime at stake (the impact of health on retirement may be different in the United States, where health insurance is linked to an employer, from the Nordic countries, where the state provides universal health care).
A more recent large-scale study has confirmed the role of institutions: in a systematic review of the factors influencing the recent increase in actual retirement rates across the OECD members, the authors (Boissonneault et al., 2020) identify institutional heterogeneity, policy changes, education levels, and personal wealth as the factors explaining higher retirement ages.
3. Methodology
3.1 Methodological principles
Even though systematic reviews are often used in academic research on social sciences and for assessing policy interventions (Campbell Collaboration, 2022; Petticrew and Roberts, 2006), there are no uniformly-used reporting standards for literature reviews of MSM. Within microsimulation research, Speybroeck et al. (2013) conducted a systematic review of MSM of health inequalities using the Preferred Reporting Items for Systematic reviews and Meta-Analyses (PRISMA) statement developed by Moher et al. (2009). Scharn et al. (2018) also used it in their systematic review of retirement research. The present review is structured along the PRISMA guidelines based on these two studies.
The PRISMA guidelines were developed for summarising, organising and evaluating evidence in the field of health sciences, which is substantially different from MSM. Whereas systematic reviews in the medical field often focus on a narrowly-defined causal questions, such as the study of the impact of a specific treatment on patients' survival, MSM encompass broad, policy-related research questions outside (quasi-)experimental settings.5 In a systematic review, the quality of the available evidence is evaluated using causality as the main criterion: the closer an article is to proving the causal relationship between a covariate of interest and an outcome, the more its findings weigh in the evaluation. This strict causal logic requires some relaxations before the PRISMA checklist of elements (Moher et al. 2009:4) may be applied to an exploratory systematic review, as has been done by Scharn et al. (2018) and Speybroeck et al. (2013), who use only some components of the checklist. In this sense, the features related to Participants, Interventions, Comparisons, Outcomes, and Study design (PICOS) cannot be applied because there is no population for which the causal effect of an intervention is being gauged, but rather a "population of models". This heterogeneity precludes the inclusion of meta-analytical components as well. Furthermore, given that the publication of MSM documentation does not depend on the model’s results, the risk of publication bias is not assessed either. The remaining elements in the checklist are included in the present review.
3.2 Search strategy
The following steps were conducted. First, existing inventories of microsimulation models were identified through an Internet search. Five such inventories were collected: The Economic Policy Committee and Directorate-General for Economic and Financial Affairs (2007), Li and O’Donoghue (2013), Coda Moscarola (in OECD, 2015) and Dekkers and Van den Bosch (2016). Each inventory contained further references to documents describing the model (academic articles, administrative reports, technical documents, working papers). In this sense, one "record" in this context may either be one single scientific document (not necessarily containing an MSM) or one or more technical documents referring to a single MSM (this was the case, for instance, for French models). These documents were retrieved through an internet search or direct contact with their authors. If the documents referred to in the inventories were not found, a different Internet search (using First Page and Google Scholar as search engines) was conducted using the model’s name and the country as search terms to find at least one source containing a detailed description of the model. Records describing models in English, French, Dutch, Spanish, or Italian were considered.
Second, the Web of Science and the SAGE databases were screened for articles on microsimulation models incorporating retirement. Since models are often scattered across disciplines, the entire databases were searched. The used search queries were TOPIC: (microsimulation* AND (pension* OR retire*)) for Web of Science and [All microsimulation*] AND [[All pension*] OR [All retire*]] AND NOT [All spatial] for SAGE.
The process followed the PRISMA guidelines (Moher et al. 2009): After the sources were compiled and any duplicates removed, titles and abstracts were screened. Irrelevant or inaccessible records were removed, and full-text documents were screened. The screening, email exchanges with experts regarding inaccessible sources, and the reviewed version of an earlier iteration of this article produced models not mentioned in the inventories.6 A further email exchange took place with Canadian experts regarding the characteristics of two models (LifePaths and DYNACAN), and face-to-face consultations took place with two experts (Boris Majcen and Nataša Kump from the Institute for Economic Research) regarding the Slovenian models (IER model and DyPenSI).7 The information from DyPenSI originates from the author’s own experience throughout the development of the model.
The process is summarised in Figure 1. The entire inventory of studies is available as a supplementary Excel file.
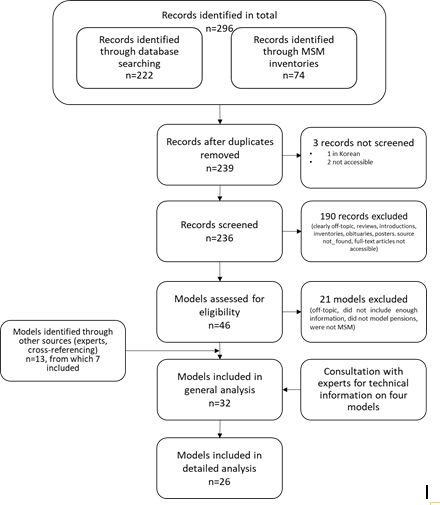
Flow of information through the phases of the systematic review. Source: template from Moher et al. (2009), filled and modified by the author following the example of Scharn et al. (2018).
3.3 Selection criteria and data extraction
Two nested selection processes took place: one to find those MSM that modelled retirement to look at the broad conceptualisation thereof, and one to find those models providing sufficient information to assess their methodological quality. Throughout the first assessment of the records, the selection criteria were: the mention of pensions or retirement and microsimulation in the abstract, and a concrete model referring to OECD countries. The full-text article was consulted if no clarity could be found in the abstract. The same criteria were also applied while screening full-text articles, particularly concerning technical specifications detailing how pensions were treated in the model. In addition, the full-text documents were screened for a probabilistic treatment (i.e. modelling) of the retirement decision, and only MSM using dynamic ageing, in which life histories for each individual are simulated within the MSM (Gal et al., 2009), were included. Both cross-sectional and longitudinal ageing were included in the model.
Throughout the selection, the decision to retire early was not viewed separately from retirement as such. The existence of an official retirement age, coupled with the receipt of pension benefits (Social Protection Committee (SPC) and European Commission (DG EMPL), 2021) implies that most citizens will retire by that age, which makes the modelling of retirement de facto the modelling of early retirement, even if it is not necessarily named as such by the model.8 For instance, the Swedish SESIM III models only the decision to retire early, and assumes that every worker will be retired by the legal age of 65 (Flood et al., 2012); and the French PRISME models both “regular” retirement (from 60 years old) and early retirement. By contrast, MINT (Smith et al., 2007) define retirement as “movement from work of greater than 20 hours per week (…) to work of less than or equal to 20 hours per week” that triggers benefit take up.
It should be noted that the selection took the microsimulation label at face value; as will be clear from the results, several models (especially those retrieved through database search) could instead be classified as cohort models, as they apply no microsimulation techniques.
Exclusion criteria were: the absence of retirement components in the model, the absence of references to a model and to microsimulation, the absence of detailed technical information about the retirement components of the model, and the absence of a probabilistic component in the retirement decisions and the use of static ageing, in which cross-section characteristics of the simulated population are updated exogenously as opposed to simulated (Gal et al., 2009). In other words, MSM in which retirement was treated deterministically, by assigning some exogenous value without calculating or imputing retirement probabilities (also referred to as “transition probabilities”), were left out of the study.9
The search strategy produced 309 records, 222 of which were identified through database searches and 74 through MSM inventories. Removing duplicates left us with 252 records, three of which were not screened (one was written in Korean, and two were not accessible). Of the 239 screened records, 193 were excluded due to outright irrelevance, full-text sources not being found and inaccessible articles. The remaining 46 models were then screened for eligibility. Of those, 21 were excluded (they were off-topic, the full text did not include enough information, one did not model pensions, ten treated pensions deterministically as opposed to stochastically, and one was not a microsimulation model).
It should be noted that models belonging to the same family, such as the MIDAS-group (Dekkers and Desmet, 2018; Moreira et al., 2019), were considered as repeated records, and only one representative of each group was included. This approach produces a bias in the resulting distribution of models by publication year and country (cf. infra, Table 1 and Graph 1). Through cross-referencing, Google searches, and expert interviews, a further 13 models were collected and 7 of them retained, and so a total of 32 models were included in the first (qualitative) analysis. It should be noted here that most models for which little or no information was available belong to the older generation of MSM.
Countries by number of MSM modelling retirement
| Number of models | Country |
|---|---|
| 1 | Belgium, Denmark, Finland, Germany, Hungary, Ireland, Netherlands, Norway, Sweden, Slovenia, Spain |
| 2 | Australia, Canada, UK, Multi-Country |
| 3 | US |
| 4 | France |
| 6 | Italy |
-
Source: own elaboration
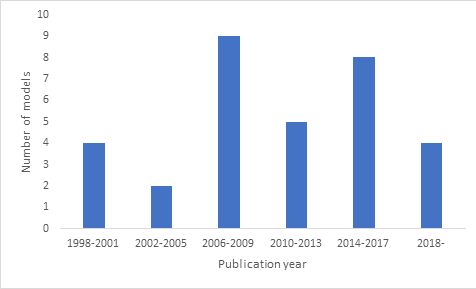
Dynamic MSM modelling retirement by year of publication (n=32)
Once the final population of studies was fixed, the models were scanned for relevant data. An initial model inventory was constructed that included the following features: source (author), year of publication, name of the model, country, retirement dimension (substantive components of retirement, relationship with other labour market decisions, level at which the decision is made), and the technique used to produce the distribution of transition probabilities.10 (statistical equations, user-defined probabilities, existing distributions). Finally, a free-text column detailed how retirement was treated in the model.
In the second selection round, based on the dummies for the separate treatment of retirement and retirement modelling, 26 models were selected to assess their theoretical and methodological quality. Only those MSM which regarded retirement as a separate decision from other labour market supply decisions were included in this analysis.
Conversely, studies were excluded if the analysis was not explicitly addressed at retirement. Regressions in which the decision to retire was considered conceptually equal to the decision to enter the labour force at earlier ages were thus left out.
For the 26 models that were finally selected, some more detailed information was collected on the sample size, the population categories covered, the data source, the model’s theoretical embedding, the calculation method for the transition probabilities to retirement, the source of the parameters defining the transition probabilities, its analysis and validation techniques, the presence of alignment, and the number of estimations. Based on that information, a further assessment was conducted. Unlike Scharn et al. (2018), who assign scores to the reviewed studies based on their methodological quality, this study sets out and discusses the MSM at length using the collected dimensions.
It should be noted here that the extent to which measures of statistical fit (such as R2) help compare models may be limited in this context. The transition probabilities calculated in the context of MSM are subject to the constraints of the available administrative or survey datasets, which often only include a small number of those factors potentially influencing retirement. For instance, variables such as health may be missing from administrative datasets. Therefore, the amount of explained variance may be somewhat limited. Therefore, statistical fit as such was not examined in detail.
4. Models’ analysis
4.1 General analysis
This section sets out the basic characteristics of the 32 models that were finally retained: their year of publication, country, the substantive components of the retirement definition that they model, the level at which the decision is made, whether retirement is an absorbing state, and the techniques used to estimate the transition probabilities towards retirement.
The publication years, depicted in Figure 2, span 1998-2022, with most models appearing after 2000 (see the graph below). This development coincides with the literature’s assertion (Li and O’Donoghue, 2013; Spielauer, 2011) that the advent of MSM occurred during the 2000s.11 This distribution is, however, not representative because of the inclusion of a single model per family (cf. supra).
Most of the countries using MSM belong to Western Europe and North America (with Australia as an exception). However, a potential source of bias should be noted here, given two methodological choices. First, some models excluded from the analysis due to lack of information were from Eastern European countries such as Poland, the Czech Republic, and Romania (Dekkers and Van den Bosch, 2016). Second, the analysis of a single model per family ignores several countries (e.g., Portugal, Switzerland) where existing platforms have been applied. The models originate from 21 different countries. There is, however, a significant difference between countries regarding the number of models and their complexity. Table 1 displays the number of models by country. Source: own elaboration. Most countries are represented by one or two models. Canada, the US, the UK, France and Italy seem to display a more complex landscape, with the two latter countries displaying the richest microsimulation tradition (as it will become apparent below, their models may also be counted among the most complex). The JAS-mine Labour Force Participation model (Richiardi and Richardson, 2015) covers several countries.
It should also be noted that models within or across countries are often interrelated or overlap due to the use of the same model-development software. Even though nearly every MSM is developed as a stand-alone piece of software, often with its own language and conventions, some entities provide platforms to construct new models using their ad-hoc developed tools. Some examples are: the MicSim package in R (), the MODGEN language, a C++-related microsimulation package (Charette and Hicks, 2017), the LIAM (), LIAM2 (), and UMDBS (Sauerbier, 2002) software. This interrelatedness leads to a complex model genealogy. For example, the software LIAM2 (Bryon et al., 2018) lies at the basis of the Belgian MIDAS, which shares ancestry with the Italian T-DYMM (Caretta et al., 2013). MIDAS has been applied in the German and Italian contexts as well (), and has served as a template for models in Portugal (Moreira et al., 2019), Luxemburg (Dekkers and Desmet, 2018), Hungary (Dekkers et al., 2015a; Dekkers et al., 2015b), Slovakia (Štefánik and Miklošovič, 2020), and Switzerland (Kirn and Baumann, 2021) as well as for the French AGIRC/ARRCO (Direction technique AGIRC-ARRCO, 2020). The MODGEN software has been used to build the Spanish DyPeS and the Slovenian DyPenSI. The JAS-mine engine has been used to develop LABSim and the Labour Participation Model, which was created for the European Fund for Living and Working Conditions (Richiardi and Richardson, 2015). DESTINIE is the basis for several other French models (such as Cuvilliez and Laurent, 2016). The British NIBAX (van de Ven, 2011) forms the basis of the Italian NIBAX-ITALISSIMO, and the Italian ANAC model (O’Donoghue, 2001) uses the same estimators for transition probabilities to retirement as the Italian DYNAMITE model. Likewise, the administrative and academic fields may also be interrelated: the Irish Life-cycle redistribution in the Irish Tax-Benefit system – the Irish Dynamic Cohort Microsimulation Model - was first developed as a PhD project and is built on LIAM, which is different from LIAM2 and is itself the basis for several other models (O’Donoghue et al., 2009).
The 32 models are, as set out in the inclusion criteria, dynamic MSM. This implies the creation of new characteristics for the baseline population, as well as of new individuals that may react to changes in public policies. All the selected models have been developed or commissioned by large institutions such as planning offices, ministries of work or the economy or statistical services, which reflects their resource-intensive nature.12 Moreover, most of them cover broader issues of income distribution along with pensions.
The models display significant convergence in their conceptualisation of retirement, as shown in Table 2.
MSM modelling retirement by substantive components present in their retirement definition (n=32)
| Substantive component of the retirement definition | Number of models |
|---|---|
| Benefit take-up | 3 |
| Transition out of employment | 4 |
| Benefit take-up Transition out of employment | 24 |
| Unknown | 1 |
| Total | 32 |
-
Source: own elaboration
The definition of retirement in the reviewed MSM is purely operational, with only two substantive elements present from the several identified by the literature: benefit take-up and transition out of employment. 24 models assume the two to be inextricably linked: a (sometimes partial) transition out of the labour market and into retirement implies, by definition, the take-up of benefits, which may reflect the European pension regimes, in which old-age pensions are often nearly universal.13 A minority of models (8) focus on only one of these elements. There is a clear difference in the literature (cf. supra), where self-perception is widely used. This seems logical, as self-perception is more challenging to model in an MS context where administrative data are often used as sources than in the econometric and sociological studies of retirement, which often use small-scale survey data. The widespread use of the benefit take-up element should not be surprising either: most of the MSM surveyed were built to study the budgetary aspects of pensions.
A second relevant feature is the analytical level at which the retirement decision is taken. The vast majority of the surveyed models opt to model the retirement decision at the individual level, as shown in Table 3.
MSM modelling retirement by level at which the retirement decision is made (n=32)
| Level at which the retirement decision is made | Number of models |
|---|---|
| Individual | 30 |
| Household | 1 |
| Individual with possibility of analysing the household level | 1 |
| Total | 32 |
-
Source: own elaboration
Two models employ the analytical household level: the British NIBAX calculates a utility maximisation function per household, and the Italian CAPP-DYN provides the possibility of calculating transition probabilities at the household level. It should be noted, however, that several models consider the partner’s behaviour as a factor in determining the retirement decision (cf. infra).
The third feature of the analysis displays a similar convergence (see Table 4): most models treat retirement as an absorbing state. A regional fault line is present here: only one European model (the Danish SMILE) assumes that individuals may return to work after retiring. The rest of the MSM in which retirement is not an absorbing state are North-American or Australian (DYNAMOD, DYNACAN, DYNASIM3, MINT7). For two of them (DYNASIM3 and DYNACAN), which see retirement solely in terms of benefit take-up, the individual’s position in the labour market seems to be fully decoupled from the retirement status.
MSM modelling retirement by treatment of retirement as an absorbing state (n=32)
| Retirement as an absorbing state | Number of models |
|---|---|
| Yes | 23 |
| No | 5 |
| Unclear | 4 |
| Total | 32 |
-
Source: own elaboration
Of the 23 MSM considering retirement an absorbing state, a majority (20) are European, and six hail from Australia, Canada, and the US (PENSIM, SIMUL, Lifepaths, APPSIM). For three models (the Finnish ELSI, the Irish Dynamic Cohort Microsimulation Model, and the Italian DYNAMITE), it is not clear whether they regard retirement as irreversible or not.
As pointed out above, an issue closely related to the conception of retirement as an absorbing state is its separate conceptualisation from other labour market decisions, as displayed in Table 5. Retirement may be considered to be a specific decision or a part of the labour market supply (and thus indistinguishable from earlier transitions from employment into inactivity) (cf. supra, Section 2.1).
MSM modelling retirement by relationship with other labour market decisions (n=32)
| Relationship with other labour market decisions | Number of models |
|---|---|
| Separate | 26 |
| Part of labour market supply | 5 |
| Unknown | 1 |
| Total | 32 |
-
Source: own elaboration
The regional division is similar to that above: most models treat retirement as a separate transition, only available to those satisfying specific eligibility criteria (age, employment history).14 All five models that regard the retirement decision as part of the regular labour market supply (and thus indistinguishable from earlier transitions in and out of the labour market) are Anglo-Saxon (the Australian DYNAMOD, the Canadian DYNACAN, Lifepaths and SIMUL, and the American DYNASIM3).15 Even though a comprehensive analysis of the models’ institutional background is outside the scope of this review, it is remarkable that these countries fall within Esping-Andersen (2012) liberal category of welfare regimes within his typology.16
The modelling of retirement as a separate decision has further implications for the techniques used to calculate the distribution of the transition probabilities to retirement. An overview of those techniques is provided in Table 6.
MSM modelling retirement by relationship with other labour market decisions and origins of transition probabilities (n=32)
| Origins of transition probabilities’ distribution | Relationship with other labour market decisions | Total | ||
|---|---|---|---|---|
| Part of labour market supply | Separate | Unknown | ||
| Distribution estimated from statistical equation | 5 | 15 | 20 | |
| Distribution from observed data | 4 | 1 | 5 | |
| Distribution from another simulation model | 3 | 3 | ||
| User-defined distribution | 2 | 2 | ||
| Unknown | 2 | 2 | ||
| Total | 5 | 26 | 1 | 32 |
-
Source: own elaboration
There is a clear division in the calculation of transition probabilities along the lines of the relationship between retirement and other labour market decisions. All five MSM modelling retirement with other labour market supply decisions use probabilities estimated by statistical equations developed within the model. However, the variables they include differ strongly from model to model. DYNAMOD (King et al., 1999) includes macroeconomic data, information on current and past labour force state, and personal characteristics. LifePaths includes variables similar to DYNAMOD, plus duration of unemployment, province of residence, ages of children, the spouse’s employment status, time trends, and seasonal patterns of employment (Spielauer et al., 2013)
The most complex equation is found in the Canadian SIMUL model (specific to the Quebec province), in which the independent variables are gender, age (three indicators), children between 0 and 5, lagged income, the interaction between marital status and age, marital status, education, province, retirement income, and worker type (defined by another simulation module) (Bissonnette et al., 2016).
Also, three models (DYNACAN, DYNAMOD, DYNASIM3) estimate separate equations for different population groups, e.g. by gender, marital status, race or age (Favreault and Smith, 2004; King et al., 1999; Morrison and Dussault, 2000). SIMUL (Bissonnette et al., 2016) models the entry and exit to the labour market separately.
The models treating retirement as a separate decision calculate their transition probabilities using four methods. Most (15) use statistical equations developed within the models (mainly logit, cf. infra). Five models replicate observed distributions from empirical data, three adopt distributions estimated by other models, and two leave it to the user to define the transition probabilities themselves. For two models (the Norwegian MOSART and the Hungarian NYIKA), how the transition probabilities are calculated is unclear from the documentation.
4.2 Detailed model analysis
This section presents the main results from the detailed analysis of those models that treat retirement as a separate labour market decision. Subsequently, the analysis discusses the basic features of the models and their theoretical approaches, the variables they use, and their methodological techniques. Short discussions on validation and alignment are also provided.
The models' basic features, with the exception of the variables (cf. supra), are set out in Table 7.
Basic features of dynamic probabilistic MSM assessing retirement as a separate labour market decision
| Source | Country | Name of model | Sample size (approximate) | Population categories | Data source | Theoretical framework | Method of calculation of transition probabilities | Source of parameters for the calculation of transition probabilities | Number of statistical equations | Validation | External alignment |
|---|---|---|---|---|---|---|---|---|---|---|---|
| Harding et al., 2009 | Australia | APPSIM | 188000 individuals | Australian population | Survey | No information provided | Logit | Historical survey data | 2 M/F) | Validation strategy, comparison with existing data | Optional, for total labour force participation |
| Debrand et al., 2012 | France | ARTEMIS | 1420598 | French private-sector employees | Administrative and survey | No information provided | Probabilities assigned from empirical distribution | Distribution of 1935 cohort | No equations estimated | No information provided | No information provided |
| Mazzaferro and Morciano (2012) | Italy | CAPP-DYN | 52772 individuals | Italian population | Survey | Option-Value model | Optimisation equation | No information provided | 1 | No information provided | Not for retirement, only for demographic variables |
| Belloni and Alessie, 2009; Borella and Moscarola, 2010 | Italy | CERPSIM3 | No information provided | Italian population | Administrative and survey | Reduced-form econometric model | Probit | Historical administrative data | 2(M/F) | Cross-sectional validation with available data | No information provided |
| Bachelet et al., 2014; Blanchet et al., 2011; Buffeteau et al., 2011 | France | DESTINIE II | 65000 individuals | French population | Survey | Reduced-form model (baseline) | Logit (baseline) Optimization equation (application) | Historical administrative data | 2(M/F) | No specific information on validation of retirement decision | Not for retirement, only for demographic variables (alignment by adjustment of probabilities) |
| Ando and Nicoletti Altimari (2004) | Italy | DYNAMITE | 25000 individuals per wave, 67000 households in total | Italian households | Survey | Reduced-form econometric model | Ordinary Least Squares Continuous hazard model as an option | Historical survey data | 2 (planned age for everyone and revised decision for older workers) | No information provided | Not for retirement, only for demographic variables |
| Nataša Kump, personal communication, 2019, 2022 | Slovenia | DyPenSI | 391425 individuals | Slovenian population | Administrative and survey | Reduced-form econometric model | Logit | Starting population | 2 (M/F) | Comparison with alignment tables | Optional alignment for labour market |
| Patxot et al., 2018 | Spain | DyPeS | Unknown | Spanish population | Administrative | Reduced-form econometric model | Hazard model | Historical administrative data | 2(M/F) | No information provided | No information provided |
| Tikanmäki et al. (2014) | Finland | ELSI | 250000 | Adult Finnish population | Administrative | No information provided | Probabilities assigned from another model | PTS macro model | No information provided | Sample-testing and model calibration with register data from 2009-2013 | All transition probabilities are updated yearly according to projections from a semi-aggregate model |
| Brewer et al., 2007 | UK | IFS Model | 12100 individuals | British population over 50 | Survey | No information provided | Logit | Starting population | 4 (M/F, full/part-time) | Retroactive simulations are compared to existing data. | For total labour force participation; alignment with observed data by adjusting probabilities |
| O’Donoghue et al. (2009) | Ireland | Irish Dynamic Cohort Microsimulation Model | 1000 | Synthetic cohort | Simulated | No information provided | Probabilities assigned from empirical distribution | Cross-sectional Irish survey data | No equations estimated | Comparison with survey and administrative data | No information provided |
| Maitino et al. (2020) | Italy | IrpetDin | No information provided | Italian citizens | Survey | No information provided | Optimisation equation | Assumption | 1 | Retroactive simulations are compared to existing data | For total labour force participation |
| Richiardi and Richardson, 2017 | Multi-country | JAS-mine Labour Force Participation | No information provided | Citizens from Italy, Spain, Ireland, Hungary and Greece | Survey | No information provided | Probabilities assigned from empirical distribution | Starting population | No equations estimated | No information provided | No information provided |
| Leombruni and Richiardi, 2006 | Italy | LABORSim | 50000 | Italian population | Survey | No information provided | User-defined | User-defined | User-defined | No information provided | Not for retirement, only for demographic variables |
| Richiardi and Richardson, 2015 | UK, Italy | LABSim | Unknown (112196 observations in regression analysis for IT, 84028 for UK) | UK and IT population | Survey | No information provided | Logit | Unclear | 2 per country (partnered/single) | No information provided | Not for retirement, only for demographic variables |
| Federaal Planbureau (2017) | Belgium | MIDAS | 305019 | Belgian population | Administrative | No information provided | Probabilities assigned from another model | MALTESE meso model | No equations estimated | Stylised validation through modelling (Dekkers) | Retirement is aligned with MALTESE projections |
| Smith et al., 2007; Smith and Favreault, 2013 | US | MINT7 | 82782 individuals | US population | Survey | Reduced-form econometric model | Probit | Historical survey and administrative data | 2 (married/unmarried) | Retroactive simulations are compared to existing data | Not for retirement, only for other variables |
| Fredriksen and Stølen, 2015; Fredriksen (1998) | Norway | MOSART | 40000 | Norwegian population | Administrative | No information provided | No information provided | Past retirement patterns | No information provided | Retroactive simulations are compared to existing data | No external alignment |
| van de Ven, 2011 | UK | NIBAX | No information provided | Synthetic cohort | Simulated | Structural model | Utility maximisation functions | Assumption calibrated by survey data | No information provided | Retroactive simulations are compared to existing data | Structural parameter calibration using survey data |
| Gal et al., 2009 | Hungary | NYIKA | 6000000 | Hungarian pension contributors | Administrative | No information provided | No information provided | Past retirement patterns | No equations estimated | No information provided | No information provided |
| Holmer et al., 2016 | US | PENSIM | Not fixed | Synthetic cohort | Simulated | Reduced-form econometric model | User-defined | User-defined | User-defined | Retroactive simulations are compared to existing data, and cross-sectional validation with other models | No information provided |
| Berteau-Rapin et al., 2015 | France | PRISME | 5000000 individuals | Persons affiliated with French social security | Administrative | No information provided | Logit | Starting population | 46[2] (M/F, age - by trimester) | Retroactive simulations are compared to existing data. | No information provided |
| van Sonsbeek, 2011 | Netherlands | SADNAP | Unknown (1% of the Dutch population) | Dutch population | Administrative | Option-Value model | Optimisation equation | Assumption based on theoretical literature | 1 | Cross-sectional validation with available data and other models (not necessarily MS) | Not for retirement, only for demographic variables |
| Flood et al., 2012 | Sweden | SESIM III | 300000 individuals | Swedish population | Administrative and survey | Reduced-form econometric model | Logit | Starting population | 1 | No information provided | Not for retirement, only for other variables |
| Caretta et al., 2013 | Italy | TDYMM | 43388 | Italian population | Administrative | No information provided | Probabilities assigned from empirical distribution | Starting population | No equations estimated | Retroactive simulations are compared to existing data | Not for retirement, only for labour market modules |
| Duc et al., 2015 | France | TRAJECTOIRE | 350000 | French pension contributors | Administrative | No information provided | Probabilities assigned from another model | PROMESS cell-based model | At least 12 (by sex, country of birth, generation, insurance duration, and contributing regime) | Retroactive simulations are compared to existing data | In some cases, the results of the transition probabilities are aligned with the PROMESS meso-model |
-
Source: own elaboration
The geographical distribution of the models is the same as in the main analysis, save for the absence of those Anglo-Saxon and Danish models which feature the retirement decision together with other labour market decisions (cf. supra). Most models use starting populations originating from observed data, and only three models (the Irish Dynamic Cohort Microsimulation Model, NIBAX and PENSIM) rely on simulated populations. The use of administrative and survey data is almost evenly distributed among those MSM with observed starting populations. Four models use a combination of both sources. Large samples representative of the national populations are nearly pervasive, although there may be restrictions regarding age, e.g. only citizens in the working age groups may be included. A smaller sample is used by the IFS model (UK). For six models (IrpetDin, JAS-mine Labour Force Participation, DyPeS, LABSim, SADNAP and CERPSIM3), the exact sample size is unknown, although one of them (SADNAP) uses a 1% sample of the Dutch population.
The modelling of retirement within MSM seems to be guided by empirical considerations and data availability rather than inspired by theoretical discussions. The large majority of the models refer only briefly to the econometric literature on reduced-form models. Extensive theoretical argumentations evaluating the pros and cons of different econometric retirement paradigms are in most cases absent from model documentation, except for DyPeS, CERPSIM3, and PENSIM. For DyPeS, the developers (Patxot et al., 2018) underline the trade-off between theoretical complexity and practical feasibility, and attempt to balance both elements by embedding their survival approach into the US tradition of reduced-form econometric models. CERPSIM3 (Borella and Moscarola, 2010) is entirely based on previous theoretical work (Belloni and Alessie, 2009), and PENSIM (Holmer et al., 2016) reflects upon the trade-offs between structural and reduced-form models. The documentation of four models (LABSim, IFS model, PRISME and SESIM III) does not explicitly address theory but concentrates on the MSM literature.
Three models (SADNAP, CAPP-DYN, and DESTINIE II in its application phase) develop transition probabilities framed within the Option Value model (cf. supra). They use a reduced-form variant, in which the model’s parameters (discount rate, leisure preference, and risk-averseness) are exogenously defined. In SADNAP, (van Sonsbeek (2011) imports distributions of the parameters from the literature and generates the option value for each decision year. The retirement year is chosen for which the option value displays the maximum value. The Option-Value application of DESTINIE II uses a similar approach, with two of the parameters following a log-logistic distribution.
As discussed above (cf. Table 6), a further classification of models refers to the methods used to calculate the transition probabilities. The MSM under analysis fall into three groups: those sourcing their transition probabilities from existing distributions, those calculating those probabilities as part of the model, using regressions, and those that leave it to the user to input the transition probabilities from an unspecified source. The first group sources the probability distributions from either other models or empirical distributions. The (often) logistic regressions in combination with a stochastic element determine the a priori risk of the event happening, and the alignment tables determine the number of events actually happening. The Belgian MIDAS model uses alignment-by-sorting based on another model. It first estimates the number of pensioners by importing the transition probabilities from the MALTESE system of meso-economic models (Dekkers et al., 2015a; Dekkers et al., 2015b; Fasquelle et al., 2012).17; These probabilities are defined by recent retirement behaviour and historical participation rates (Dekkers et al., 2015a; Dekkers et al., 2015b) and make distinctions along the gender, age, pension scheme and socio-economic category variables. The MIDAS population is then sorted according to the probabilities. The alignment happens by "retiring" the same percentage of individuals who are retired in the MALTESE model from the sorted population.
The French TRAJECTOIRE inputs its transition probabilities from the PROMESS meso-economic model. PROMESS defines the transition probabilities from administrative data by logit equations incorporating sex, country of birth, generation, duration of contributions until 54, salary quartile, and regime of affiliation (Duc et al., 2015).
In a related approach, the Finnish ELSI model inputs the retirement transition probabilities from the PTS macro-model for demographic projections, but it seems no alignment technique is used, as results may differ between the two models (Tikanmäki et al., 2014).
A different approach is to import the probability distribution from observed data, whether from the base population or earlier cohorts. The French ARTEMIS does this by inputting the distribution of new retirees by age from a previously-observed, earlier cohort (the one from 1935) to the model. It does so separately for men and women between 60 and 65 years (Debrand et al., 2012). The Irish Dynamic Cohort Microsimulation Model (O’Donoghue et al., 2009) and the Hungarian NYIKA are based on earlier data as well, although it is unclear from the available information how concrete operationalisation takes place. The Italian T-DYMM imputes the transition probabilities from the base population, taking into account the level of expected benefits and the replacement rate (Caretta et al., 2013).
The second group of MSM uses four techniques. There is a clear preference for logit models (7), followed by probit (3). There is one discrete and one continuous hazard model, which regards decisions as shaped by time, and two optimisation equations in which the individual retires once a specific condition is reached (cf. supra, Stock and Wise). One model uses linear regression techniques.
It is worth noting the similarities and differences across approaches. All exponential models (logit, probit, hazard) are slightly different ways of modelling nonlinear relationships between binary outcomes (retirement decisions) and their predictors. Whereas the probit model uses the standard normal cumulative distribution function (CDF) as the basis to rescale probabilities, logit models use the logistic CDF. They produce similar results, but the latter technique is often preferred because of the more straightforward interpretation of its estimates (i.e. odd ratios). The discrete hazard model used by DyPeS aims to calculate the time until an event (the retirement decision), and it essentially amounts to a series of logit models for which a time variable held constant within each logit dictates the baseline hazard. The continuous hazard model allows the modelling of hazards in a single equation, but relies on additional assumptions regarding the shape of the baseline hazard across time.
The OLS model and the Option Value model’s optimisation equations in SADNAP, DYNAMITE, and CAPP-DYN stand somewhat separate from the rest, as they do not calculate the probabilities of transitioning to retirement, but rather assign each individual a retirement age. In the OLS model, the individual retires whenever he or she reaches the predicted age.
The optimisation equations used by the Option Value model periodically calculate the costs and benefits of retiring within a certain period and choose the age for which the cost-benefit ratio is maximised.
The analysed models produce a one-off estimation of the decision to retire, whether as one or several equations (cf. infra). There are, however, three exceptions: the French DESTINIE II, the Italian MSM DYNAMITE, and CAPP-DYN.
DESTINIE II is composed of two entirely separate modules, each of which considers the decision to retire as not fixed. The first module models the transition probability based on a logit estimation calculated separately for men and women. The module does not produce any results, but the career trajectories exist only at the potential level (i.e. to create a kind of baseline). The second module simulates retirement behaviour based on parameters containing information about the labour market, demography, and retirement legislation and allows for several variations (Buffeteau et al., 2011, p. 105).
The separation between a “baseline” and a further retirement decision may also be seen, albeit in a more rigid form, in the Italian DYNAMITE model. First, an initial retirement decision is made for all entrants in the population’s labour force, using age-invariant characteristics (year, cohort, education, occupation, sector, region, head of household, economic incentives). In a second estimation, the decision may be revised after the worker turns 50 using other variables (family wealth, dependents, marital status, number of earners in the household, partner’s economic incentives).
The Italian CAPP-DYN model introduces the possibility of reviewing the decision as well. For all individuals having fulfilled the institutionally defined eligibility criteria, a first "reaction function" is estimated based on Stock and Wise’s model (cf. infra). Then, a second reaction function finetunes the adequacy of the pension benefit. It uses the replacement rate (i.e. the ratio between pension benefits and the last wage at a specific time) as a constraint. If the replacement rate’s value is below a user-defined threshold, retirement is postponed until the individual reaches adequacy.
The variable configurations used by the MSM that apply statistical modelling (logit, hazard modelling, optimisation equations, probit, OLS) are displayed in Table 8. The control variables used by the Option-Value models are included for completeness.
Explanatory variables in MSM assessing the retirement decision using an equation
| Variable | n | Models |
|---|---|---|
| Birth cohort | ||
| Birth cohort | 3 | Dynamite, CERPSIM3, MINT7 |
| Demographics | ||
| Age | 6 | APPSIM, DESTINIE II, IFS, DyPeS, MINT7, LabSIM |
| Education | 10 | APPSIM, PRISME, DESTINIE II, DYNAMITE, IFS, DyPeS, SESIM III, MINT7, DyPenSI, LabSIM |
| Gender | 4 | SADNAP, SESIM III, MINT7, LabSIM |
| Marital status | 3 | APPSIM, DYNAMITE, IFS |
| Origins | 2 | PRISME, MINT7 |
| Race of spouse | 1 | MINT7 |
| Employment history | ||
| Career length | 1 | DESTINIE II |
| Past illness, inactivity, part-time employment or unemployment | 3 | APPSIM, PRISME, DESTINIE II |
| Employment-related variables | ||
| Employment status (employed, unemployed, sick leave, fragmented employment, disability, self-employed) | 5 | PRISME, DyPeS, MINT7, DyPenSI, LabSIM |
| Unemployment benefits | 1 | DyPeS |
| Economic incentives | ||
| Accrual | 1 | SESIM III |
| Expected Social Security Wealth | 1 | DYNAMITE |
| Internal Rate of Return | 1 | DYNAMITE |
| Net Present Value | 1 | SESIM III |
| Option Value | 3 | DESTINIE II, SADNAP, CAPP-DYN |
| Peak Value | 2 | CERPSIM3, DyPeS |
| Potential benefits | 1 | DyPeS |
| Replacement rate | 3 | SADNAP, DyPeS, MINT7 |
| Social Security Wealth (SSW) | 1 | CAPP-DYN |
| Value of benefits | 1 | CERPSIM3 |
| Geographic factors | ||
| Region | 3 | DYNAMITE, CERPSIM3, LabSIM |
| Health | ||
| Health status | 3 | APPSIM, IFS, MINT7 |
| Disability status | 1 | LabSIM |
| Household-related variables | ||
| Age difference with spouse | 1 | MINT7 |
| Age of spouse | 1 | MINT7 |
| Contribution history of spouse | 1 | MINT7 |
| Dependents | 2 | DYNAMITE, MINT7 |
| Employment status of spouse | 4 | SESIM III, MINT7, DyPenSI, LabSIM |
| Spouse reached pension age | 1 | LabSIM |
| Spouse disability status | 1 | LabSIM |
| Head of household | 1 | DYNAMITE |
| Household composition | 1 | SESIM III |
| Income earners in the household | 1 | DYNAMITE |
| Income of spouse | 1 | MINT7 |
| Macro variables | ||
| Unemployment rate | 1 | DyPeS |
| Pension-related variables | ||
| Age at maximum pension | 1 | DyPeS |
| Coverage | 1 | MINT7 |
| Duration of coverage or contributions | 2 | PRISME, MINT7 |
| Eligibility conditions | 2 | DyPeS, MINT7 |
| Insurance in more than one regime | 1 | PRISME |
| Time to maximum pension | 1 | DyPeS |
| Reached pension age | 1 | LabSIM |
| Wealth and income | ||
| Current income | 4 | DyPeS, SESIM III, IFS, LabSIM |
| Family wealth | 1 | DYNAMITE |
| Homeownership | 1 | MINT7 |
| Past income | 2 | DESTINIE II, MINT7 |
| Ratio financial wealth/past income | 1 | MINT7 |
| Wealth | 1 | MINT7 |
| Work characteristics | ||
| Occupation | 2 | DYNAMITE, CERPSIM3 |
| Sector | 3 | DYNAMITE, CERPSIM3, DyPenSI |
| Time dimension | ||
| Year | 2 | DYNAMITE, IFS |
| Continuous time | 1 | DYNAMITE |
| Other | ||
| Inverse Mill’s ratio from probit estimate of being in the labour force | 1 | DYNAMITE |
-
Source: own elaboration
The variables are organised into 52 generic categories and 14 groups.18 Despite the wide variety, a few common trends may be discerned. First, there is a prevalence in the use of individual characteristics. The use of demographic variables (sex, age and education) is pervasive across all models. Two of the models (CERPSIM3 and DYNAMITE) do not include an education variable, but they do contain occupation (blue/white collar, clerk/manager), which might be regarded as a proxy for the individual’s educational level.19
Other demographic variables, such as marital status, origins, and spouse’s race, are used to a lesser extent. The absence of migration-related variables in the European models is conspicuous, as it has long been established in the literature that immigrants display different retirement patterns than native populations (cf. supra). Moreover, the requirement of a minimum career length in the country to access retirement benefits may mean that first-generation immigrants may be excluded from retirement before the standard retirement age. The absence of these variables may be related to the long-standing reluctance of some European countries (e.g. France, Belgium) to collect and report data related to ethnicity (Jacobs et al., 2009),20 which has started to wane only in the last decade. Attitudinal variables do not appear in the models either.
Health status or disability is only used by the Anglo-Saxon models (APPSIM, IFS, MINT7, LabSIM).
Second, most models contain financial variables. The financial components often refer to future or current wealth and income. Third, time is taken into account by six models. DYNAMITE and IFS include year dummies, and the three models using a hazard function (CAPP-DYN, SADNAP, DYPES) are by default embedded in a time dimension.
Fourth, most variables are situated at the micro-level. There are only a few models that use institutional variables such as pension-related variables, including pension coverage, duration of coverage and eligibility,21 and variables at the macro-level (geographic regions, unemployment rate).
The models cannot be situated within the push and pull factor classifications that dominate the socio-economic literature on retirement, because MSM mainly use socio-economic and socio-demographic variables measured at the individual level, as opposed to the more complex attitudinal variables and organisational-level variables needed for the push and pull factors framework (cf. supra).
The data used to operationalise the techniques and variable configurations mentioned above does not necessarily originate within the starting population. Several models (six) use a historical survey or administrative data, and four calculate the probabilities from the starting population. As for the three models using the optimisation equations framework (IrpetDin, SADNAP, NIBAX), the parameters are defined by assumption. SADNAP obtains these parameters from the existing literature, while NIBAX calibrates its assumptions using survey data.
The number of estimations produced using statistical equations varies visibly. Half of the models incorporate the gender dimension by estimating two separate equations, assuming that male and female retirement dynamics are too different to be modelled together. MINT7 explicitly rejects this approach, because a combined model gives stronger results and more robust estimates than separate models. Moreover, more recent cohorts display similar career patterns for men and women, at least in the US. Hence, MINT7’s estimations only distinguish married from unmarried people in their default configuration and offer separate gender models as an option (Smith et al., 2007).22
The Swedish model produces a single estimation, in which gender is one of the variables. Likewise, the Italian DYNAMITE model includes both men and women in the same equation, but produces the estimation in two steps (cf. infra, Box 2). The UK IFS Model provides four estimations, organised by gender and full- or part-time work. The Slovenian DYPENSI produces separate estimations for men and women and models the choice to work longer to include the partner’s retirement behaviour in the model without violating the statistical assumption of independent observations.
Those MSM using the Option-Value approach (cf. infra) produce a single estimation, as the approach does not calculate separate coefficients for men and women.
Finally, the French PRISME produces no less than 46 estimates for the retirement decision based on gender and age (separate transition probabilities are estimated for each trimester between 60 and 65.25 years). Moreover, early retirement and the non-take-up of pensions (not included in this overview) are modelled separately, increasing the total number of estimations to more than 70.
The concrete way the estimation is run is straightforward: transition probabilities are calculated for each observation and combined with a Monte Carlo simulation technique. The internal validity of the calculated transition probabilities is assessed first through significance tests, which are provided together with the models' estimates. External validation poses specific challenges. The standard measures used by the retirement literature (such as R2 or pseudo-R2) are seldom reported: the fit of the model is assessed in three cases (CERPSIM3, DYNAMITE, MINT7) using statistical criteria (R-square coefficients, Wald tests, log-likelihood). This limited use is not unusual. These coefficients may perform poorly in MSM and lose their meaning because the variables used in MSM are, by definition, endogenous to the model and do not capture the same theoretical breadth as studies unconstrained by simulated data.
There are, however, several other ways of validating the data. For instance, validation within APPSIM focuses on data, coefficients and parameters within and across modules and uses cross-sectional and longitudinal data as references (Harding et al., 2009). Cross-sectional data is also used by CERPSIM3 and SADNAP, which compares its findings with other (cross-sectional) studies. The French model DESTINIE II benchmarks its results against other MSM’s, Other models (PRISME, IFS, MINT7, ELSI, TRAJECTOIRE, the Irish Dynamic Cohort Microsimulation Model, T-DYMM) use retroactive simulations that they compare with the available longitudinal data. Theoretical modelling techniques are another option: one study validates MIDAS using stylised modelling, in which the results are compared to the outcome of simple standard simulation models to respond to the criticism of MSM as a "black box" (Dekkers, 2010). Conversely, the Finnish ELSI has been the subject of complex techniques such as trajectory analysis and sequencing (Salonen et al., 2020; Salonen, Tikanmäki, and Nummi 2019).
Another way of validating a retirement model is by comparing its results with the results of ex-post alignment. Alignment changes the transition probabilities or the models' results to fit some external constraint23 (cf. supra, MIDAS model). It can be accomplished via several techniques (Li and O’Donoghue, 2015): multiplicative scaling, sidewalk shuffle, Central Limit Theorem Approach, sorting methods, et cetera. The source from alignment may be observed data (for retroactive projections) or other simulation models (Dekkers et al., 2015a; Dekkers et al., 2015b; Dekkers, Inagaki, and Desmet 2012).
Simulation results after alignment can be compared with unaligned simulated results to verify the presence of anomalies that might point to possible mistakes in the estimates (Harding et al., 2009). These comparisons are being widely used in the ongoing validation process of the DyPenSI model, in which successive versions of a behavioural equation for retirement have been compared to alignment tables drawn from the projections underpinning the Ageing Report, which was produced by the Economic Policy Committee’s (EPC) Working Group on Ageing Populations and Sustainability (AWG) in order to track substantial deviations from those targets.
Besides APPSIM, the use of alignment for validation strategies is not reported in the MSM’s documentation. Otherwise, the use of alignment as an improvement mechanism for the results of retirement estimations is not generally used in the studied models, although it is widely present in demographic modules. There are a few exceptions. The transition probabilities in MIDAS (cf. supra), ELSI and PROMESS are by default aligned with other models. The IFS Model applies alignment by sorting (cf. supra, MIDAS model), in which people are moved from one category of the labour force to another in the order of their transition probabilities until the simulation results have been aligned to historical survey data. APPSIM offers optional alignment with labour force participation statistics but goes a step further by introducing some stochasticity: it selects a proportion of people for whom transition probabilities are inverted, and then applies alignment by sorting (Harding et al., 2009). DyPenSI offers optional alignment too (Nataša Kump, personal communication, 2019, 2022).
Alignment within MSM is not an uncontroversial procedure. On the one hand, Richiardi and Richardson (2017, p. 121) point out that "In general, the (…) assumption [on which the case for using alignment rests] is very dangerous and unwarranted, and alignment should be looked at with great suspicion". Therefore, it may be seen as detrimental to a model’s methodological quality. On the other hand, if appropriately used as an alternative scenario in validation strategies, it can help to identify flaws in the estimations, as in the case of DyPenSI. Four arguments justify the case for alignment. First, the long simulation periods for which transition probabilities are calculated are based on either cross-sectional or short panels, requiring some correction for a changing context. Second, if the transition probabilities produced by logit or probit regression models are far from the centre of the distribution, the simulation may produce poor results, creating a need for tweaking. Alignment makes this tweaking explicit. It is moreover efficient because it allows to incorporate tacit knowledge that otherwise remains out of reach. For example, if a certain technique is better at modelling certain phenomena than MSM, alignment may be used as a vehicle to incorporate it into a MSM model. Third, alignment helps to provide a consistent message to policy makers and other stakeholders dealing with different models.
5. Concluding remarks
This article started with two research questions: 1. Which theoretical and methodological approaches from the scientific literature on retirement are used in MSM? and 2. What is the theoretical and methodological quality of those models? It subsequently attempted to answer those questions by conducting a general analysis of 32 MSM and a more detailed assessment of 26 MSM. This section summarises the main insights from the analysis, guided by the questions.
Retirement MSM seem to be well embedded within the econometric tradition of the retirement literature, as implied by the conceptualisation set out in the first part of the analysis: they define retirement almost uniformly in terms of benefit take-up and transition out of the labour market as opposed to self-perception. Moreover, retirement is an absorbing state, and the retirement decision is made at the individual level, reflecting a mainly economic analytical framework.
The second part of the analysis confirmed the above finding: all MSM apply reduced-form econometric models, whether generic or based on the Option Value model, and their main argumentation is often concerned with the technicalities of that reduced model (definition of retirement as an absorbing state, data selection, and number of estimations).
Consequently, some of the elements from the broad retirement literature are conspicuous in their absence. First, there is little information on the broader theoretical reflections underpinning the election of a particular model or variable, so it is impossible to know whether such reflections took place during the model development phase or not. Second, theoretical frameworks outside econometric approaches are absent from the analysed retirement MSM. The push and pull framework is not present, and some variables that the non-econometric literature has thoroughly explored are nearly or altogether absent (health, migration, attitudinal variables),24 although the desirability of their inclusion is questionable (cf. infra). Likewise, the modelling of decisions at the household or couple level is limited, even though the role of partners (mainly men) has been documented in fundamental retirement research (cf. supra). Household modelling may be relevant for those models drawing on the Option Value, where the individual’s retirement decision takes place in a vacuum. Within the MSM literature, the work of Li (2011:201–30) models retirement at the household level within a structural model that allows testing the influence of policy changes on retirement decisions.
The methodological tools used to assess the retirement question also seem somewhat similar across MSM: they all use broad populations from similar sources, and following their theoretical embedding in econometric models, logit and probit seem nearly prevalent along with the Option Value’s optimisation equation. The validation strategies also seem comparable, as is the cautious use of results alignment.
Validation is, however, crucially different from the mainstream retirement studies: in the absence of the coefficients of fit used by the traditional retirement literature as touchstones to probe the external validity of models, the use of alignment tables for validation, whether based on projections or existing data, is crucial to MSM.
The above makes an evaluation of the analysed MSM’s theoretical and methodological quality fairly straightforward: even though the analysed models are all rooted in sound research traditions and rigorously document their technical aspects (e.g. population and databases, calculation of transition probabilities), there seems to be little connection with the research landscape outside econometrics. Retirement MSM might be classified as a niche within the econometric study of retirement. This is logical, as its aims (i.e. informing policy-making) are essentially different from fundamental academic research. Moreover, data constraints may reduce the feasibility of complex theoretical models and render deep theoretical reflection redundant (Patxot et al., 2018). The addition of attitudinal variables or health, for instance, would amount to a function of covariates such as gender, age or education, which are already part of the basic behavioural equations, without rich data sources. Therefore, they would not add any new information to the simulation and just increase the model’s complexity. Therefore, there seems no reason to include them in MSM.
Nevertheless, there are some opportunities for cross-fertilisation. Throughout the past decennium, large databases (administrative, survey) have become available, which may open new opportunities for future microsimulation models. The advances of the retirement literature may inform future variable choices. Moreover, the need to model institutional changes, such as the evolution of some European regimes from state pensions to multi-pillar retirement regimes, may also benefit from existing fundamental research.24 Empirical developments such as the upcoming trend of working retirees across the European Union and the phasing-out of early retirement schemes should also find a way into MSM’s conceptualisation of retirement. New methods, such as multi-level analysis or machine learning, and modelling retirement as a couple’s decision, may offer some inspiration to MSM.
Here, it should be noted that complexity in the calculation of transition probabilities does not imply, by definition, an improved methodological quality. Using sophisticated models such as Option Value may not offer many advantages to other methods if it is completely disconnected from the institutional setting. In this sense, simpler models based on meeting eligibility requirements may be more attractive in a European context, where retirement often occurs as soon as those requirements are met. Fundamental research on changes in retirement preferences regarding retirement planning in the European population (Van Rooij et al. (2009)) may inform MSM practice too.
The above conclusions merit a warning: they are drawn based on a relatively limited population of retirement MSM. This is related to the fragmented nature of model documentation encountered throughout the analysis. Model information is often scattered across several documents, and the quality of the information provided by those documents differs strongly across models. It is, therefore, difficult to assess the presence of some elements.
The above leads us to a final issue: notwithstanding the existence of a lively international network encompassing microsimulation scholars, there still seems to be space to produce an encompassing reflection that goes beyond cataloguing and categorising existing models. A common MSM repository with uniform reporting standards, such as the one currently being tested in the context of the INGRID/2 project (https://www.liser.lu/?type=news&id=1745) might be helpful in this context.
Footnotes
1.
Pensions are interpreted here exclusively as a late-career benefit, which does not necessarily overlap with the decision to withdraw from the labour force. See section 2.1 and the discussion following Table 2.
2.
Even though, as stated above, this overview is restricted to the economic and sociological literature, it is worth noting that the psychological literature may conceptualise retirement as decision-making, an adjustment process, or a career stage (Wang and Shultz, 2010; Wang and Wanberg, 2017). This conceptualisation further puts the "absorbing state" notion into perspective.
3.
This review is based on Section 2.1 of Garibay et al. (2022).
4.
It should be noted that this classification is somewhat arbitrary, as articles belonging to the second category might as well belong to the reduced form econometric models. There are, however, two reasons to classify them separately. First, the "socio-demographic" models do not explicitly address the debate with structural models. Second, even if the variables they use overlap with reduced-form models, their theoretical justification stems from different theoretical frameworks. These two factors seem to justify their classification as separate categories at first sight. For a comprehensive classification and description of the theoretical corpus, see Wang and Shultz (2010) subcategorisation of "retirement as decision-making" into rational choice theory, image theory, role theory, planned behaviour theory and expectancy theory.
5.
This feature is shared by the policy interventions reviewed using Campbell Collaboration standards.
6.
Gijs Dekkers (Federaal Planbureau, Belgium) and Martin Spielauer (Austrian Institute of Economic Research).
7.
Richard Jay Morrison and two anonymous Human Resources and Social Development Canada experts.
8.
It should be noted, however, that the more or less uniform retirement patterns seem to be changing as increasing numbers of retirees remain at work (cf. supra).
9.
Several models were excluded in which retirement is assumed to occur at a certain age without further modelling. How this age is defined varies: the Latvian Insurance Budget Model (The Economic Policy Committee and Directorate-General for Economic and Financial Affairs, 2007) uses user-specified average pension ages that may vary along certain variables (birth cohort, gender). In the Slovenian IER model (Nataša Kump, personal communication, 2019, 2022) and Colin et al. (2000) French model, individuals retire as soon as they fulfil the administrative eligibility requirements. The German model DIW (Geyer and Steiner, 2014) reproduces patterns observed in an actual population, such as the average effective retirement age by age and region, modified with a factor reflecting changes in legislation. offers two hypotheses: a “minimum seniority behaviour" hypothesis, where all individuals retire when reaching a certain age, and an "average seniority" hypothesis, in which individuals retire at the average seniority observed in survey data. However, pensionable ages, as defined by legislation, still play a significant role in retirement patterns across the EU (Social Protection Committee (SPC) and European Commission (DG EMPL), 2021, p. 58).
10.
At first, the type of dynamic ageing (longitudinal or cross-section) had been set as a criterion. The model documentation does not provide much explicit information about this type of ageing, so it was left out to avoid the risk of inferring it from the context and mislabeling the MSM.
11.
Throughout the past decade, microsimulation has become widespread in pensions policies across the EU (Dekkers et al., 2015a; Dekkers et al., 2015b; Dekkers and Desmet, 2018; Social Protection Committee (SPC) and European Commission (DG EMPL), 2021).
12.
By contrast, all the models developed by individual researchers or teams, often created to test a single hypothesis, were excluded from the review. References to this model can be found in the Excel file detailing the selection process attached to this article.
13.
The separate treatment of retirement does not require a unique model, unlike other decisions. For instance, MIDAS models the decision to retire early by setting the a priori probability of a transition into other states to a minimum when the individual fulfils the eligibility requirements for early retirement.
14.
It is unclear whether the Danish SMILE, which regards retirement as non-absorbing, considers retirement a separate decision and whether it was coded as such.
15.
Although the Anglo-Saxon models quoted here coincide entirely with the liberal welfare regimes, actual retirement regimes as a whole seem to coincide only partially with Esping-Andersen’s three-fold typology (Soede and Vrooman, 2008).
16.
Meso-economic or cell-based models are simulation models that divide a population into categories on which evolutions are projected (Toder et al., 2000). In PROMESS, for instance, each category is “defined by the generation, the gender, the country of birth (France/abroad), the insurance duration at the age of 54, the wage quartile and the pension scheme at the end of career(…)” (Aubert et al., 2013). The transition probabilities are then modelled for each of these categories.
17.
Note that the operationalisation need not be the same across models using the same variable. Education may, for instance, be interpreted in terms of diploma (as is the case for most models) or school leaving age (as in PRISME).
18.
This would be, however, an imperfect proxy, as the proportion of white-collar workers in surveys may be biased. Moreover, workers may change their status from white to blue collar and vice versa.
19.
A possible way to circumvent the lack of ethnicity data might be to look at the country of birth variable for first-generation immigrants, but second-generation immigrants, whose career paths might differ from their peers with native-born parents, are not covered by this variable.
20.
In CAPP-DYN, the fulfilment of eligibility conditions is considered not as a variable but as part of the algorithm to decide which part of the population is "allowed" to make a retirement decision. This is also the case for MIDAS Belgium (cf. supra).
21.
The description of the models is taken from the MINT5 documentation, as nothing in the MINT6 and MINT7 overview technical documents (Smith and Favreault, 2013) points to any changes in the retirement decision models.
22.
As the complexity of a model increases (as is the case of retirement), the fit of model outcomes and alignment tables may decrease, as there are “softer” take or leave conditions (Bryon et al., 2018). This makes alignment an interesting venue for MSM validation
23.
This assertion requires some further qualification. Even though migration is often not present in the behavioural equations, it may be indirectly approached in the eligibility requirements to retire (i.e., minimum career length in the country.)
24.
So far, private pensions have been modelled in Anglo-Saxon, Dutch and Scandinavian MSM; French and Italian MSM model several public schemes.
References
-
1
A Micro Simulation Model of Demographic Development and Households’ Economic Behavior in ItalyEconomic Research and International Relations Area.
-
2
Grading quality of evidence and strength of recommendations: a perspectivePLoS Medicine 6:e1000151.https://doi.org/10.1371/journal.pmed.1000151
-
3
Financial incentives and retirement: evidence from federal civil service workersJournal of Public Economics 89:427–440.https://doi.org/10.1016/j.jpubeco.2003.12.006
-
4
French Retirement Reforms and Intragenerational Equity in Retirement DurationDe Economist 161:277–305.https://doi.org/10.1007/s10645-013-9212-6
-
5
Les biographies du modele Destinie II: rebasage et projection (no.G 2014/1)Les biographies du modele Destinie II: rebasage et projection (no.G 2014/1).
-
6
Age and job fit: The relationship between demands–ability fit and retirement and healthJournal of Occupational Health Psychology 25:227–243.https://doi.org/10.1037/ocp0000164
-
7
The importance of financial incentives on retirement choices: New evidence for ItalyLabour Economics 16:578–588.https://doi.org/10.1016/j.labeco.2009.01.008
-
8
Retirement Choices in Italy: What an Option Value Model Tells Us*Oxford Bulletin of Economics and Statistics 75:499–527.https://doi.org/10.1111/j.1468-0084.2012.00701.x
-
9
Pension Reform in Germany: The Impact on Retirement Decisions9913, Pension Reform in Germany: The Impact on Retirement Decisions, Cambridge, MA, p.
- 10
-
11
La modélisation des trajectoires professionnelles dans le modèle PrismeEconomie et Statistique 481–482:97–120.
-
12
Linked lives, linked retirement? Relative income differences within couples and gendered retirement decisions in EuropeAdvances in Life Course Research 47:S1040-2608(20)30063-0.https://doi.org/10.1016/j.alcr.2020.100380
-
13
SIMUL. A Demographic and Economic Microsimulation Model for QuebecSIMUL. A Demographic and Economic Microsimulation Model for Quebec, Montreal.
-
14
Le modèle de microsimulation Destinie 2: principales caractéristiques et premiers résultatsEconomie et Statistique 441–442:101–121.
-
15
Do good working conditions make you work longer? Analyzing retirement decisions using linked survey and register dataThe Journal of the Economics of Ageing 17:100192.https://doi.org/10.1016/j.jeoa.2019.02.001
-
16
A systematic review of causes of recent increases in ages of labor market exit in OECD countriesPloS One 15:e0231897.https://doi.org/10.1371/journal.pone.0231897
-
17
Effects of Early Retirement Policy Changes on Working until Retirement: Natural ExperimentInternational Journal of Environmental Research and Public Health 16:3895.https://doi.org/10.3390/ijerph16203895
-
18
Microsimulation of pension reforms: behavioural versus nonbehavioural approachJournal of Pension Economics and Finance 9:583–607.https://doi.org/10.1017/S1474747209990163
-
19
Pensioner poverty over the next decade: what role for tax and benefit reform (Commentaries No. 103). LondonPensioner poverty over the next decade: what role for tax and benefit reform (Commentaries No. 103). London.
- 20
-
21
Le modèle de microsimulation Destinie 2 : principales caractéristiques et premiers RésultatsEconomie et Statistique 441:101–121.https://doi.org/10.3406/estat.2011.9615
-
22
Campbell Collaborationhttps://www.campbellcollaboration.org/, Accessed, 31 March 2022.
-
23
T-DYMM: The Treasury Dynamic Microsimulation Model of the Italian Pension System. 11T-DYMM: The Treasury Dynamic Microsimulation Model of the Italian Pension System. 11, Rome.
-
24
Happy Together: A Structural Model of Couples’ Joint Retirement Choiceshttp://www.econ.ucla.edu/casanova/Files/Casanova_joint_ret.pdf, Accessed, 29 July 2019.
- 25
-
26
From Career Specificities to Institutional Pension Scheme Specificities: A Microsimulation of Public vs Private Sector PensionsRévue Economique 51:97–114.
-
27
Le Modèle de Microsimulation Dynamique Des Retraites Aphrodite. 2016/04Le Modèle de Microsimulation Dynamique Des Retraites Aphrodite. 2016/04, Paris.
-
28
Work or Retirement? Exit Routes for Norwegian Elderly. 32Work or Retirement? Exit Routes for Norwegian Elderly. 32, Bonn.
-
29
Modelling Our Future: Population Ageing, Social Security and Taxation55–80, A Microsimulation Model of Private Sector Pensions in France, Modelling Our Future: Population Ageing, Social Security and Taxation, Amsterdam, Elsevier B.V, p.
-
30
Educational differences in macro-level determinants of early exit from paid work: A multilevel analysis of 14 European countriesEuropean Journal of Ageing 17:217–227.https://doi.org/10.1007/s10433-019-00538-6
-
31
On the Impact of Indexation and Demographic Ageing on Inequality among Pensioners. Validating MIDAS Belgium Using a Stylized Model. 36136On the Impact of Indexation and Demographic Ageing on Inequality among Pensioners. Validating MIDAS Belgium Using a Stylized Model. 36136, Munich.
-
32
The Flip Side of the Coin: The Consequences of the European Budgetary Projections on the Adequacy of Social Security PensionsEuropean Journal of Social Security 12:94–120.https://doi.org/10.1177/138826271001200201
-
33
Review of Pension Modelling Tools in CroatiaReview of Pension Modelling Tools in Croatia, Brussels.
-
34
Prospective Microsimulation of Pensions in European Member StatesApplications of microsimulation modelling. A selection of papers presented during the 2016 European meeting of the International Microsimulation Association in Budapest. pp. 13–33.
-
35
Individual and institutional push and pull factors as predictors of retirement timing in Europe: A multilevel analysisJournal of Aging Studies 27:299–307.https://doi.org/10.1016/j.jaging.2013.06.003
-
36
Description Du Modèle de Microsimulation de l’Agirc-ArrcoDescription Du Modèle de Microsimulation de l’Agirc-Arrco, Paris.
-
37
The Determinants of Early Retirement in SwitzerlandSwiss Journal of Economics and Statistics 141:247–283.
-
38
Individual Outcomes and Contemporary Policy Challenges in European Societies129–159, The Social and Budgetary Impacts of the Recent Social Security Reform in Belgium, Individual Outcomes and Contemporary Policy Challenges in European Societies, Antwerp, Intersentia, p, 10.1017/9781780685656.
-
39
On Using Dynamic Microsimulation Models to Assess the Consequences of the AWG Projections and Hypotheses on Pension Adequacy: Simulation Results for Belgium, Sweden and HungaryOn Using Dynamic Microsimulation Models to Assess the Consequences of the AWG Projections and Hypotheses on Pension Adequacy: Simulation Results for Belgium, Sweden and Hungary, Brussels.
-
40
Dynamic Microsimulation Modeling for Policy Support: An Application to Belgium and possibilities for JapanThe Review of Socionetwork Strategies 6:31–47.https://doi.org/10.1007/s12626-012-0026-9
-
41
Le modèle de microsimulation Trajectoire : un outil d’estimation des Réformes de retraites tous RégimesEconomie et Statistique 481:121–148.https://doi.org/10.3406/estat.2015.10632
- 42
-
43
Income from Work after Retirement in the EULuxembourg: Publications Office of the European Union.
-
44
The Methodology Developed by the Federal Planning Bureau to Produce Long-Term Scenarios. 5The Methodology Developed by the Federal Planning Bureau to Produce Long-Term Scenarios. 5, Brussels.
-
45
A Primer on the Dynamic Simulation of Income Model (DYNASIM3)A Primer on the Dynamic Simulation of Income Model (DYNASIM3), Washington, D.C.
-
46
Economic Policy Committee’s Ageing Working Group. Belgium: Country Fiche 2017Economic Policy Committee’s Ageing Working Group. Belgium: Country Fiche 2017, Brussels.
-
47
The Decision to Retire Early: A Review and ConceptualizationThe Academy of Management Review 19:285.https://doi.org/10.2307/258706
-
48
The Institutional Determinants of Early Retirement in Europe 2006-08The Institutional Determinants of Early Retirement in Europe 2006-08, St. Gallen, 10.2139/ssrn.895081.
-
49
Retirement Timing: A Review and Recommendations for Future ResearchWork, Aging and Retirement 2:230–261.https://doi.org/10.1093/workar/waw001
-
50
Should I Stay or Should I Go? A Workplace Perspective on Older Persons’ Labour Market ParticipationErasmus Universiteit Rotterdam.
-
51
SESIM III. A Swedish Dynamic Micro Simulation Modelhttp://www.sesim.org/Documents/Handbook of SESIM.pdf, Accessed, 23 April 2019.
-
52
Projections of Population, Education, Labour Supply and Public Pension Benefits. Analyses with the Dynamic Micro-simulation Model MOSART (Social and Economic Studies no.101)Projections of Population, Education, Labour Supply and Public Pension Benefits. Analyses with the Dynamic Micro-simulation Model MOSART (Social and Economic Studies no.101), Oslo.
-
53
Life time pension benefits relative to life time contributions (Discussion Papers no.825)Statistics Norway, Research Department.
-
54
PENMICRO. Monitoring Pension Developments through Micro Socio-Economic Instruments Based on Individual Data Sources: Feasibility StudyPENMICRO. Monitoring Pension Developments through Micro Socio-Economic Instruments Based on Individual Data Sources: Feasibility Study, Budapest.
-
55
The Decision to Retire Revisited: Does Machine Learning Offer an Added Value Vis-à-Vis Traditional Statistics?Mathematics 10:152.https://doi.org/10.3390/math10010152
-
56
Future public pensions and changing employment patterns across birth cohortsJournal of Pension Economics and Finance 13:172–209.https://doi.org/10.1017/S1474747213000334
-
57
Targeted Maximum Likelihood Estimation: A Gentle IntroductionTargeted Maximum Likelihood Estimation: A Gentle Introduction, Berkeley.
-
58
Social Security Programs and Retirement around the World: Micro EstimationLondon: National Bureau of Economic Research.https://doi.org/10.7208/chicago/9780226309989.001.0001
-
59
A Structural Retirement Model. 1237A Structural Retirement Model. 1237, Cambridge, MA.
-
60
Retirement in A Family Context: A Structural Model for Husbands and WivesDartmouth College Working Paper.
-
61
The Social Security Early Entitlement Age in a Structural Model of Retirement and Wealth. 9183The Social Security Early Entitlement Age in a Structural Model of Retirement and Wealth. 9183, Cambridge, MA.
-
62
How Changes in Social Security Affect Recent Retirement Trends. 14105How Changes in Social Security Affect Recent Retirement Trends. 14105, Cambridge, MA.
-
63
Health and retirement in EuropeInternational Journal of Environmental Research and Public Health 6:2676–2695.https://doi.org/10.3390/ijerph6102676
-
64
IHS Microsimulation Model for Retirement Behaviour in Austria. Final ReportIREA, IHS Microsimulation Model for Retirement Behaviour in Austria. Final Report, Vienna.
-
65
Validating a dynamic population microsimulation model: Recent experience in AustraliaInternational Journal of Microsimulation 3:46–64.https://doi.org/10.34196/ijm.00038
-
66
Structural Equations, Treatment Effects and Econometric Policy Evaluation, 11259Structural Equations, Treatment Effects and Econometric Policy Evaluation, 11259, Cambridge, MA.
-
67
Trends and Determinants of Work-Retirement Transitions under Changing Institutional Conditions: Germany, England and Japan ComparedJournal of Social Policy 45:39–64.
- 68
-
69
Retirement patterns of couples in EuropeIZA Journal of European Labor Studies 3:12.https://doi.org/10.1186/2193-9012-3-12
-
70
Early Adversity and Late Life Employment History—A Sequence Analysis Based on SHAREWork, Aging and Retirement 4:238–250.https://doi.org/10.1093/workar/wax014
-
71
The challenge of measuring immigrant origin and immigration-related ethnicity in EuropeJournal of International Migration and Integration / Revue de l’integration et de La Migration Internationale 10:67–88.https://doi.org/10.1007/s12134-009-0091-2
- 72
-
73
Aging and Work in the 21st Century273–291, Retirement from Three Perspectives: Individuals, Organizations, and Society, Aging and Work in the 21st Century, p, 10.4324/9781315167602.
- 74
-
75
Project MIGAPE: Work Package 3: Results of the Dynamic Simulations for SwitzerlandProject MIGAPE: Work Package 3: Results of the Dynamic Simulations for Switzerland, Liechtenstein.
-
76
Changes in the Income Distribution of the Dutch Elderly between 1989 and 2020: A Dynamic MicrosimulationReview of Income and Wealth 59:460–485.https://doi.org/10.1111/roiw.12025
-
77
Health, longevity and retirement reformJournal of Economic Dynamics and Control 103:123–157.https://doi.org/10.1016/j.jedc.2019.03.004
-
78
LABORsim: An agent-based microsimulation of labour supply - An application to ItalyComputational Economics 27:63–88.
-
79
A Survey of Dynamic Microsimulation Models: Uses, Model Structure and MethodologyInternational Journal of Microsimulation 6:3–55.
-
80
Evaluating Binary Alignment Methods in Microsimulation ModelsJournal of Artificial Societies and Social Simulation 17:15.https://doi.org/10.18564/jasss.2334
-
81
Handbook of Microsimulation Modelling305–343, Dynamic Models, Handbook of Microsimulation Modelling, Emerald Group Publishing LTD, p, 10.1108/S0573-85552014293.
-
82
Do immigrants delay retirement and social security claiming?Applied Economics 52:1105–1123.https://doi.org/10.1080/00036846.2019.1659492
-
83
Topics in the Economics of Aging21–60, Three Models of Retirement: Computational Complexity versus Predictive Validity, Topics in the Economics of Aging, Chicago, University of Chicago Press, p.
-
84
Educational Inequalities in Labor Market Exit of Older Workers in 15 European CountriesJournal of Social Policy 51:435–459.https://doi.org/10.1017/S0047279421000258
-
85
IrpetDin. A Dynamic Microsimulation Model for Italy and the Region of TuscanyInternational Journal of Microsimulation 13:27–53.https://doi.org/10.34196/IJM.00224
-
86
Policy variation, labor supply elasticities, and a structural model of retirementEconomic Inquiry 53:1702–1717.https://doi.org/10.1111/ecin.12207
-
87
Nonparametric Evidence on the Effects of Financial Incentives on Retirement DecisionsNonparametric Evidence on the Effects of Financial Incentives on Retirement Decisions, Cambridge, MA.
-
88
CAPP DYN: A Dynamic Micro-Simulation Model for the Italian Social Security System 48CAPP DYN: A Dynamic Micro-Simulation Model for the Italian Social Security System 48, Modena.
- 89
-
90
Preferred reporting items for systematic reviews and meta-analyses: the PRISMA statementPLoS Medicine 6:e1000097.https://doi.org/10.1371/journal.pmed.1000097
-
91
Financial and Social Sustainability of the Portuguese Pension SystemLisboa: Fundacao Francisco Manuel dos Santos.
-
92
Overview of DYNACAN. A Full-Fledged Canadian Actuarial Stochastic Model Designed for the Fiscal and Policy Analysis of Social Security Schemeshttps://www.actuaries.org/CTTEES_SOCSEC/Documents/dynacan.pdf, Accessed, 27 May 2019.
- 93
-
94
The Life-Cycle Income Analysis Model (LIAM): A Study of A Flexible Dynamic Microsimulation Modelling Computing Framework. 85The Life-Cycle Income Analysis Model (LIAM): A Study of A Flexible Dynamic Microsimulation Modelling Computing Framework. 85, Turin.
-
95
Final Report. WERSA Project Strand 1 - Building Administrative Datasets and Modelshttps://www.oecd.org/daf/fin/private-pensions/WERSA-Project-Strand1-Retirement-Savings-Italy.pdf, Accessed, 23 April 2019.
-
96
A New Type of Socio-Economic SystemThe Review of Economics and Statistics 39:116.https://doi.org/10.2307/1928528
-
97
The Impact of the Retirement Decision and Demographics on Pension Sustainability:A Dynamic Microsimulation AnalysisInternational Journal of Microsimulation 11:84–108.https://doi.org/10.34196/ijm.00181
-
98
Systematic Reviews in the Social Sciences: A Practical GuideSystematic Reviews in the Social Sciences, Systematic Reviews in the Social Sciences: A Practical Guide, Oxford, UK, Blackwell Publishing, 10.1002/9780470754887.
-
99
Labour Market Exit and Social Stratification in Western Europe: The Effects of Social Class and Gender on the Timing of RetirementEuropean Sociological Review 29:654–668.https://doi.org/10.1093/esr/jcs045
-
100
The influence of marital status and spousal employment on retirement behavior in Germany and SpainResearch on Aging 37:361–387.https://doi.org/10.1177/0164027514536403
-
101
LabourForceParticipationGitHub.
-
102
JAS-Mine: A New Platform for MicrosimulationInternational Journal of Microsimulation 10:106–134.https://doi.org/10.34196/ijm.00151
-
103
Determinants for the transition from work into retirement in EuropeIZA Journal of European Labor Studies 4:s40174.https://doi.org/10.1186/s40174-014-0027-5
-
104
Over education among older workers: impact on wages and early retirement decisionsApplied Economics Letters 16:1621–1626.https://doi.org/10.1080/13504850701604052
-
105
How Social Security and Medicare Affect Retirement Behavior In a World of Incomplete MarketsEconometrica 65:781.https://doi.org/10.2307/2171940
-
106
Using sequence analysis to visualize and validate model transitionsInternational Journal of Microsimulation 13:61–78.https://doi.org/10.34196/IJM.00218
-
107
Using trajectory analysis to test and illustrate microsimulation outcomesInternational Journal of Microsimulation 12:3–17.https://doi.org/10.34196/ijm.00198
-
108
New Evidence on Pensions, Social Security, and the Timing of Retirement. 6534New Evidence on Pensions, Social Security, and the Timing of Retirement. 6534, Cambridge, MA.
-
109
Labor Markets and Firm Benefit Policies in Japan and the United States205–228, Option Value Estimation with Health and Retirement Study Data, Labor Markets and Firm Benefit Policies in Japan and the United States, Chicago, University of Chicago Press, p.
-
110
The Long-Run Effects of the Italian Pension ReformsInternational Tax and Public Finance 8:83–111.https://doi.org/10.1023/A:1008745617309
-
111
UMDBS,- a New Tool for Dynamic MicrosimulationJournal of Artificial Societies and Social Simulation 5:5_2.
-
112
Domains and determinants of retirement timing: A systematic review of longitudinal studiesBMC Public Health 18:1083.https://doi.org/10.1186/s12889-018-5983-7
-
113
Early Retirement in Germany, the Netherlands, and the United Kingdom: A Longitudinal Analysis of Individual Factors and Institutional RegimesEuropean Sociological Review 24:315–329.https://doi.org/10.1093/esr/jcn009
-
114
Expectations, loss aversion and retirement decisions in the context of the 2009 crisis in EuropeInternational Journal of Manpower 38:25–44.https://doi.org/10.1108/IJM-02-2016-0041
-
115
A Primer on Modeling Income in the Near Term, Version 7Washinton, DC: Urban Institute.
-
116
Modeling Income in the Near Term 51–367, Modeling Income in the Near Term 5, Washington, D.C, p, 10.2139/ssrn.2206397.
-
117
The 2021 Pension Adequacy Report: Current and Future Income Adequacy in Old Age in the EUBrussels: European Commission.
- 118
-
119
What could make me stay at work’: Retirement transition profilesCurrent Psychology 42:6302–6314.https://doi.org/10.1007/s12144-021-01967-2
-
120
Simulation Models for Socioeconomic Inequalities in Health: A Systematic ReviewInternational Journal of Environmental Research and Public Health 10:5750–5780.https://doi.org/10.3390/ijerph10115750
-
121
What is Social Science Microsimulation?Social Science Computer Review 29:9–20.https://doi.org/10.1177/0894439310370085
-
122
The LifePaths Microsimulation Model: An OverviewThe LifePaths Microsimulation Model: An Overview, Ottawa.
-
123
Modelling foreign labour inflows using a dynamic microsimulation model of an ageing country - SlovakiaInternational Journal of Microsimulation 13:102–113.https://doi.org/10.34196/IJM.00220
-
124
Pensions, the Option Value of Work, and RetirementEconometrica 58:1151.https://doi.org/10.2307/2938304
-
125
Importance of the Working Environment for Early Retirement: Prospective Cohort Study with Register Follow-UpInternational Journal of Environmental Research and Public Health 18:9817.https://doi.org/10.3390/ijerph18189817
-
126
Pensions Schemes and Projection Models in EU-25Member States. 35Pensions Schemes and Projection Models in EU-25Member States. 35, Brussels.
-
127
Microsimulating Finnish Earnings-Related PensionsMicrosimulating Finnish Earnings-Related Pensions, Helsinki.
-
128
Final Report. Long Term Model Development for Social Security Policy AnalysisFinal Report. Long Term Model Development for Social Security Policy Analysis, Washington, D.C.
-
129
Early Retirement: A Meta-Analysis of Its Antecedent and Subsequent CorrelatesFrontiers in Psychology 8:2157.https://doi.org/10.3389/fpsyg.2017.02157
-
130
Antecedents and consequences of retirement planning and decision-making: A meta-analysis and modelJournal of Vocational Behavior 75:38–55.https://doi.org/10.1016/j.jvb.2009.03.002
-
131
Retirement timing in Italy: rising age and the advantages of a stable working careerAgeing and Society 41:1878–1896.https://doi.org/10.1017/S0144686X20000148
-
132
Becoming a Grandparent and Early Retirement in EuropeEuropean Sociological Review 29:1295–1308.https://doi.org/10.1093/esr/jct005
-
133
A structural dynamic microsimulation model of household savings and labour supplyEconomic Modelling 28:2054–2070.https://doi.org/10.1016/j.econmod.2011.04.009
-
134
Financial Literacy and Retirement Planning in the Netherlands. 231/2009Financial Literacy and Retirement Planning in the Netherlands. 231/2009, Amsterdam.
-
135
The impact of ill health on exit from paid employment in Europe among older workersOccupational and Environmental Medicine 67:845–852.https://doi.org/10.1136/oem.2009.051730
- 136
-
137
The role of personal characteristics, work environment and context in working beyond retirement: A mixed-methods studyInternational Archives of Occupational and Environmental Health 92:535–549.https://doi.org/10.1007/s00420-018-1387-3
-
138
Micro simulations on the effects of ageing-related policy measures: The Social Affairs Department of the Netherlands Ageing and Pensions ModelInternational Journal of Microsimulation 4:72–99.https://doi.org/10.34196/ijm.00046
-
139
Employee Retirement: A Review and Recommendations for Future InvestigationJournal of Management 36:172–206.https://doi.org/10.1177/0149206309347957
-
140
100 years of applied psychology research on individual careers: From career management to retirementThe Journal of Applied Psychology 102:546–563.https://doi.org/10.1037/apl0000143
-
141
The MicSim Package of R: An Entry-Level Toolkit for Continuous-Time MicrosimulationInternational Journal of Microsimulation 7:3–32.https://doi.org/10.34196/ijm.00105
Article and author information
Author details
Montserrat Gonzalez Garibay

Funding
This research was funded by the project "Upgrade of Analytical Models Concerning the Pension Scheme", financed by the European Social Fund and the Slovenian Ministry of Labour, Family, Social Affairs and Equal Opportunities.
Acknowledgements
This research took place in the framework of the DyPenSI model development. The author would like to thank Gijs Dekkers, Nataša Kump, Boris Majcen, Richard Morrison, Martin Spielauer, two anonymous Canadian experts and two anonymous reviewers for their feedback. All errors remain the author’s responsibility.
Publication history
- Version of Record published: December 31, 2023 (version 1)
Copyright
© 2023, Garibay
This article is distributed under the terms of the Creative Commons Attribution License, which permits unrestricted use and redistribution provided that the original author and source are credited.