The Retirement Decision in Dynamic Microsimulation Models: An Exploratory Review
- Inštitut za ekonomska raziskovanja, Slovenia
Cite this article
as: M. Gonzalez Garibay; 2023; The Retirement Decision in Dynamic Microsimulation Models: An Exploratory Review; International Journal of Microsimulation; 16(3); 19-48.
doi: 10.34196/ijm.00287
Figures
Figure 1
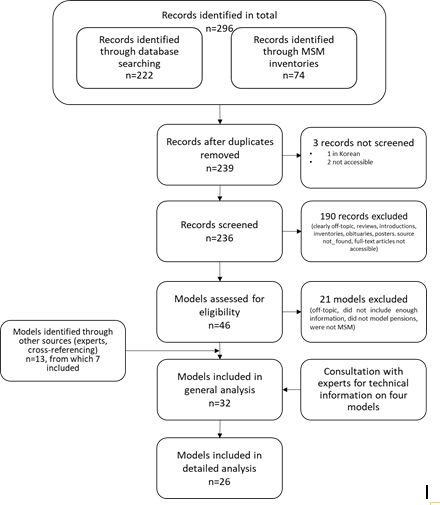
Flow of information through the phases of the systematic review. Source: template from Moher et al. (2009), filled and modified by the author following the example of Scharn et al. (2018).
Graph 1
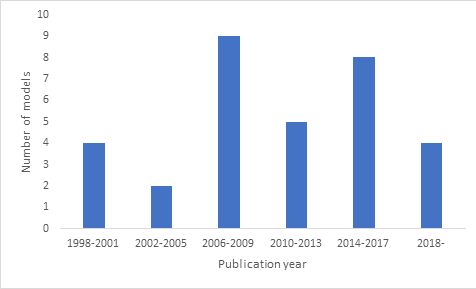
Dynamic MSM modelling retirement by year of publication (n=32)
Tables
Table 1
Countries by number of MSM modelling retirement
| Number of models | Country |
|---|---|
| 1 | Belgium, Denmark, Finland, Germany, Hungary, Ireland, Netherlands, Norway, Sweden, Slovenia, Spain |
| 2 | Australia, Canada, UK, Multi-Country |
| 3 | US |
| 4 | France |
| 6 | Italy |
-
Source: own elaboration
Table 2
MSM modelling retirement by substantive components present in their retirement definition (n=32)
| Substantive component of the retirement definition | Number of models |
|---|---|
| Benefit take-up | 3 |
| Transition out of employment | 4 |
| Benefit take-up Transition out of employment | 24 |
| Unknown | 1 |
| Total | 32 |
-
Source: own elaboration
Table 3
MSM modelling retirement by level at which the retirement decision is made (n=32)
| Level at which the retirement decision is made | Number of models |
|---|---|
| Individual | 30 |
| Household | 1 |
| Individual with possibility of analysing the household level | 1 |
| Total | 32 |
-
Source: own elaboration
Table 4
MSM modelling retirement by treatment of retirement as an absorbing state (n=32)
| Retirement as an absorbing state | Number of models |
|---|---|
| Yes | 23 |
| No | 5 |
| Unclear | 4 |
| Total | 32 |
-
Source: own elaboration
Table 5
MSM modelling retirement by relationship with other labour market decisions (n=32)
| Relationship with other labour market decisions | Number of models |
|---|---|
| Separate | 26 |
| Part of labour market supply | 5 |
| Unknown | 1 |
| Total | 32 |
-
Source: own elaboration
Table 6
MSM modelling retirement by relationship with other labour market decisions and origins of transition probabilities (n=32)
| Origins of transition probabilities’ distribution | Relationship with other labour market decisions | Total | ||
|---|---|---|---|---|
| Part of labour market supply | Separate | Unknown | ||
| Distribution estimated from statistical equation | 5 | 15 | 20 | |
| Distribution from observed data | 4 | 1 | 5 | |
| Distribution from another simulation model | 3 | 3 | ||
| User-defined distribution | 2 | 2 | ||
| Unknown | 2 | 2 | ||
| Total | 5 | 26 | 1 | 32 |
-
Source: own elaboration
Table 7
Basic features of dynamic probabilistic MSM assessing retirement as a separate labour market decision
| Source | Country | Name of model | Sample size (approximate) | Population categories | Data source | Theoretical framework | Method of calculation of transition probabilities | Source of parameters for the calculation of transition probabilities | Number of statistical equations | Validation | External alignment |
|---|---|---|---|---|---|---|---|---|---|---|---|
| Harding et al., 2009 | Australia | APPSIM | 188000 individuals | Australian population | Survey | No information provided | Logit | Historical survey data | 2 M/F) | Validation strategy, comparison with existing data | Optional, for total labour force participation |
| Debrand et al., 2012 | France | ARTEMIS | 1420598 | French private-sector employees | Administrative and survey | No information provided | Probabilities assigned from empirical distribution | Distribution of 1935 cohort | No equations estimated | No information provided | No information provided |
| Mazzaferro and Morciano (2012) | Italy | CAPP-DYN | 52772 individuals | Italian population | Survey | Option-Value model | Optimisation equation | No information provided | 1 | No information provided | Not for retirement, only for demographic variables |
| Belloni and Alessie, 2009; Borella and Moscarola, 2010 | Italy | CERPSIM3 | No information provided | Italian population | Administrative and survey | Reduced-form econometric model | Probit | Historical administrative data | 2(M/F) | Cross-sectional validation with available data | No information provided |
| Bachelet et al., 2014; Blanchet et al., 2011; Buffeteau et al., 2011 | France | DESTINIE II | 65000 individuals | French population | Survey | Reduced-form model (baseline) | Logit (baseline) Optimization equation (application) | Historical administrative data | 2(M/F) | No specific information on validation of retirement decision | Not for retirement, only for demographic variables (alignment by adjustment of probabilities) |
| Ando and Nicoletti Altimari (2004) | Italy | DYNAMITE | 25000 individuals per wave, 67000 households in total | Italian households | Survey | Reduced-form econometric model | Ordinary Least Squares Continuous hazard model as an option | Historical survey data | 2 (planned age for everyone and revised decision for older workers) | No information provided | Not for retirement, only for demographic variables |
| Nataša Kump, personal communication, 2019, 2022 | Slovenia | DyPenSI | 391425 individuals | Slovenian population | Administrative and survey | Reduced-form econometric model | Logit | Starting population | 2 (M/F) | Comparison with alignment tables | Optional alignment for labour market |
| Patxot et al., 2018 | Spain | DyPeS | Unknown | Spanish population | Administrative | Reduced-form econometric model | Hazard model | Historical administrative data | 2(M/F) | No information provided | No information provided |
| Tikanmäki et al. (2014) | Finland | ELSI | 250000 | Adult Finnish population | Administrative | No information provided | Probabilities assigned from another model | PTS macro model | No information provided | Sample-testing and model calibration with register data from 2009-2013 | All transition probabilities are updated yearly according to projections from a semi-aggregate model |
| Brewer et al., 2007 | UK | IFS Model | 12100 individuals | British population over 50 | Survey | No information provided | Logit | Starting population | 4 (M/F, full/part-time) | Retroactive simulations are compared to existing data. | For total labour force participation; alignment with observed data by adjusting probabilities |
| O’Donoghue et al. (2009) | Ireland | Irish Dynamic Cohort Microsimulation Model | 1000 | Synthetic cohort | Simulated | No information provided | Probabilities assigned from empirical distribution | Cross-sectional Irish survey data | No equations estimated | Comparison with survey and administrative data | No information provided |
| Maitino et al. (2020) | Italy | IrpetDin | No information provided | Italian citizens | Survey | No information provided | Optimisation equation | Assumption | 1 | Retroactive simulations are compared to existing data | For total labour force participation |
| Richiardi and Richardson, 2017 | Multi-country | JAS-mine Labour Force Participation | No information provided | Citizens from Italy, Spain, Ireland, Hungary and Greece | Survey | No information provided | Probabilities assigned from empirical distribution | Starting population | No equations estimated | No information provided | No information provided |
| Leombruni and Richiardi, 2006 | Italy | LABORSim | 50000 | Italian population | Survey | No information provided | User-defined | User-defined | User-defined | No information provided | Not for retirement, only for demographic variables |
| Richiardi and Richardson, 2015 | UK, Italy | LABSim | Unknown (112196 observations in regression analysis for IT, 84028 for UK) | UK and IT population | Survey | No information provided | Logit | Unclear | 2 per country (partnered/single) | No information provided | Not for retirement, only for demographic variables |
| Federaal Planbureau (2017) | Belgium | MIDAS | 305019 | Belgian population | Administrative | No information provided | Probabilities assigned from another model | MALTESE meso model | No equations estimated | Stylised validation through modelling (Dekkers) | Retirement is aligned with MALTESE projections |
| Smith et al., 2007; Smith and Favreault, 2013 | US | MINT7 | 82782 individuals | US population | Survey | Reduced-form econometric model | Probit | Historical survey and administrative data | 2 (married/unmarried) | Retroactive simulations are compared to existing data | Not for retirement, only for other variables |
| Fredriksen and Stølen, 2015; Fredriksen (1998) | Norway | MOSART | 40000 | Norwegian population | Administrative | No information provided | No information provided | Past retirement patterns | No information provided | Retroactive simulations are compared to existing data | No external alignment |
| van de Ven, 2011 | UK | NIBAX | No information provided | Synthetic cohort | Simulated | Structural model | Utility maximisation functions | Assumption calibrated by survey data | No information provided | Retroactive simulations are compared to existing data | Structural parameter calibration using survey data |
| Gal et al., 2009 | Hungary | NYIKA | 6000000 | Hungarian pension contributors | Administrative | No information provided | No information provided | Past retirement patterns | No equations estimated | No information provided | No information provided |
| Holmer et al., 2016 | US | PENSIM | Not fixed | Synthetic cohort | Simulated | Reduced-form econometric model | User-defined | User-defined | User-defined | Retroactive simulations are compared to existing data, and cross-sectional validation with other models | No information provided |
| Berteau-Rapin et al., 2015 | France | PRISME | 5000000 individuals | Persons affiliated with French social security | Administrative | No information provided | Logit | Starting population | 46[2] (M/F, age - by trimester) | Retroactive simulations are compared to existing data. | No information provided |
| van Sonsbeek, 2011 | Netherlands | SADNAP | Unknown (1% of the Dutch population) | Dutch population | Administrative | Option-Value model | Optimisation equation | Assumption based on theoretical literature | 1 | Cross-sectional validation with available data and other models (not necessarily MS) | Not for retirement, only for demographic variables |
| Flood et al., 2012 | Sweden | SESIM III | 300000 individuals | Swedish population | Administrative and survey | Reduced-form econometric model | Logit | Starting population | 1 | No information provided | Not for retirement, only for other variables |
| Caretta et al., 2013 | Italy | TDYMM | 43388 | Italian population | Administrative | No information provided | Probabilities assigned from empirical distribution | Starting population | No equations estimated | Retroactive simulations are compared to existing data | Not for retirement, only for labour market modules |
| Duc et al., 2015 | France | TRAJECTOIRE | 350000 | French pension contributors | Administrative | No information provided | Probabilities assigned from another model | PROMESS cell-based model | At least 12 (by sex, country of birth, generation, insurance duration, and contributing regime) | Retroactive simulations are compared to existing data | In some cases, the results of the transition probabilities are aligned with the PROMESS meso-model |
-
Source: own elaboration
Table 8
Explanatory variables in MSM assessing the retirement decision using an equation
| Variable | n | Models |
|---|---|---|
| Birth cohort | ||
| Birth cohort | 3 | Dynamite, CERPSIM3, MINT7 |
| Demographics | ||
| Age | 6 | APPSIM, DESTINIE II, IFS, DyPeS, MINT7, LabSIM |
| Education | 10 | APPSIM, PRISME, DESTINIE II, DYNAMITE, IFS, DyPeS, SESIM III, MINT7, DyPenSI, LabSIM |
| Gender | 4 | SADNAP, SESIM III, MINT7, LabSIM |
| Marital status | 3 | APPSIM, DYNAMITE, IFS |
| Origins | 2 | PRISME, MINT7 |
| Race of spouse | 1 | MINT7 |
| Employment history | ||
| Career length | 1 | DESTINIE II |
| Past illness, inactivity, part-time employment or unemployment | 3 | APPSIM, PRISME, DESTINIE II |
| Employment-related variables | ||
| Employment status (employed, unemployed, sick leave, fragmented employment, disability, self-employed) | 5 | PRISME, DyPeS, MINT7, DyPenSI, LabSIM |
| Unemployment benefits | 1 | DyPeS |
| Economic incentives | ||
| Accrual | 1 | SESIM III |
| Expected Social Security Wealth | 1 | DYNAMITE |
| Internal Rate of Return | 1 | DYNAMITE |
| Net Present Value | 1 | SESIM III |
| Option Value | 3 | DESTINIE II, SADNAP, CAPP-DYN |
| Peak Value | 2 | CERPSIM3, DyPeS |
| Potential benefits | 1 | DyPeS |
| Replacement rate | 3 | SADNAP, DyPeS, MINT7 |
| Social Security Wealth (SSW) | 1 | CAPP-DYN |
| Value of benefits | 1 | CERPSIM3 |
| Geographic factors | ||
| Region | 3 | DYNAMITE, CERPSIM3, LabSIM |
| Health | ||
| Health status | 3 | APPSIM, IFS, MINT7 |
| Disability status | 1 | LabSIM |
| Household-related variables | ||
| Age difference with spouse | 1 | MINT7 |
| Age of spouse | 1 | MINT7 |
| Contribution history of spouse | 1 | MINT7 |
| Dependents | 2 | DYNAMITE, MINT7 |
| Employment status of spouse | 4 | SESIM III, MINT7, DyPenSI, LabSIM |
| Spouse reached pension age | 1 | LabSIM |
| Spouse disability status | 1 | LabSIM |
| Head of household | 1 | DYNAMITE |
| Household composition | 1 | SESIM III |
| Income earners in the household | 1 | DYNAMITE |
| Income of spouse | 1 | MINT7 |
| Macro variables | ||
| Unemployment rate | 1 | DyPeS |
| Pension-related variables | ||
| Age at maximum pension | 1 | DyPeS |
| Coverage | 1 | MINT7 |
| Duration of coverage or contributions | 2 | PRISME, MINT7 |
| Eligibility conditions | 2 | DyPeS, MINT7 |
| Insurance in more than one regime | 1 | PRISME |
| Time to maximum pension | 1 | DyPeS |
| Reached pension age | 1 | LabSIM |
| Wealth and income | ||
| Current income | 4 | DyPeS, SESIM III, IFS, LabSIM |
| Family wealth | 1 | DYNAMITE |
| Homeownership | 1 | MINT7 |
| Past income | 2 | DESTINIE II, MINT7 |
| Ratio financial wealth/past income | 1 | MINT7 |
| Wealth | 1 | MINT7 |
| Work characteristics | ||
| Occupation | 2 | DYNAMITE, CERPSIM3 |
| Sector | 3 | DYNAMITE, CERPSIM3, DyPenSI |
| Time dimension | ||
| Year | 2 | DYNAMITE, IFS |
| Continuous time | 1 | DYNAMITE |
| Other | ||
| Inverse Mill’s ratio from probit estimate of being in the labour force | 1 | DYNAMITE |
-
Source: own elaboration
Data and code availability
The articles used in the review are all publicly available. The process of record selection, model selection, model classification and coding of each models’ features is provided in the supplementary Excel file (suppfile1_modeloverview.xlsx). Plese contact the journal for further details.
Download links
A two-part list of links to download the article, or parts of the article, in various formats.