The Projected Development of the Gender Pension Gap in Switzerland: Introducing MIDAS_CH
- University of Liechtenstein, Liechtenstein, and Albert-Ludwigs-Universität Freiburg, Germany
- Federal Planning Bureau and CESO, KU Leuven, Belgium
Figures

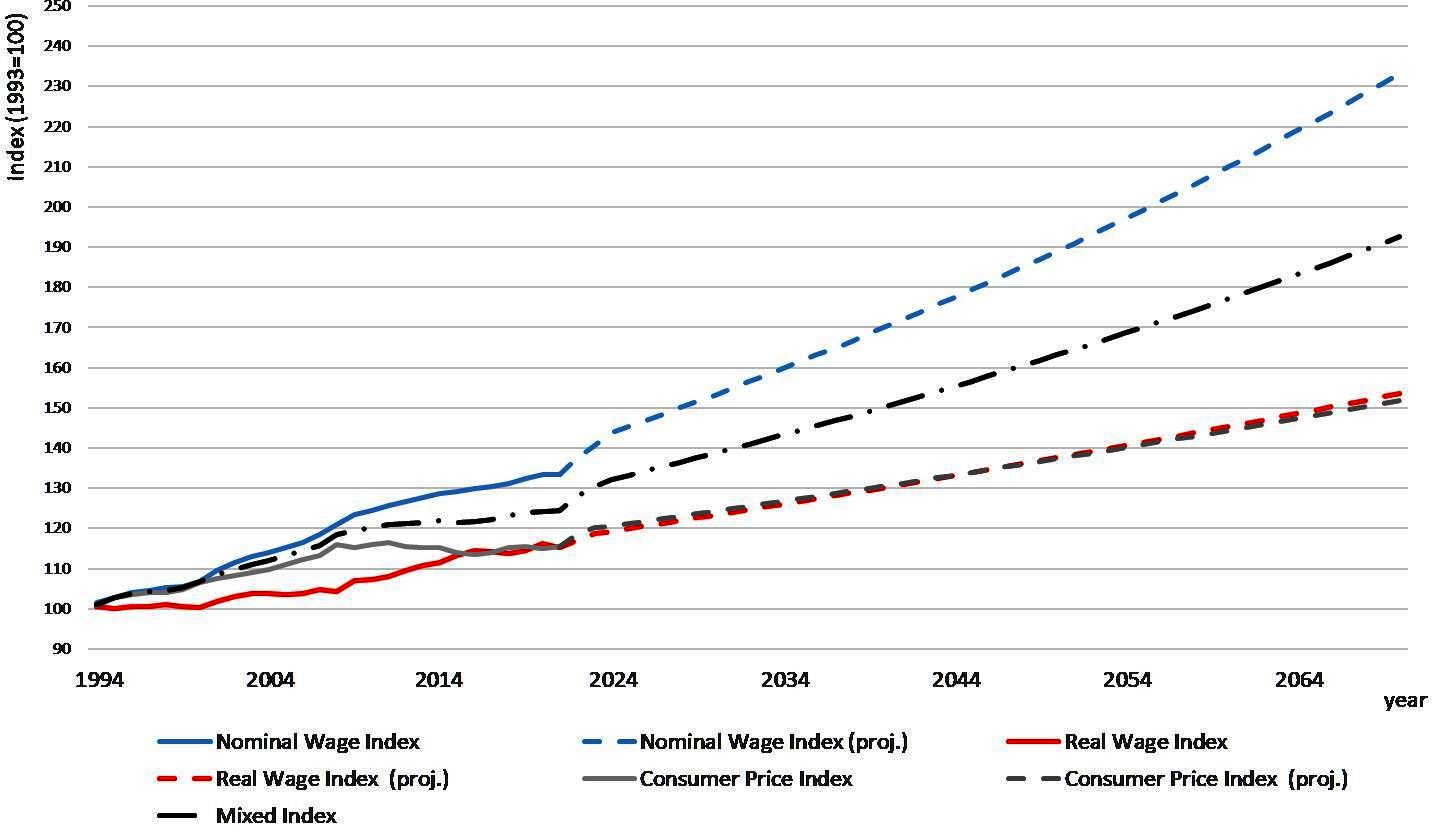
Nominal and real wage index, consumer price index, and mixed index (base 1993). Source: FSO (2022b), own projections.

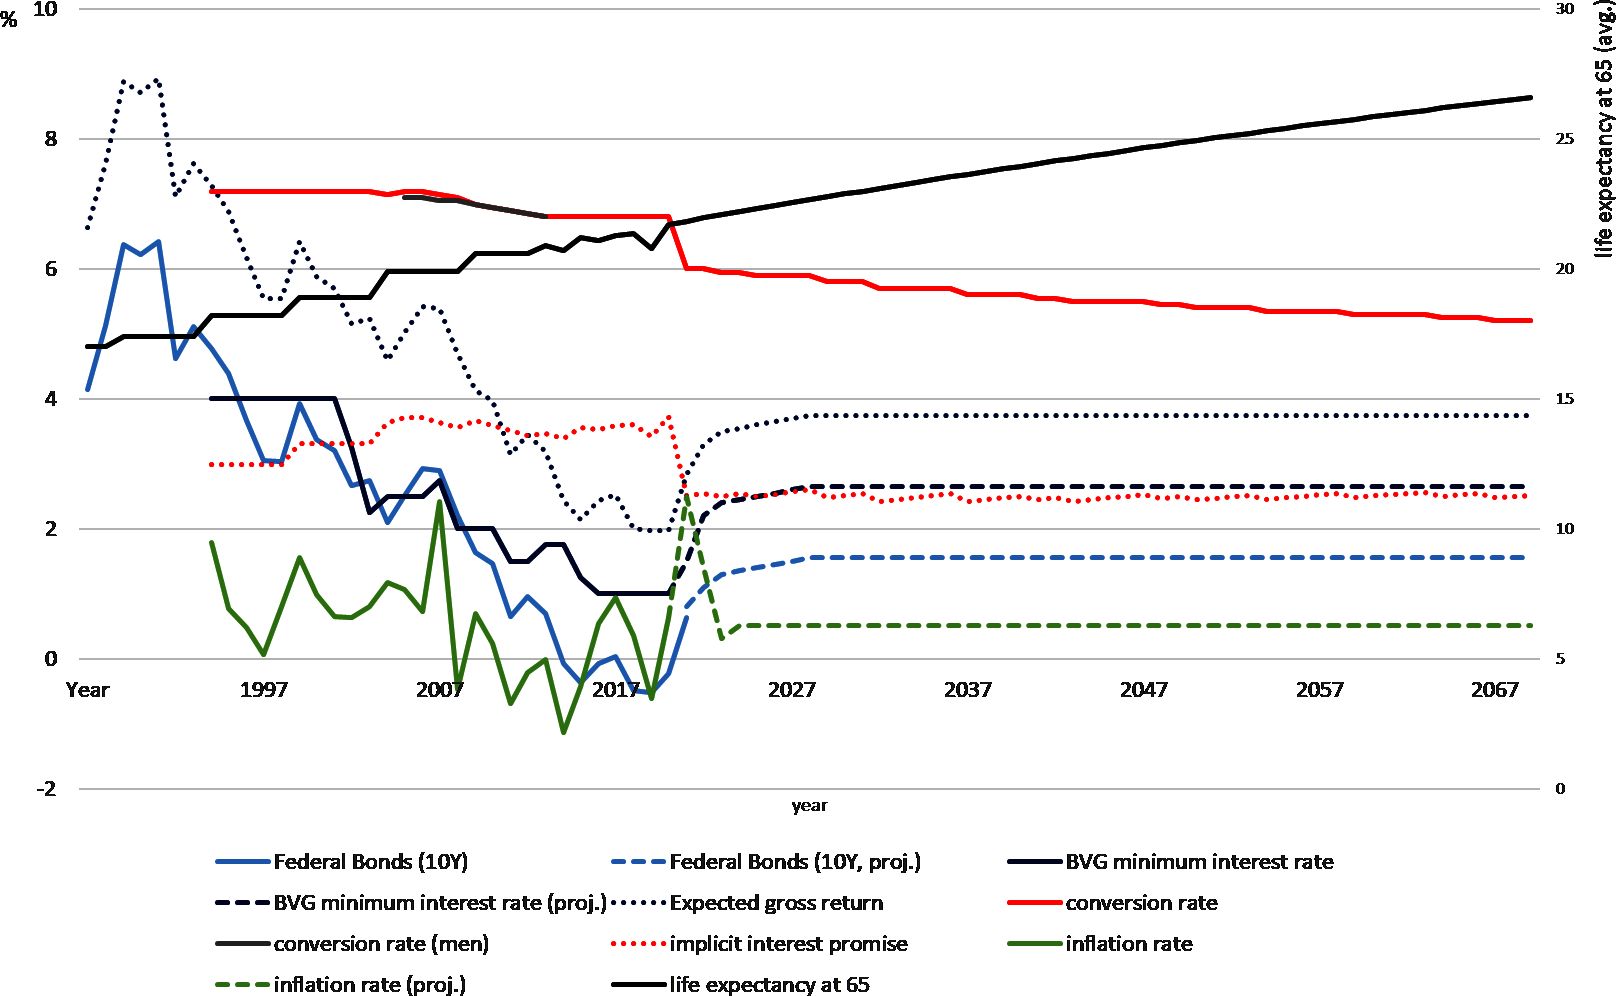
Actual and projected rates of return and life expectancy (at age of 65). Source: FSO (2022b), own projections.
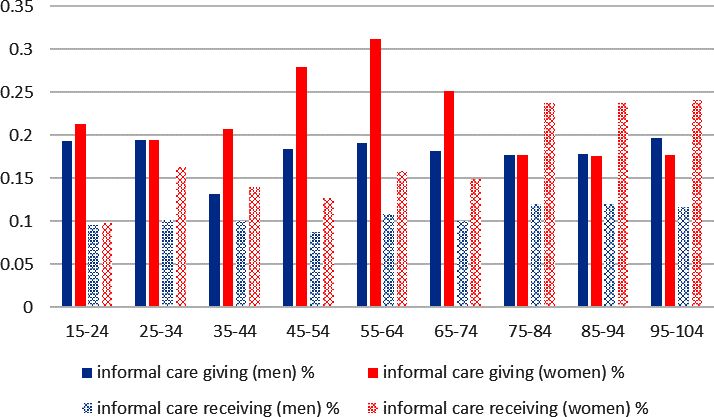
Need and provision of informal care (in percentages in 2025). Source: Own simulations.

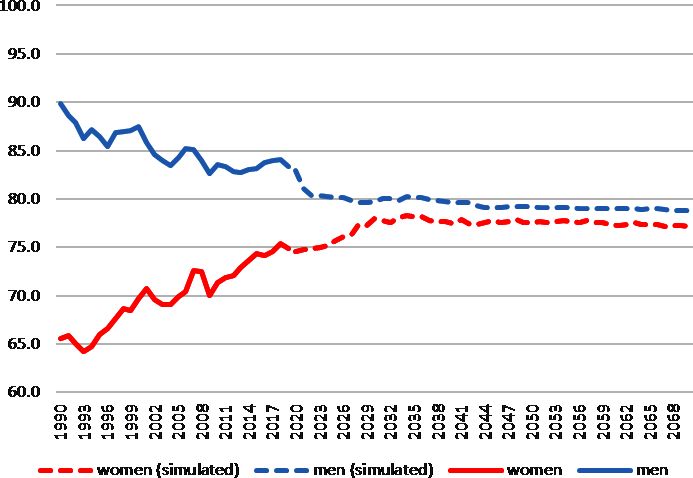
Actual and projected labour market participation of men and women aged between 15 and 64.. Source: FSO (2021c), own simulations.

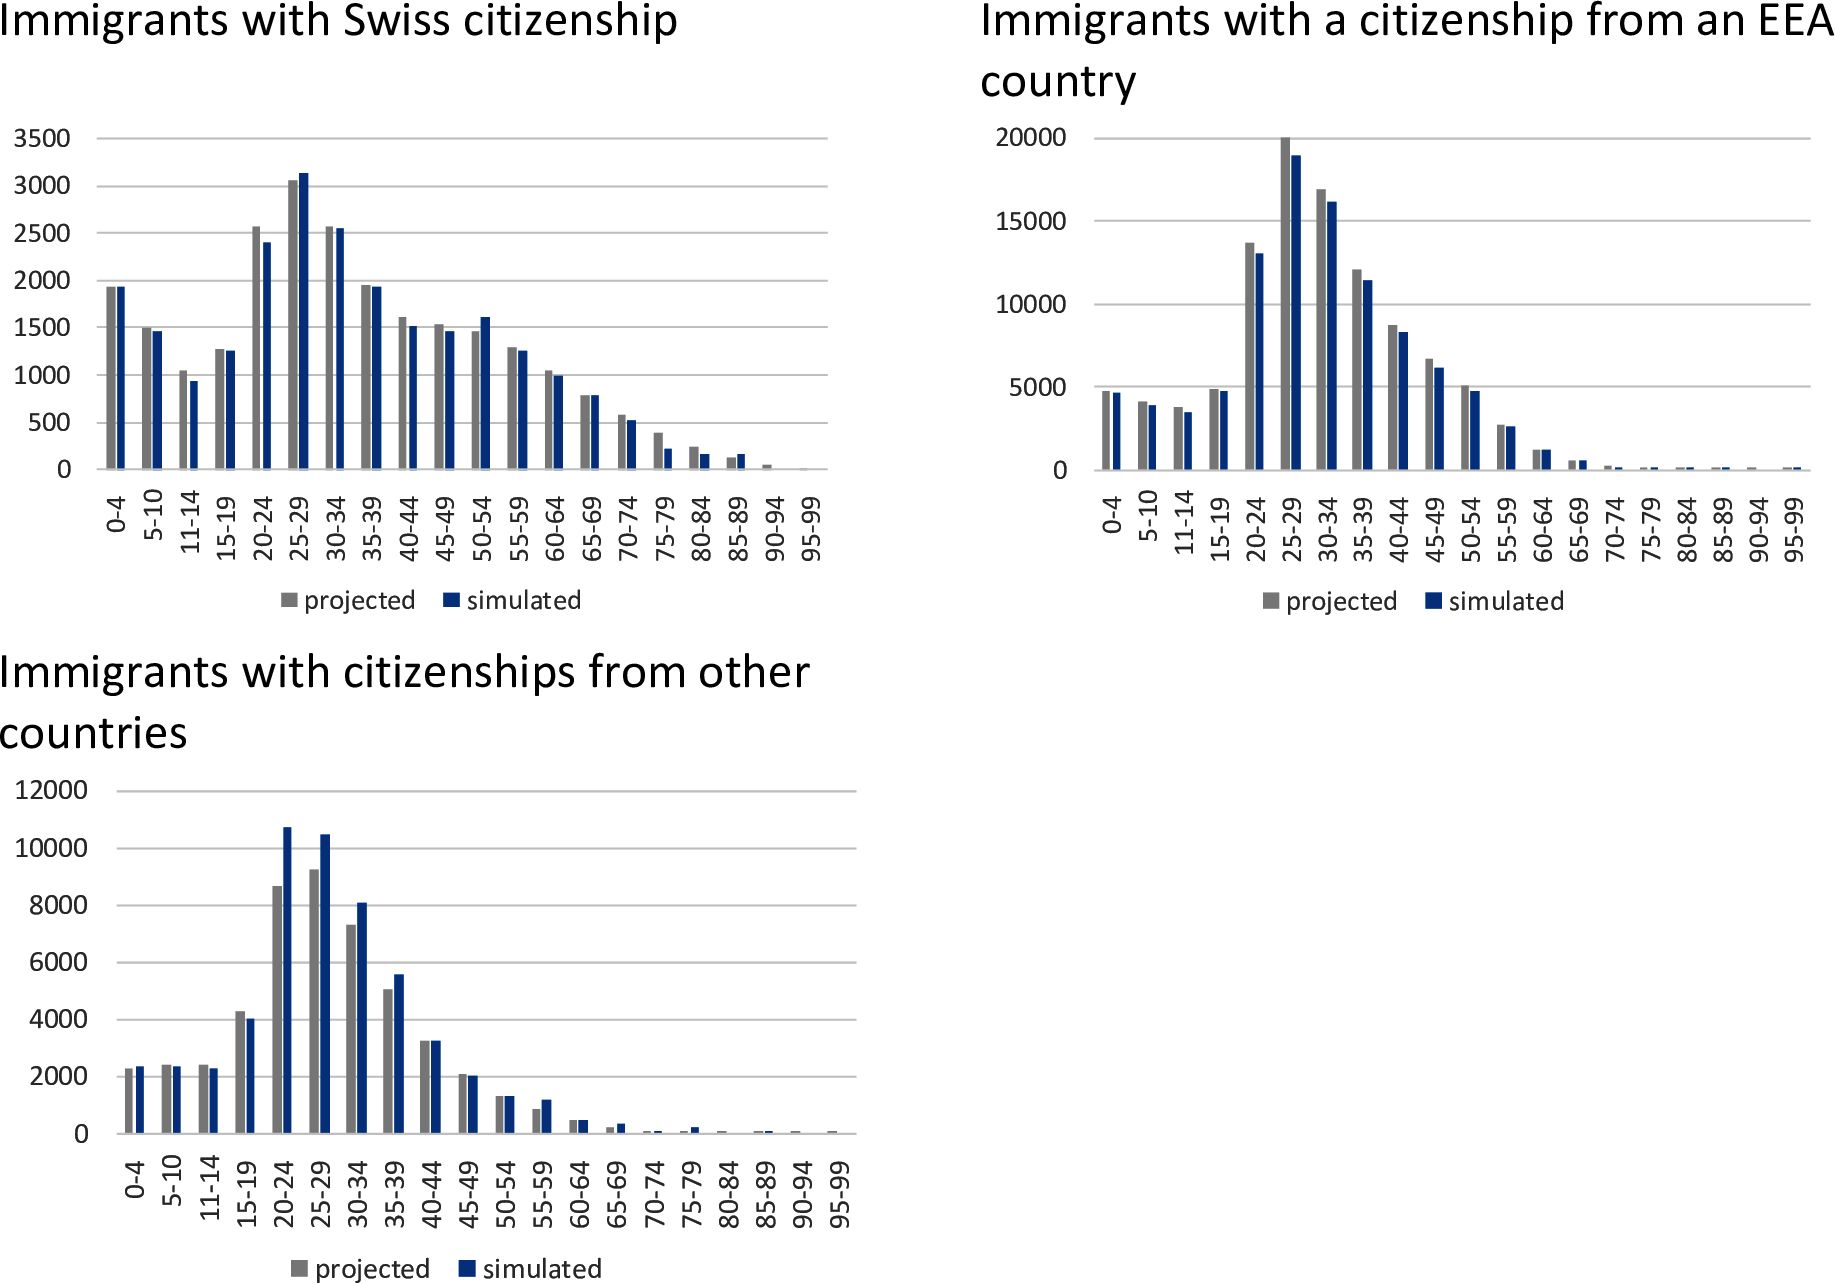
Age distribution of immigrants, by citizenship (2025). Source: Projections by FSO (2020c), base scenario A-00-2020, own simulations.

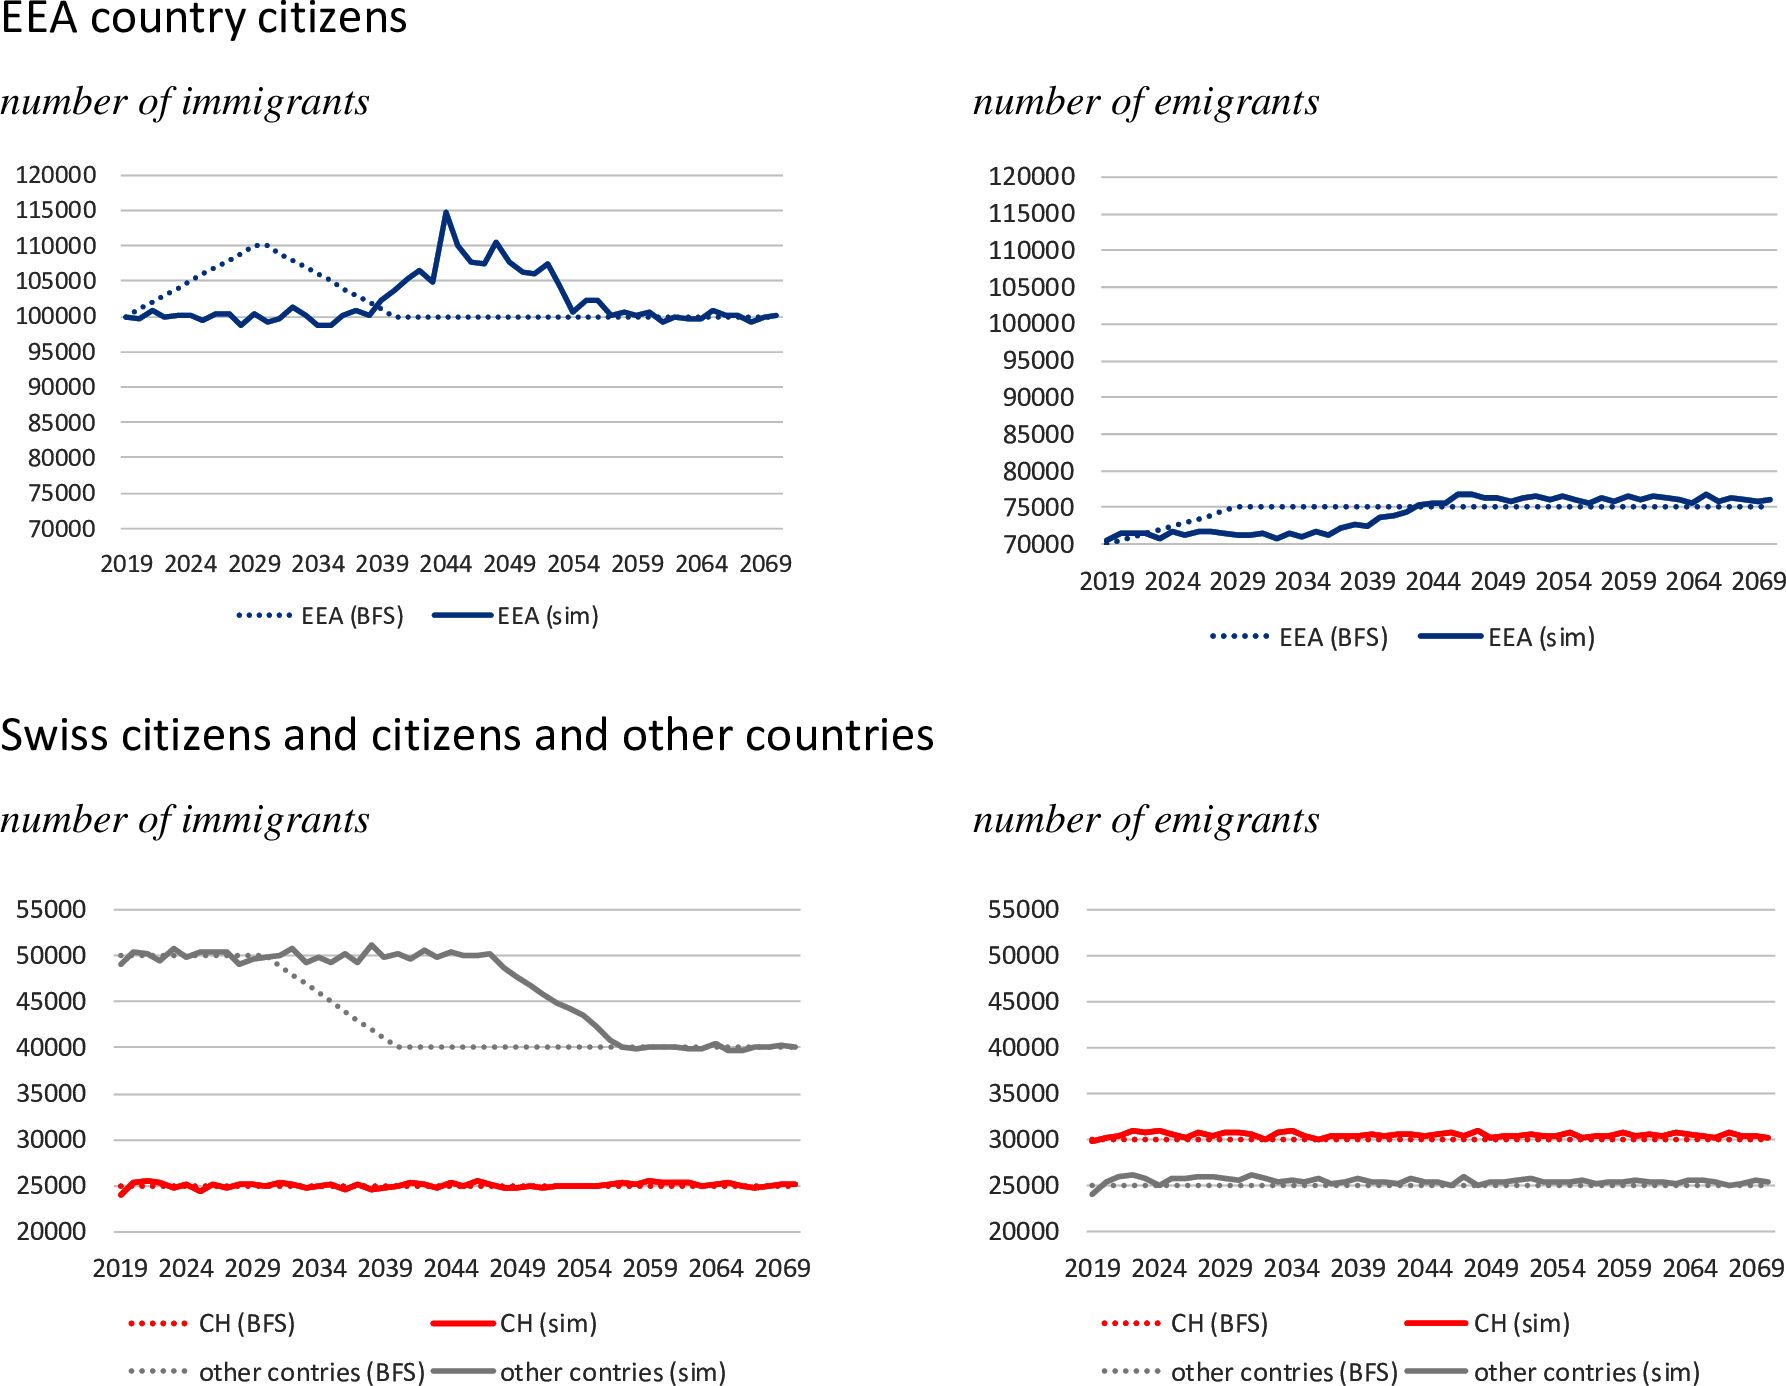
Projected and simulated numbers of migrants by citizenship (2019-2070). Source: Projections by Swiss FSO (2020c). base scenario A-00-2020, own simulations.

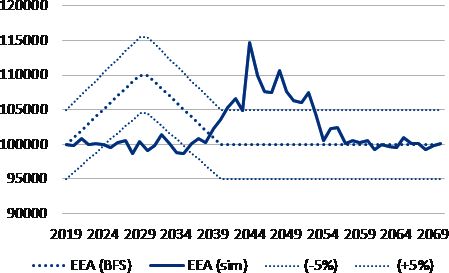
Projected and simulated number of immigrants with EEA citizenship (2019-2070). Source: Projections by Swiss FSO (2020c). base scenario A-00-2020, own simulations.

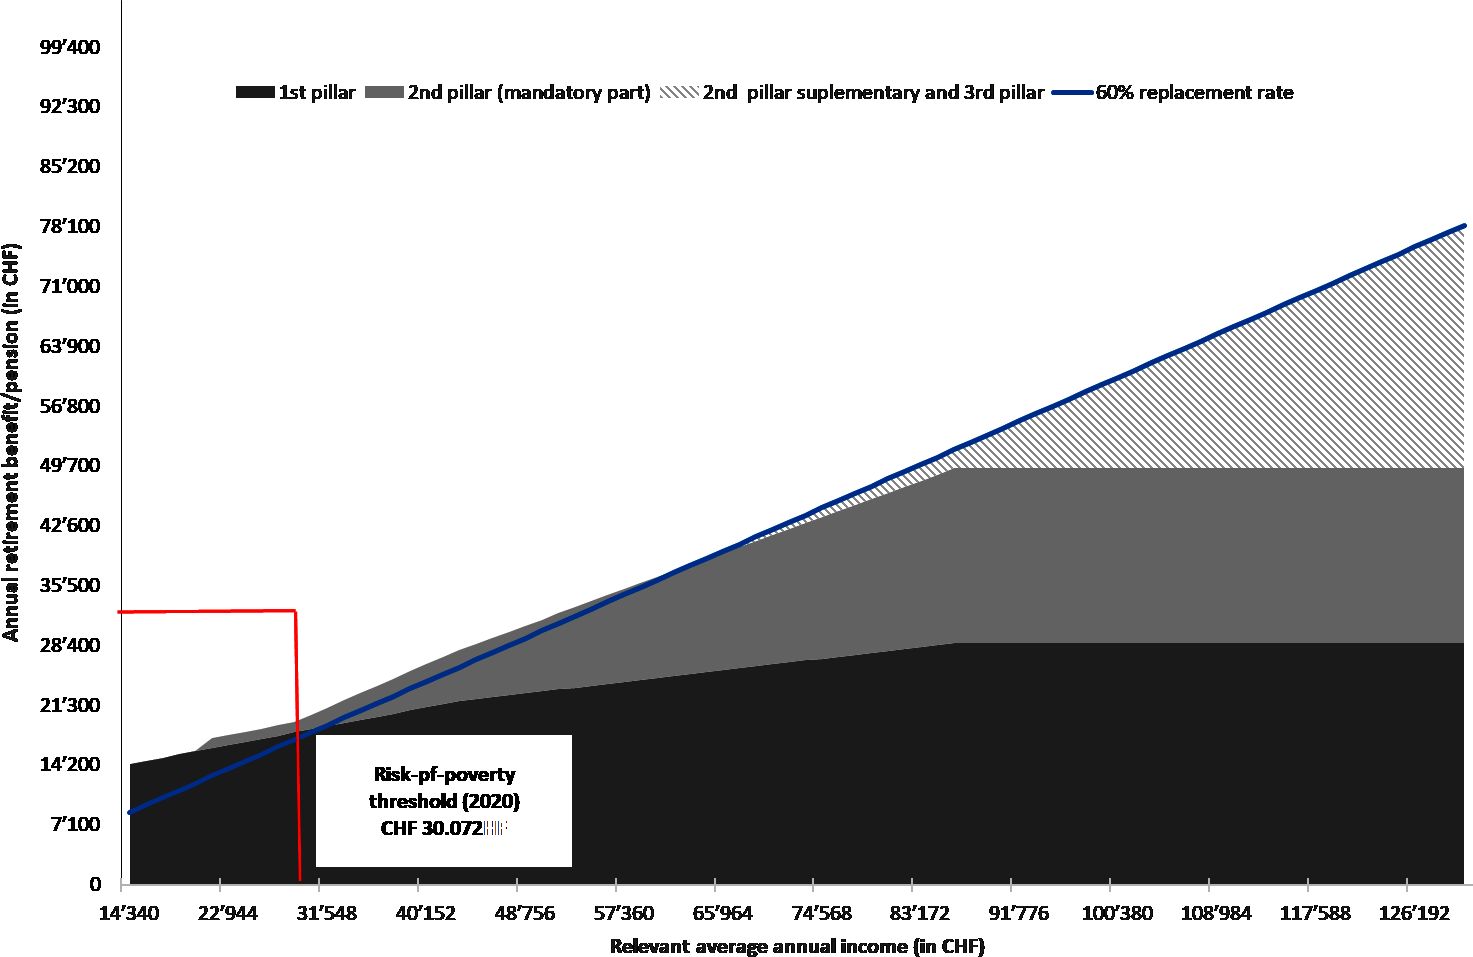
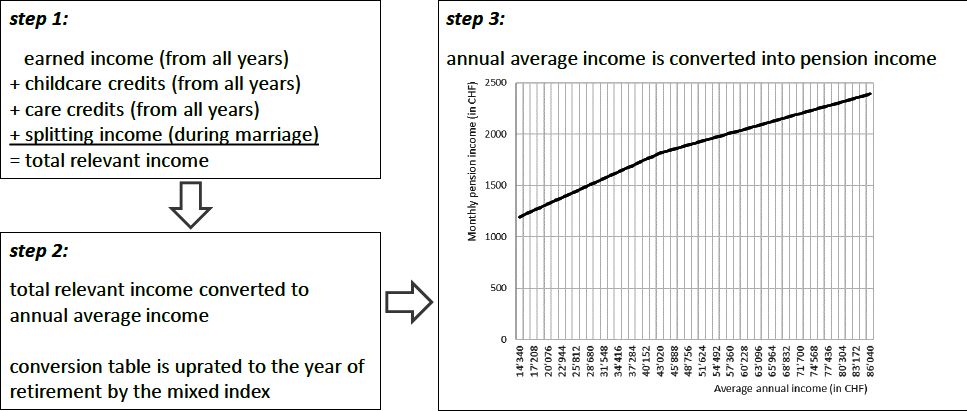
Amount of annual retirement pension per given average annual income. Source: Own computations.

Conversion of earned income and credits to pension income. Source: Own illustration.

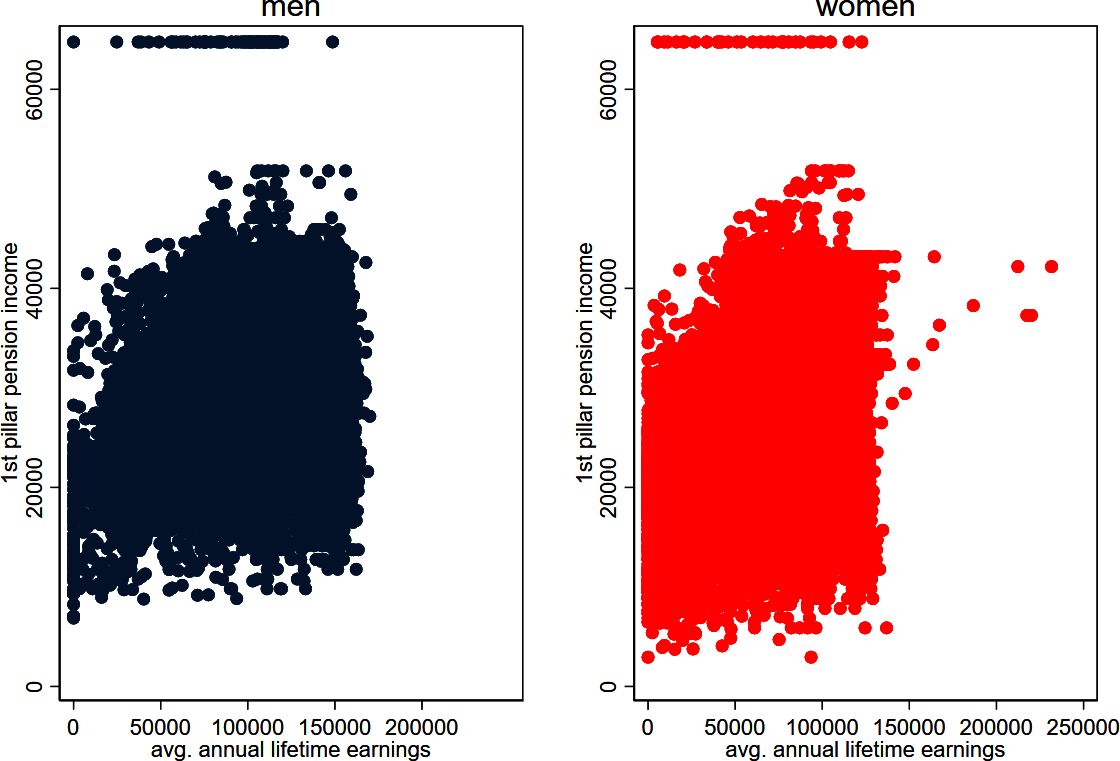
Simulated 1st pillar pension income (all retirees, in 2070). Source: Simulated data, based on SILC 2018. SRA for women: 64, SRA for men: 65 years.

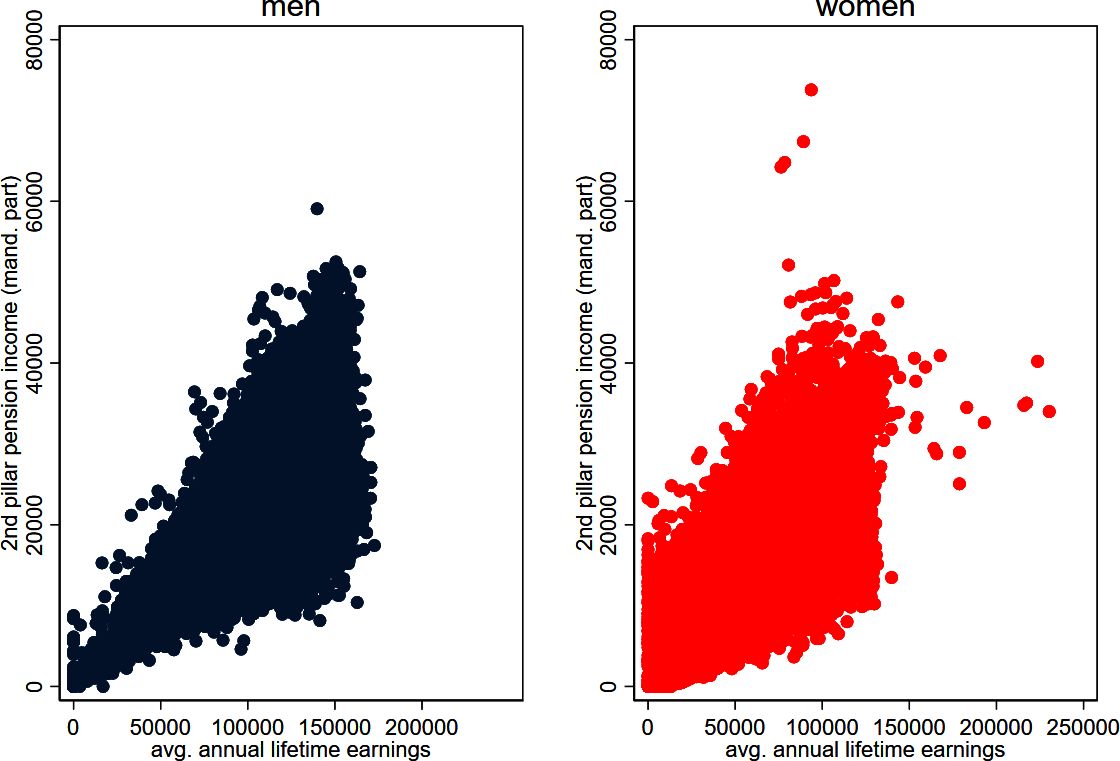
Simulated 2nd pillar pension income (mandatory part, 5.2%, all retires, in 2070). Source: Simulated data, based on SILC 2018.
Tables
Sources used for the alignment process
| alignment | source | data | dimensions | age groups | scenario variants |
|---|---|---|---|---|---|
| mortality | FSO | BEVNAT, ESPOP, STATPOP | gender | year | scenario A-00-2020 |
| births | FSO | BEVNAT, ESPOP, STATPOP | female | year | scenario A-00-2020 |
| population | FSO | BEVNAT, ESPOP, STATPOP | gender | 5-year brackets | scenario A-00-2020 |
| fertility | FSO | BEVNAT, ESPOP, STATPOP | female | year | scenario A-00-2020 |
| marriage | FSO | BEVNAT | gender, civil state | 5-year brackets | |
| divorce | FSO | BEVNAT | gender | 5-year brackets | |
| disability | FSO | IV | gender | 5-year brackets | |
| care | FSO | SGB | gender | year | |
| care giving | FSO | SGB | gender | year | |
| early retirement | FSO | NRS | gender | year | |
| labour market participation | FSO | SAKE | gender | year | |
| part-time | FSO | SAKE | gender | 5-year brackets | 3 categories of PT work |
| unemployment | FSO | SAKE | gender | 5-year brackets | |
| immigration | FSO | STATPOP | gender, nationality | year | scenario A-00-2020 |
| emigration | FSO | STATPOP | gender, nationality | year | scenario A-00-2020 |
-
BEVNAT = Statistik der natürlichen Bevölkerungsbewegung; ESPOP = Statistik des jährlichen Bevölkerungsstandes; STATPOP = Statistik der Bevölkerung und der Haushalte; SAKE = Schweizerische Arbeitskräfteerhebung; IV = IV-Statistik; NRS = Neurentenstatistik; SGB = Schweizerische Gesundheitsbefragung;
1st pillar pension income at SRA (in 2020)
| total (65) | women (64) | men (65) | GPG | |
|---|---|---|---|---|
| mean | 23,285 | 21,090 | 23,357 | 9.7% |
| p25 | 21,240 | 19,764 | 21,240 | 6.9% |
| p50 | 23,892 | 21,240 | 23,892 | 11.1% |
| p75 | 27,984 | 23,892 | 27,984 | 14.6% |
| p75/p25 | 1.32 | 1.21 | 1.32 |
-
Source: New pension statistics: individuals at regular retirement age who received their first pension in 2020 FSO (2022b).
2nd pillar pension income at SRA (in 2020)
| total (65) | women (64) | men (65) | GPG | |
|---|---|---|---|---|
| mean | 25,353 | 15,571 | 25,884 | 39.8% |
| p25 | 12,267 | 6,408 | 12,836 | 50.1% |
| p50 | 20,897 | 12,000 | 21,385 | 43.9% |
| p75 | 32,084 | 20,681 | 32,525 | 36.4% |
| p75/p25 | 2.62 | 3.23 | 2.53 |
-
Source: New pension statistics: individuals at regular retirement age who received their first pension in 2020 FSO (2022b).
1st and 2nd pillar pension income at SRA (in 2020)
| total (65) | women (64) | men (65) | GPG | |
|---|---|---|---|---|
| mean | 49,973 | 38,225 | 50,021 | 23.6% |
| p25 | 36,564 | 28,228 | 36,629 | 22.9% |
| p50 | 46,203 | 34,998 | 46,236 | 24.3% |
| p75 | 58,440 | 44,836 | 58,428 | 23.3% |
| p75/p25 | 1.60 | 1.59 | 1.60 |
-
Source: New pension statistics: individuals at regular retirement age who received their first pension in 2020 FSO (2022b).
Simulated 1st pillar pension income at SRA (2070) – simulation variant with SRA of women of 64
| mean | p25 | p50 | p75 | p75/p25 | |
|---|---|---|---|---|---|
| total population | 37,391 | 33,614 | 38,722 | 42,044 | 1.25 |
| women | 35,682 | 30,781 | 37,283 | 40,672 | 1.32 |
| men | 39,027 | 35,806 | 40,070 | 42,376 | 1.18 |
| GPG | 8.6% | 14.0% | 7.0% | 4.0% | |
| non-immigrants | 37,297 | 33,463 | 38,680 | 41,905 | 1.25 |
| women | 35,642 | 30,711 | 37,179 | 40,642 | 1.32 |
| men | 39,131 | 36,098 | 40,304 | 42,470 | 1.18 |
| GPG | 8.9% | 14.9% | 7.8% | 4.3% | |
| immigrants | 38,138 | 34,821 | 39,055 | 42,193 | 1.21 |
| women | 36,526 | . | . | . | . |
| men | 38,534 | 35,057 | 39,276 | 42,193 | 1.20 |
| GPG | 5.2% | . | . | . |
-
Source: own computations. SRA for men 65 years and women 64 years. Quantile incomes of female immigrants are not reported due to the relatively small number of cases in the simulated dataset.
Simulated 1st pillar pension income at SRA (2070) – simulation variant with SRA of women of 65
| mean | p25 | p50 | p75 | p75/p25 | |
|---|---|---|---|---|---|
| total population | 37,500 | 33,963 | 38,754 | 42,193 | 1.24 |
| women | 35,752 | 31,281 | 37,540 | 40,604 | 1.30 |
| men | 39,154 | 35,751 | 40,800 | 42,780 | 1.20 |
| GPG | 8.7% | 12.5% | 8.0% | 5.1% | |
| non-immigrants | 37,377 | 33,652 | 38,734 | 42,143 | 1.25 |
| women | 35,704 | 31,248 | 37,517 | 40,612 | 1.30 |
| men | 39,212 | 35,879 | 41,049 | 42,781 | 1.19 |
| GPG | 8.9% | 12.9% | 8.6% | 5.1% | |
| immigrants | 38,422 | 35,255 | 39,045 | 42,193 | 1.20 |
| women | 36,649 | . | . | . | . |
| men | 38,888 | 35,311 | 39,621 | 42,760 | 1.21 |
| GPG | 5.8% | . | . | . |
Simulated 2nd pillar pension income at SRA (2070) – simulation variant with SRA of women of 65 and a constant conversion rate of 6.8%
| mean | p25 | p50 | p75 | p75/p25 | |
|---|---|---|---|---|---|
| total population | 30,315 | 20,112 | 29,624 | 41,393 | 2.06 |
| women | 23,636 | 14,484 | 24,329 | 32,084 | 2.22 |
| Men | 36,636 | 27,052 | 39,030 | 45,180 | 1.67 |
| GPG | 35.5% | 46.5% | 37.7% | 29.0% | |
| non-immigrants | 29,961 | 19,808 | 29,183 | 40,985 | 2.07 |
| women | 23,684 | 14,482 | 24,457 | 32,079 | 2.22 |
| Men | 36,851 | 27,229 | 39,142 | 45,287 | 1.66 |
| GPG | 35.7% | 46.8% | 37.5% | 29.2% | |
| immigrants | 32,972 | 21,690 | 35,132 | 42,679 | 1.97 |
| women | 22,731 | . | . | . | . |
| Men | 35,662 | 24,683 | 38,469 | 43,400 | 1.76 |
| GPG | 36.3% | . | . | . |
-
Source: own computations. SRA for men and women: 65 years. Second pillar: Mandatory pension, conversion rate: 6.8%. Quantile incomes of female immigrants are not reported due to the relatively small number of cases in the simulated dataset.
Simulated 1st and 2nd pillar pension income at SRA (2070) – simulation variant with SRA of women of 65 and a constant conversion rate of 6.8%
| mean | p25 | p50 | p75 | p75/p25 | |
|---|---|---|---|---|---|
| total population | 67,815 | 55,341 | 68,940 | 83,238 | 1.50 |
| women | 59,387 | 47,277 | 61,608 | 71,631 | 1.52 |
| Men | 75,789 | 65,098 | 79,654 | 86,900 | 1.33 |
| GPG | 21.6% | 27.4% | 22.7% | 17.6% | |
| non-immigrants | 67,338 | 54,787 | 68,612 | 82,786 | 1.51 |
| women | 59,388 | 47,126 | 61,813 | 71,576 | 1.52 |
| Men | 76,064 | 65,608 | 80,013 | 87,232 | 1.33 |
| GPG | 21.9% | 28.2% | 22.7% | 17.9% | |
| immigrants | 71,394 | 58,799 | 73,576 | 85,190 | 1.45 |
| women | 59,381 | . | |||
| Men | 74,550 | 62,037 | 77,676 | 85,843 | 1.38 |
| GPG | 20.3% | . | . | . |
-
Source: own computations. SRA for men and women: 65 years. Second pillar: Mandatory pension, conversion rate: 6.8%. Quantile incomes of female immigrants are not reported due to the relatively small number of cases in the simulated dataset.
Simulated mandatory part of the 2nd pillar pension income at SRA (in 2070) – simulation variant with decreasing conversion rate.
| mean | p25 | p50 | p75 | p75/p25 | |
|---|---|---|---|---|---|
| total population | 23,196 | 15,380 | 22,653 | 31,654 | 2.06 |
| women | 18,102 | 11,234 | 18,634 | 24,552 | 2.19 |
| men | 28,016 | 20,687 | 29,847 | 34,549 | 1.67 |
| GPG | 35.4% | 45.7% | 37.6% | 28.9% | |
| non-immigrants | 22,926 | 15,217 | 22,316 | 31,342 | 2.06 |
| women | 18,139 | 11,177 | 18,703 | 24,538 | 2.20 |
| men | 28,180 | 20,822 | 29,932 | 34,631 | 1.66 |
| GPG | 35.6% | 46.3% | 37.5% | 29.1% | |
| immigrants | 25,220 | 16,587 | 26,866 | 32,637 | 1.97 |
| women | 17,414 | . | . | . | . |
| men | 27,271 | 18,875 | 29,417 | 33,188 | 1.76 |
| GPG | 36.1% | . | . | . |
-
Source: own computations. SRA for men and women: 65 years. Second pillar: Mandatory pension, conversion rate: 5.2%.
1st and 2nd pillar pension income at SRA (2070)- simulation variant with SRA of 65 and a decreasing conversion rate
| mean | p25 | p50 | p75 | p75/p25 | |
|---|---|---|---|---|---|
| total population | 60,696 | 50,463 | 61,552 | 73,592 | 1.46 |
| women | 53,854 | 44,037 | 55,854 | 64,218 | 1.46 |
| men | 67,169 | 58,774 | 70,312 | 76,465 | 1.30 |
| GPG | 19.8% | 25.1% | 20.6% | 16.0% | |
| non-immigrants | 60,303 | 50,166 | 61,309 | 73,124 | 1.46 |
| women | 53,843 | 43,754 | 55,931 | 64,213 | 1.47 |
| men | 67,393 | 59,131 | 70,643 | 76,683 | 1.30 |
| GPG | 20.1% | 26.0% | 20.8% | 16.3% | |
| immigrants | 63,643 | 53,860 | 65,319 | 74,649 | 1.39 |
| women | 54,063 | . | . | . | . |
| men | 66,159 | 56,152 | 68,558 | 75,304 | 1.34 |
| GPG | 18.3% | . | . | . |
-
Source: own computations. SRA for men and women: 65 years. Second pillar: Mandatory pension, conversion rate: 5.2%.
2nd pillar pension income at SRA (2070) – simulation variant with a constant conversion rate of 6.8% and a SRA of women of 64
| mean | p25 | p50 | p75 | p75/p25 | |
|---|---|---|---|---|---|
| total population | 30,131 | 20,105 | 29,444 | 40,591 | 2.02 |
| women | 23,603 | 15,225 | 24,280 | 32,511 | 2.14 |
| men | 36,380 | 26,979 | 37,596 | 44,621 | 1.65 |
| GPG | 35.1% | 43.6% | 35.4% | 27.1% | |
| non-immigrants | 29,752 | 19,445 | 29,043 | 40,460 | 2.08 |
| women | 23,585 | 15,225 | 24,264 | 32,511 | 2.14 |
| men | 36,584 | 27,099 | 37,873 | 44,645 | 1.65 |
| GPG | 35.5% | 43.8% | 35.9% | 27.2% | |
| immigrants | 33,160 | 24,437 | 34,486 | 42,095 | 1.72 |
| women | 23,975 | . | . | . | . |
| men | 35,415 | 26,370 | 36,713 | 44,180 | 1.68 |
| GPG | 32.3% | . | . | . |
-
Source: own computations. SRA for men 65 yreas and women 64 years. Second pillar: Mandatory pension, conversion rate: 6.8%.
Data and code availability
The Swiss Statistics on Income and Living Conditions (SILC)-data is available at the website of the Swiss Federal Statistical Office (FSO): https://www.bfs.admin.ch/bfs/de/home/statistiken/wirtschaftliche-soziale-situation-bevoelkerung/erhebungen/silc.html
The code used in the creation of this model is freely accessible at the following link: https://liam2.plan.be/ and on Github: https://github.com/liam2/liam2. We commit to preserving code for a period of no less than five years following publication of the manuscript, and to providing reasonable assistance to requests for clarification and replication.