A Micro-Macro Interactive Simulation Model of the Swedish Economy
Cite this article
as: G. Eliasson; 2024; A Micro-Macro Interactive Simulation Model of the Swedish Economy; International Journal of Microsimulation; 17(2); 60-128.
doi: 10.34196/ijm.00292
- Article
- Figures and data
- Jump to
Figures
Figure 1
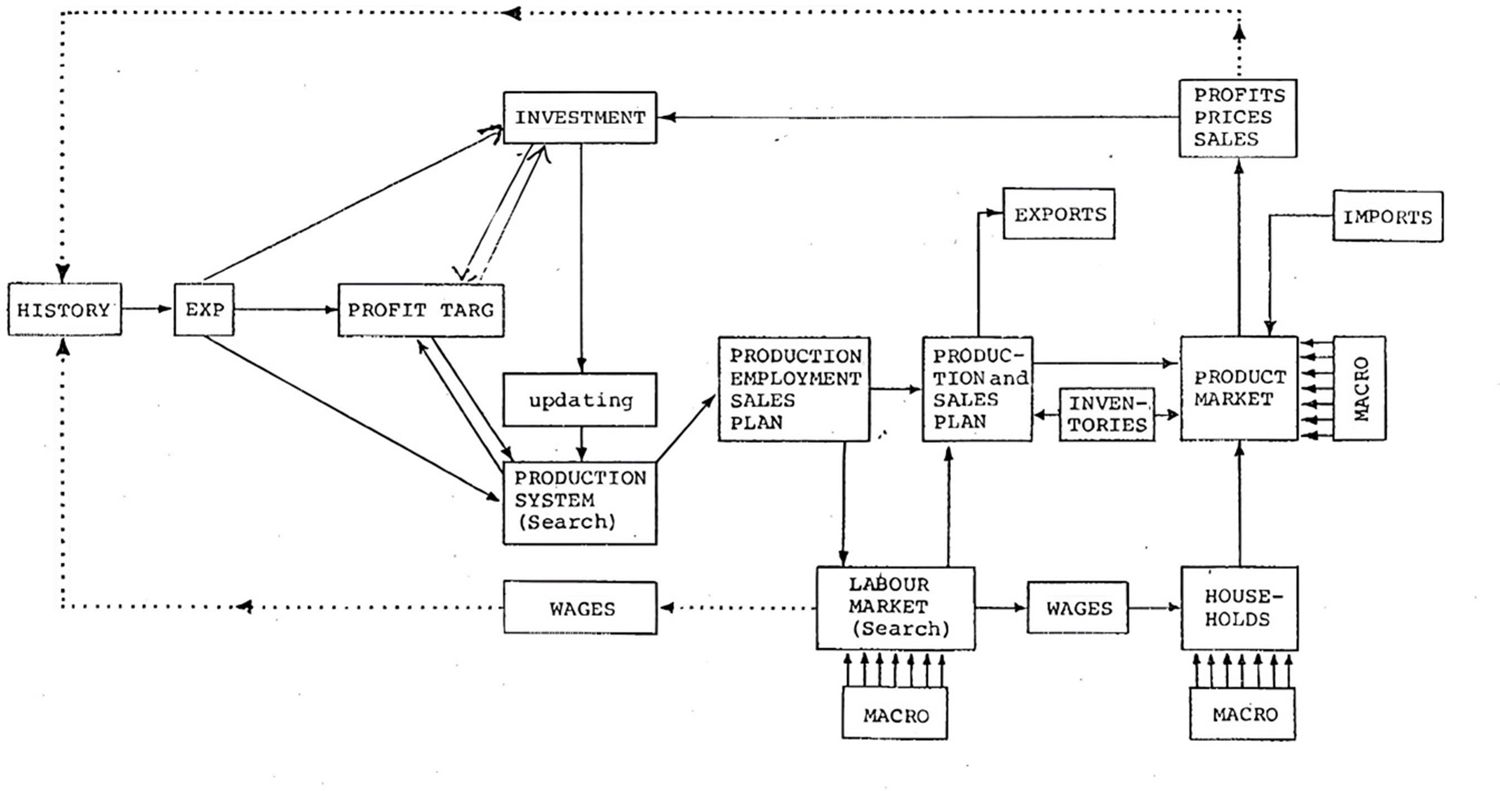
Business decision system (one firm).
Figure 2
Production system.
Figure 3
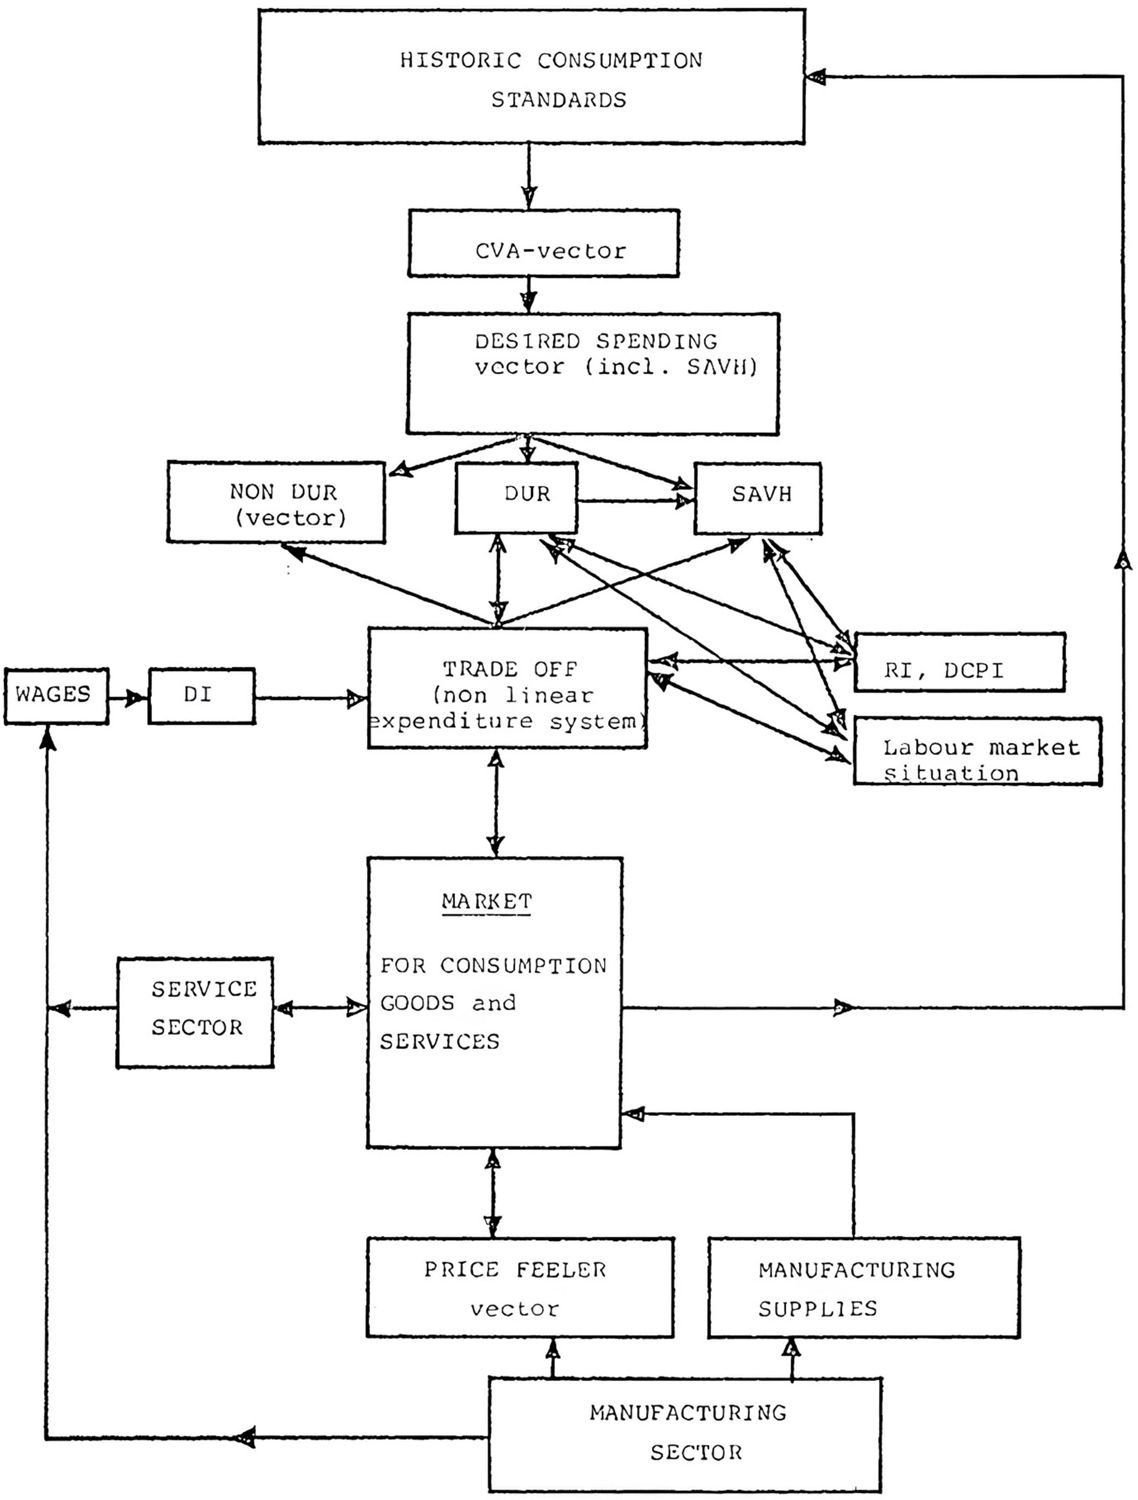
Consumption system and prod-markets.
Figure 4
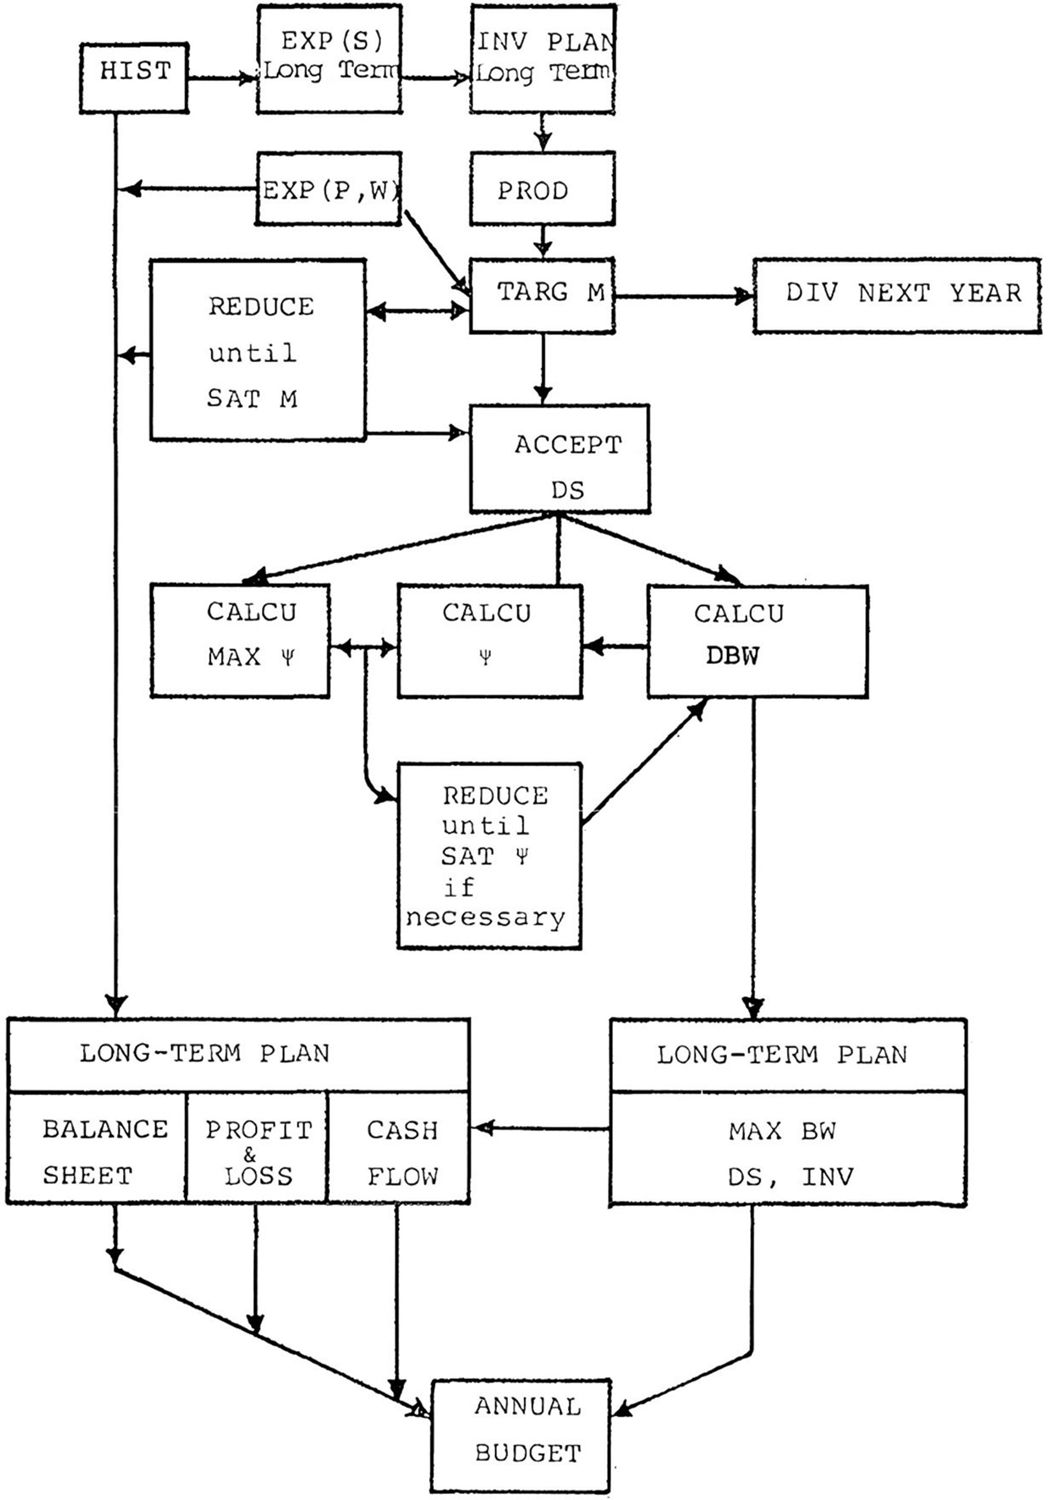
Long-term plan.
Figure 5
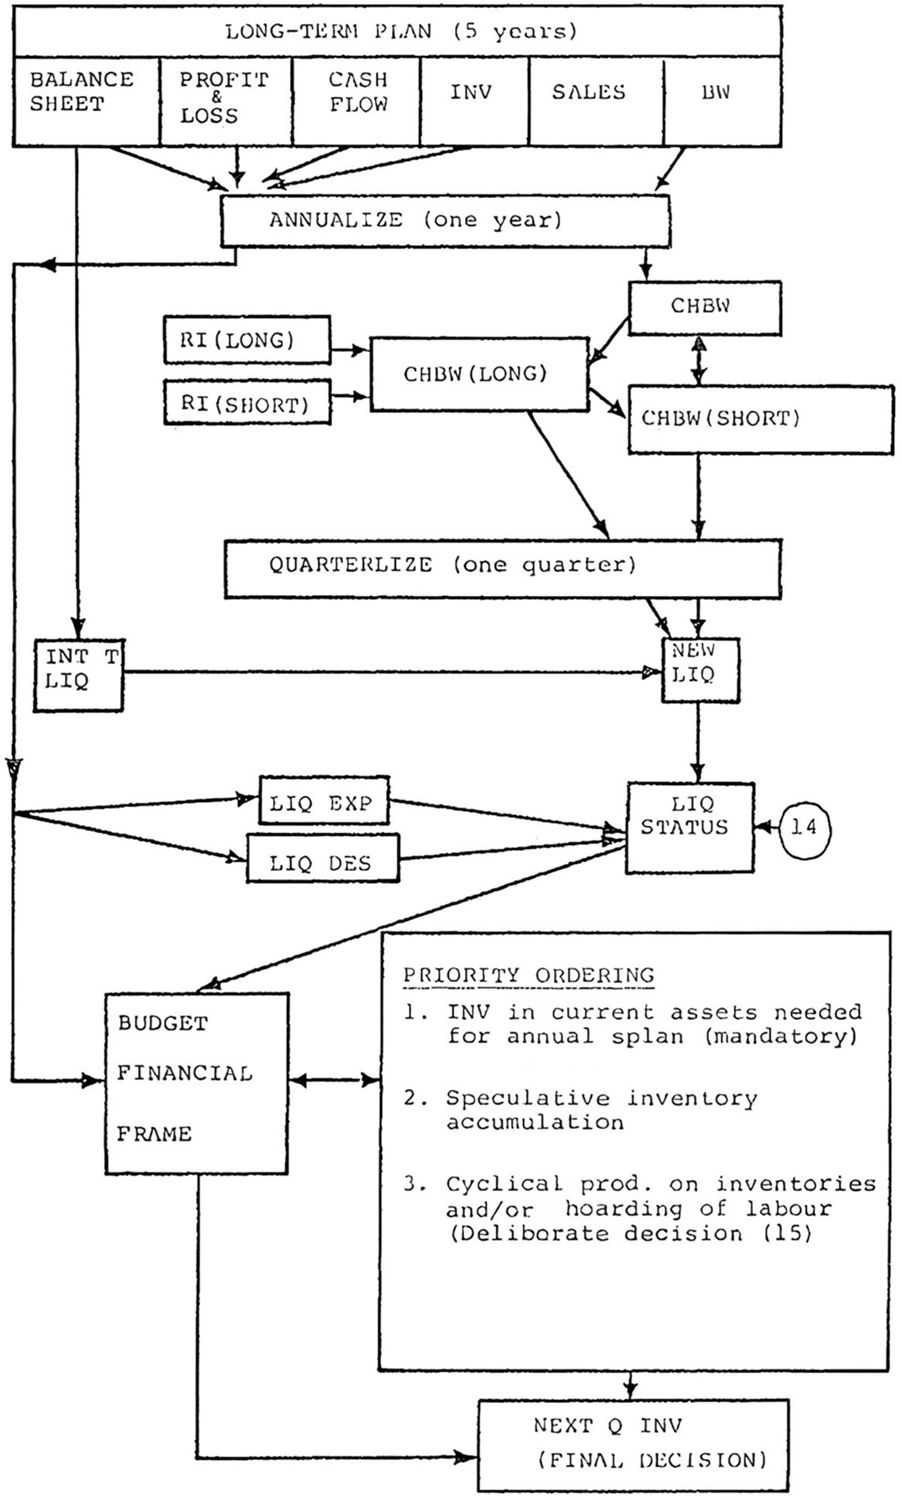
INV-decision.
Figure 6

Trend comparison (MACRO – INDUSTRY), annual (change in percent).
Figure 7
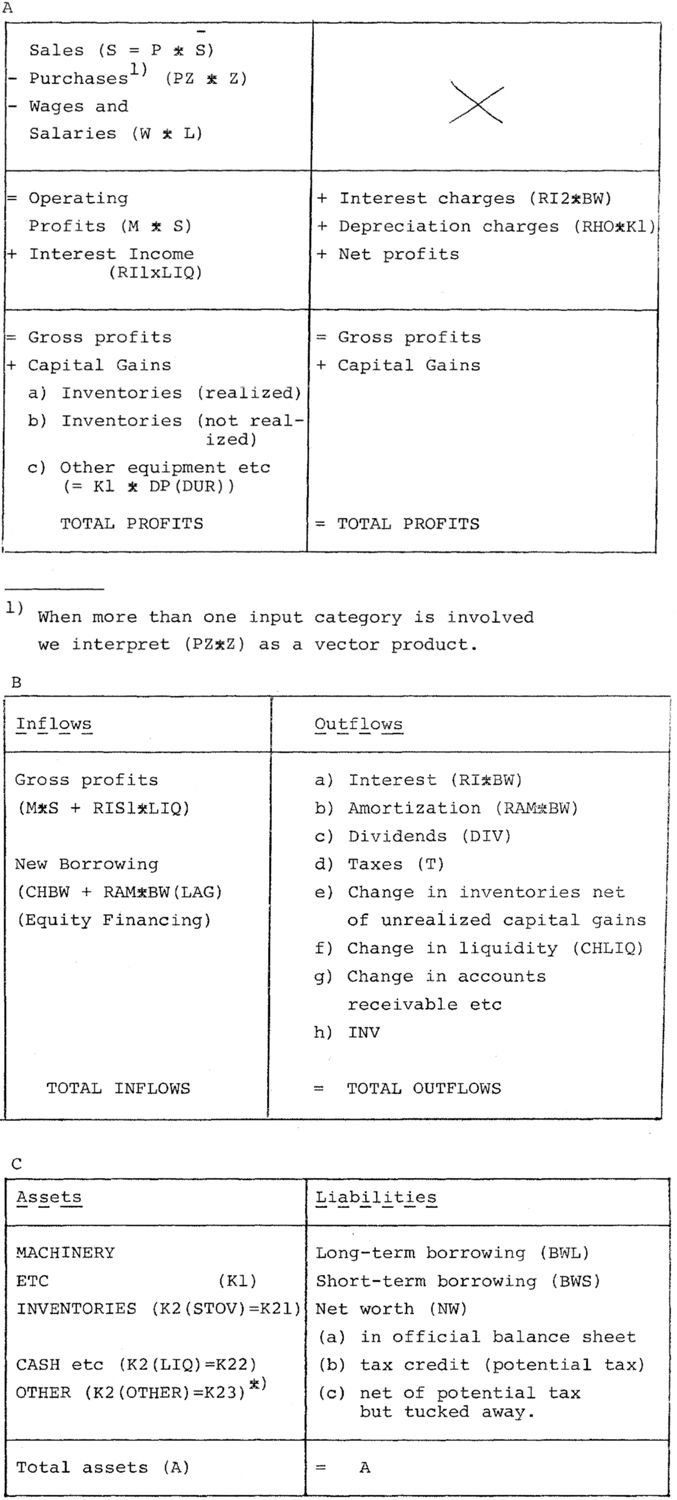
(A) Profit and loss statement. (B) Cash flows. (C) Balance sheet.
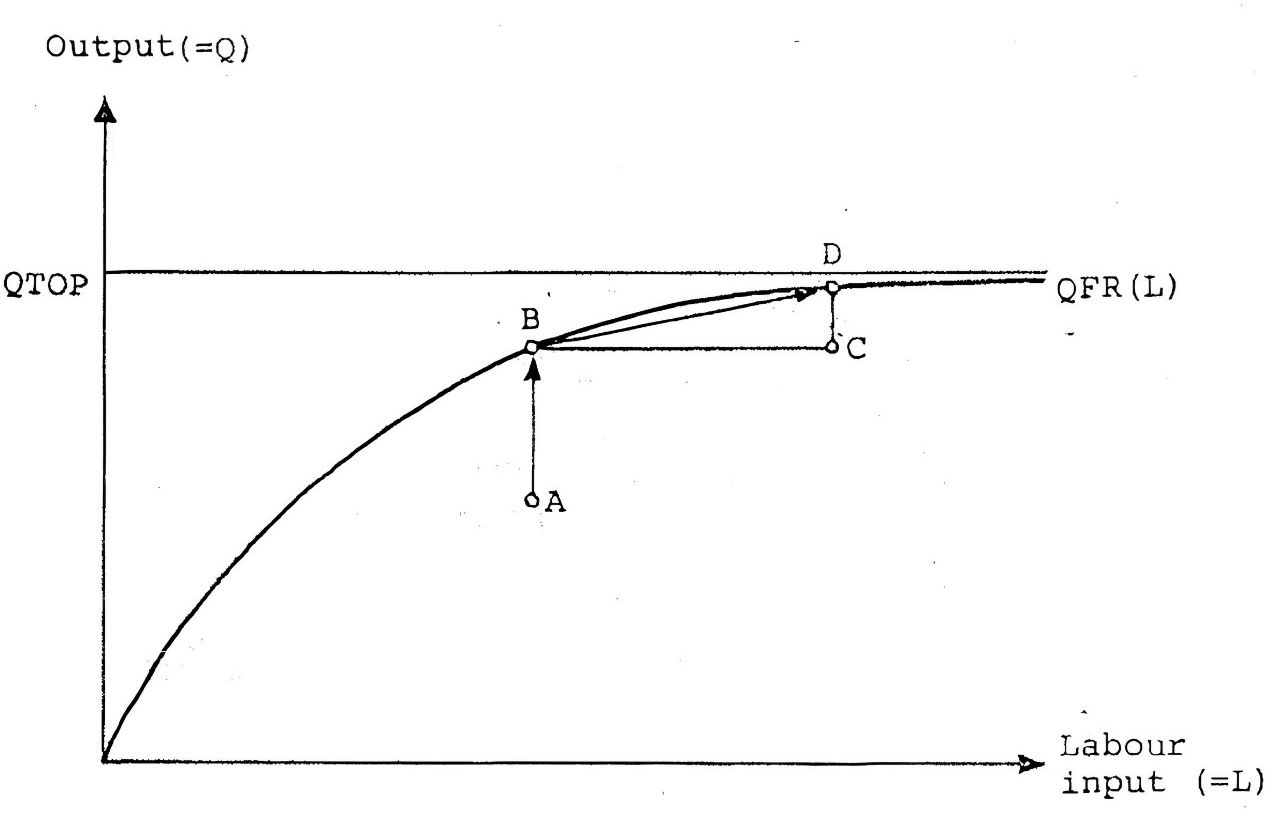
Figure 8
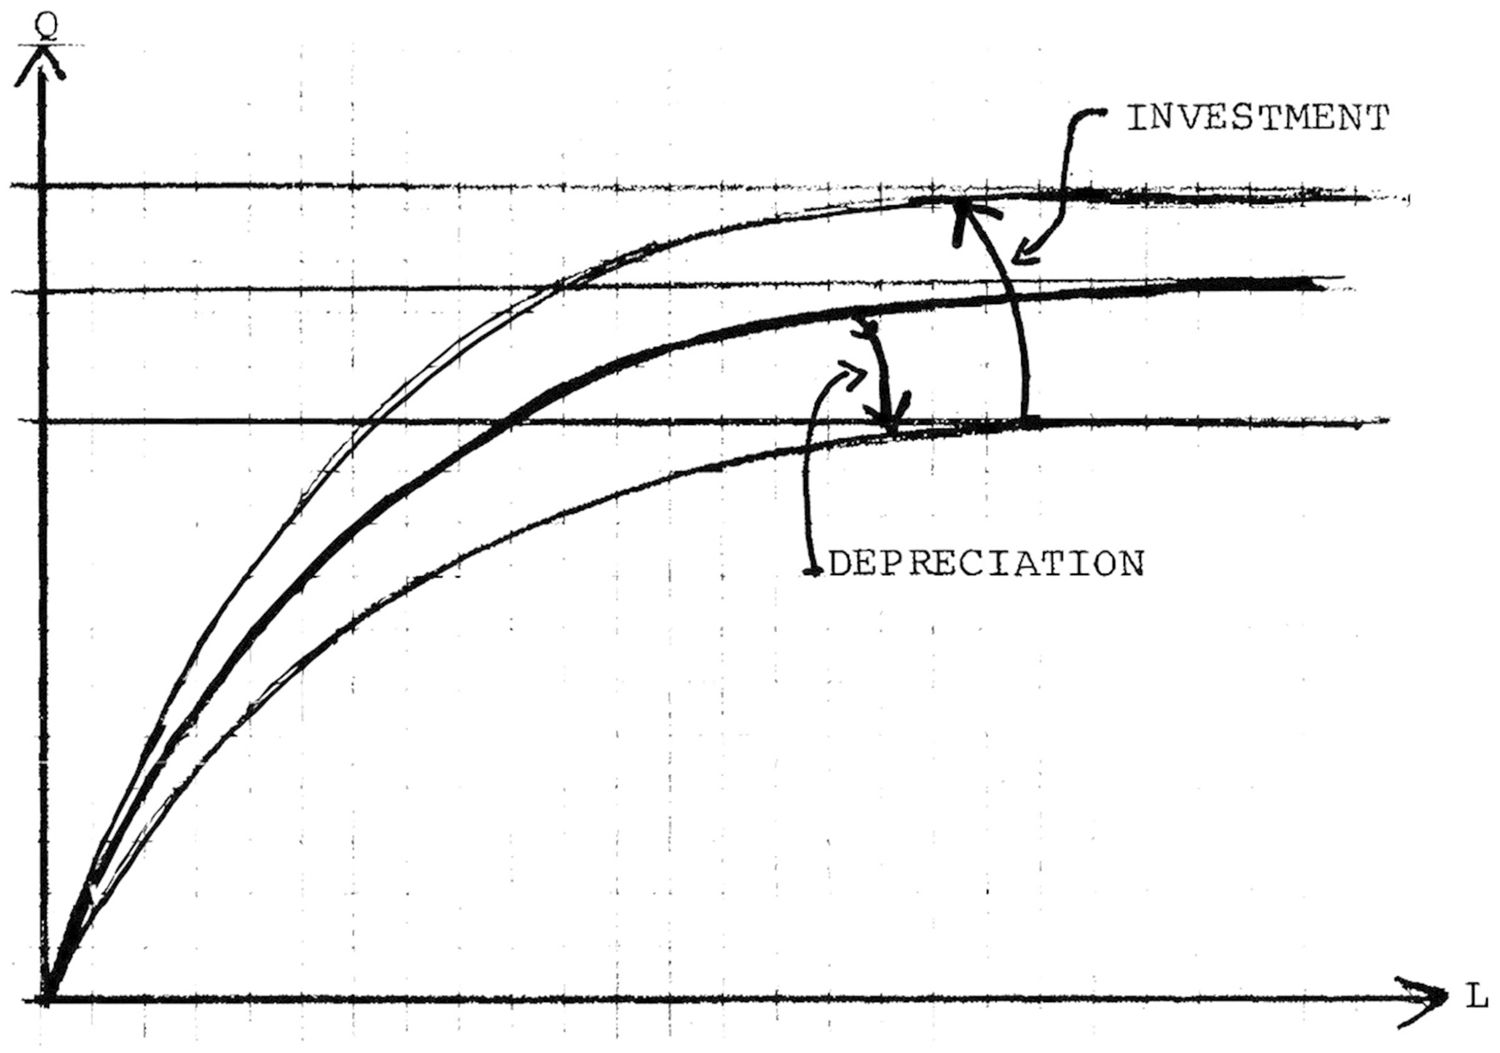
Shifting of production possibilities curve because of depreciation and new investments in best practice technologies.
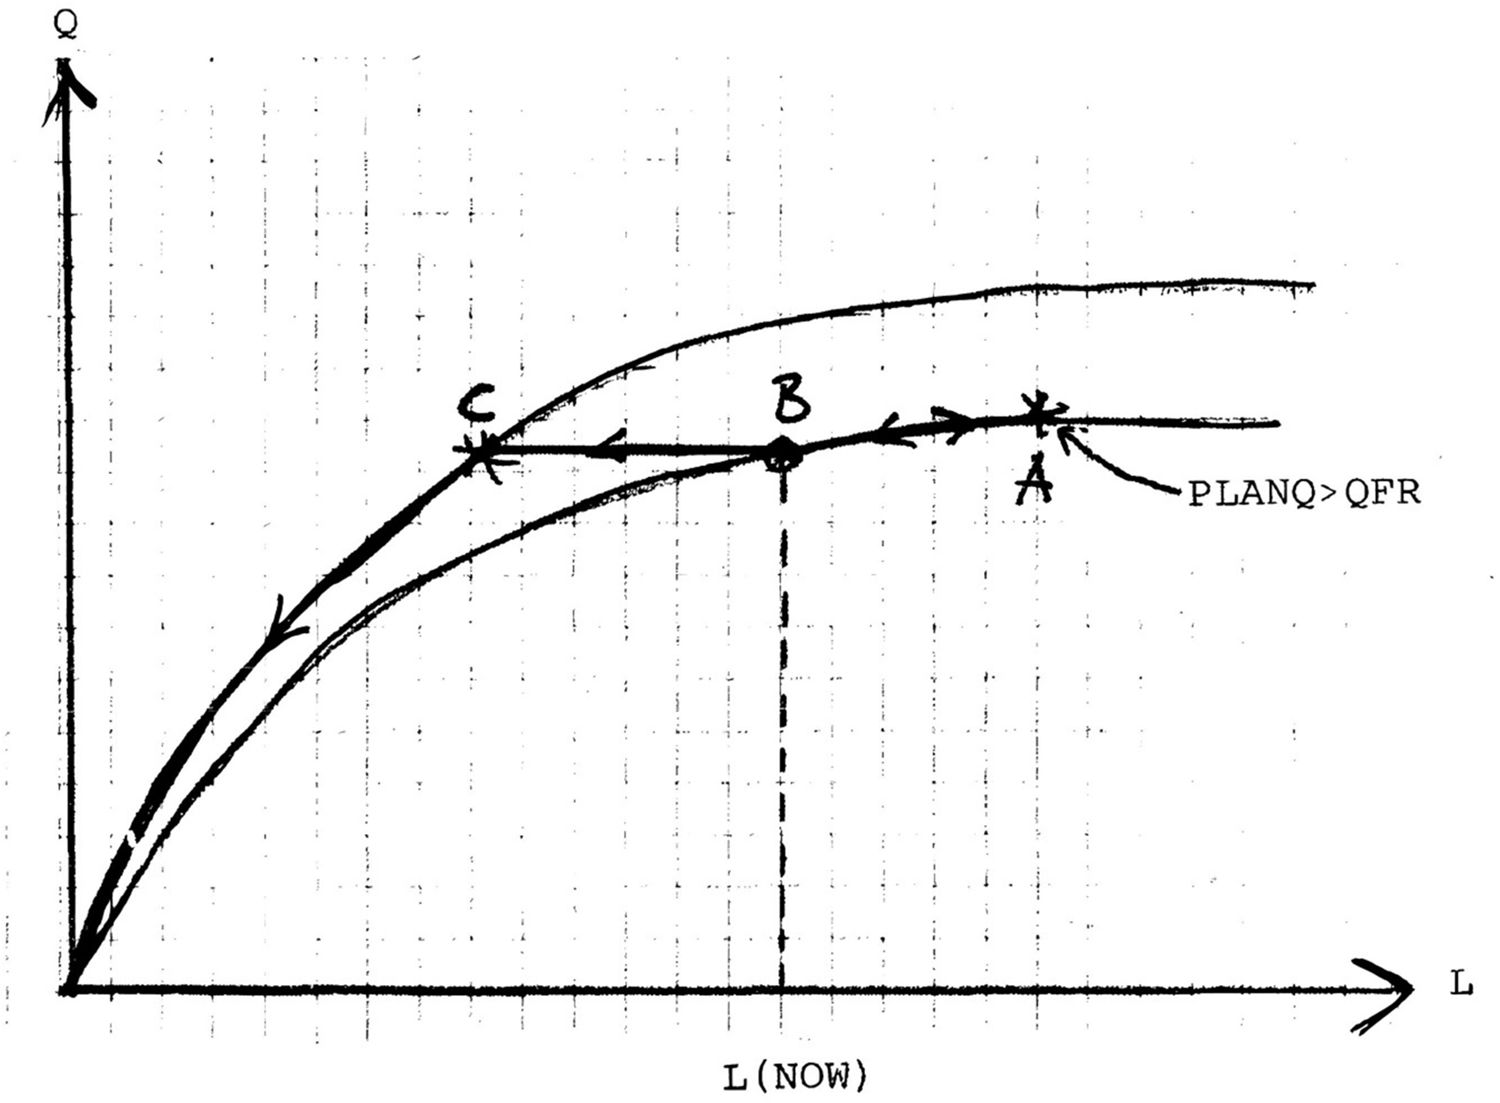
Figure 12
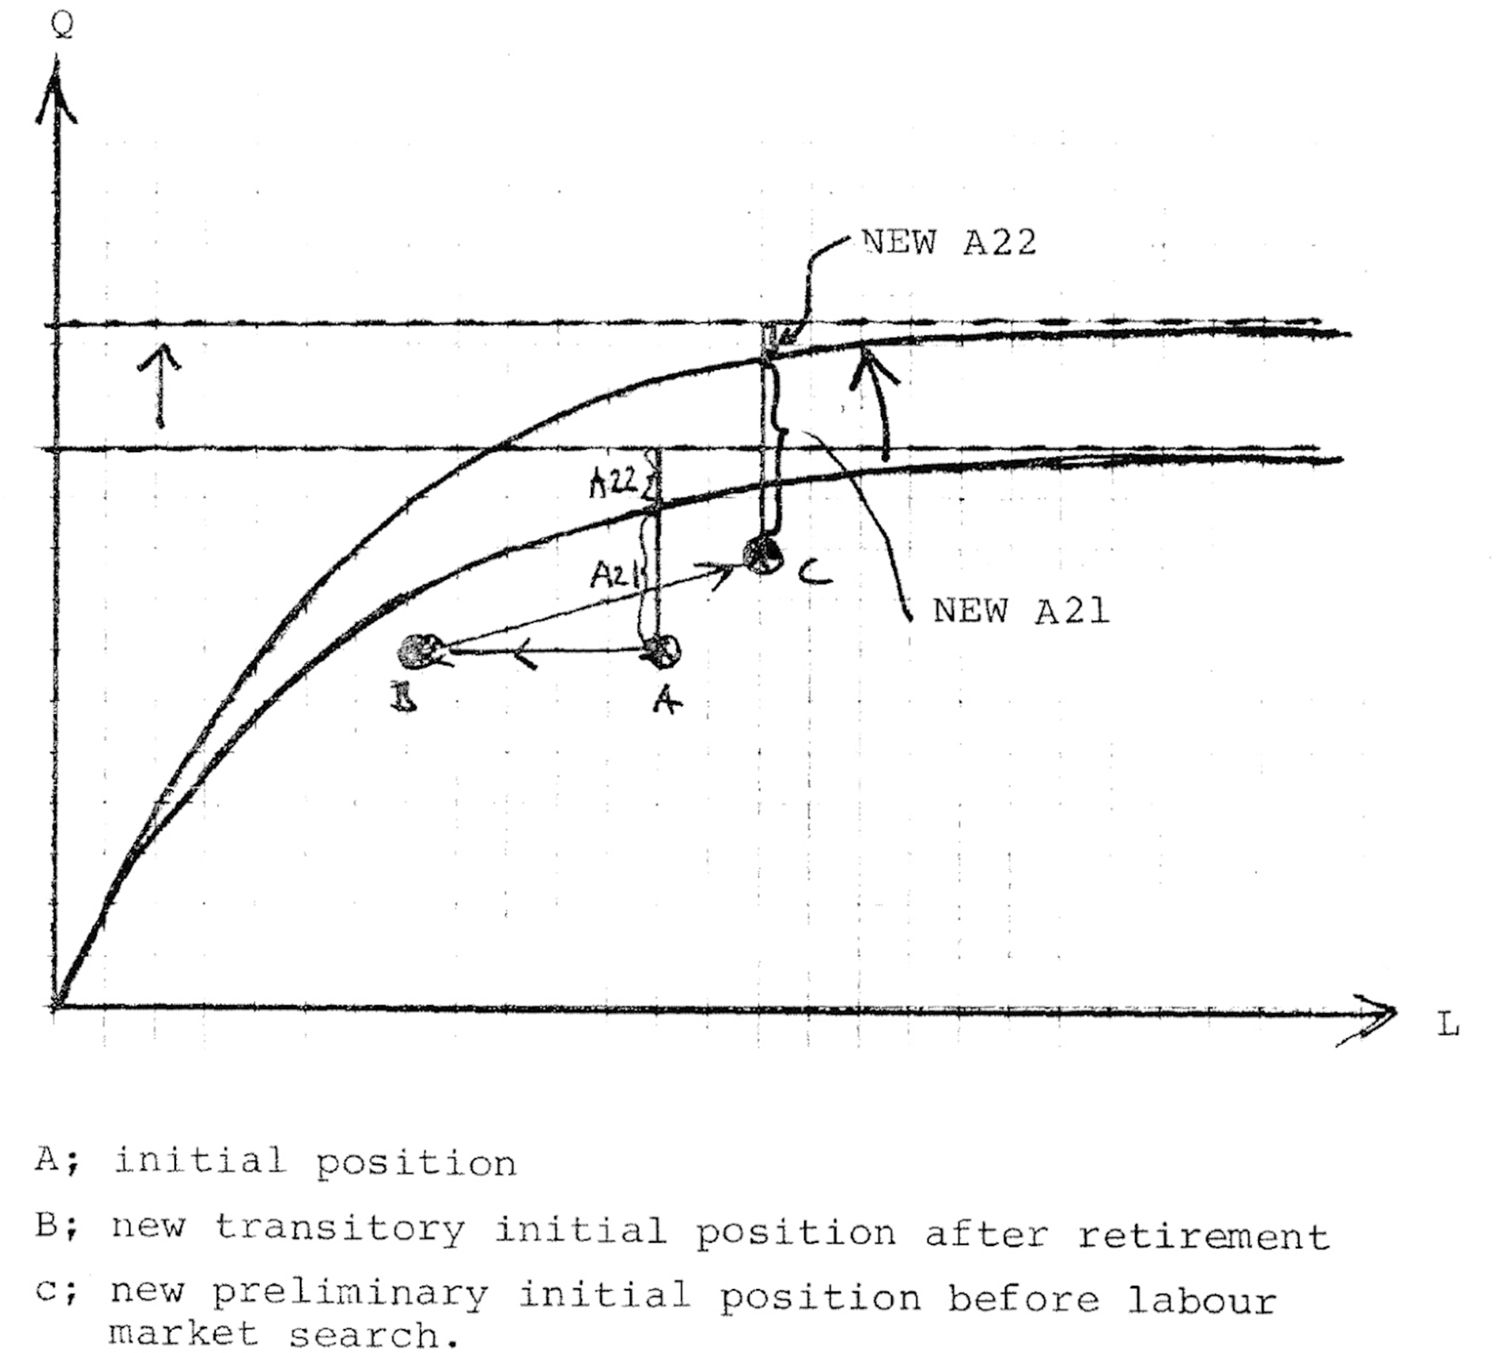
(A) Initial position, (B) new transitory initial position after retirement; (C) new preliminary initial position before labour market search.
Figure 9
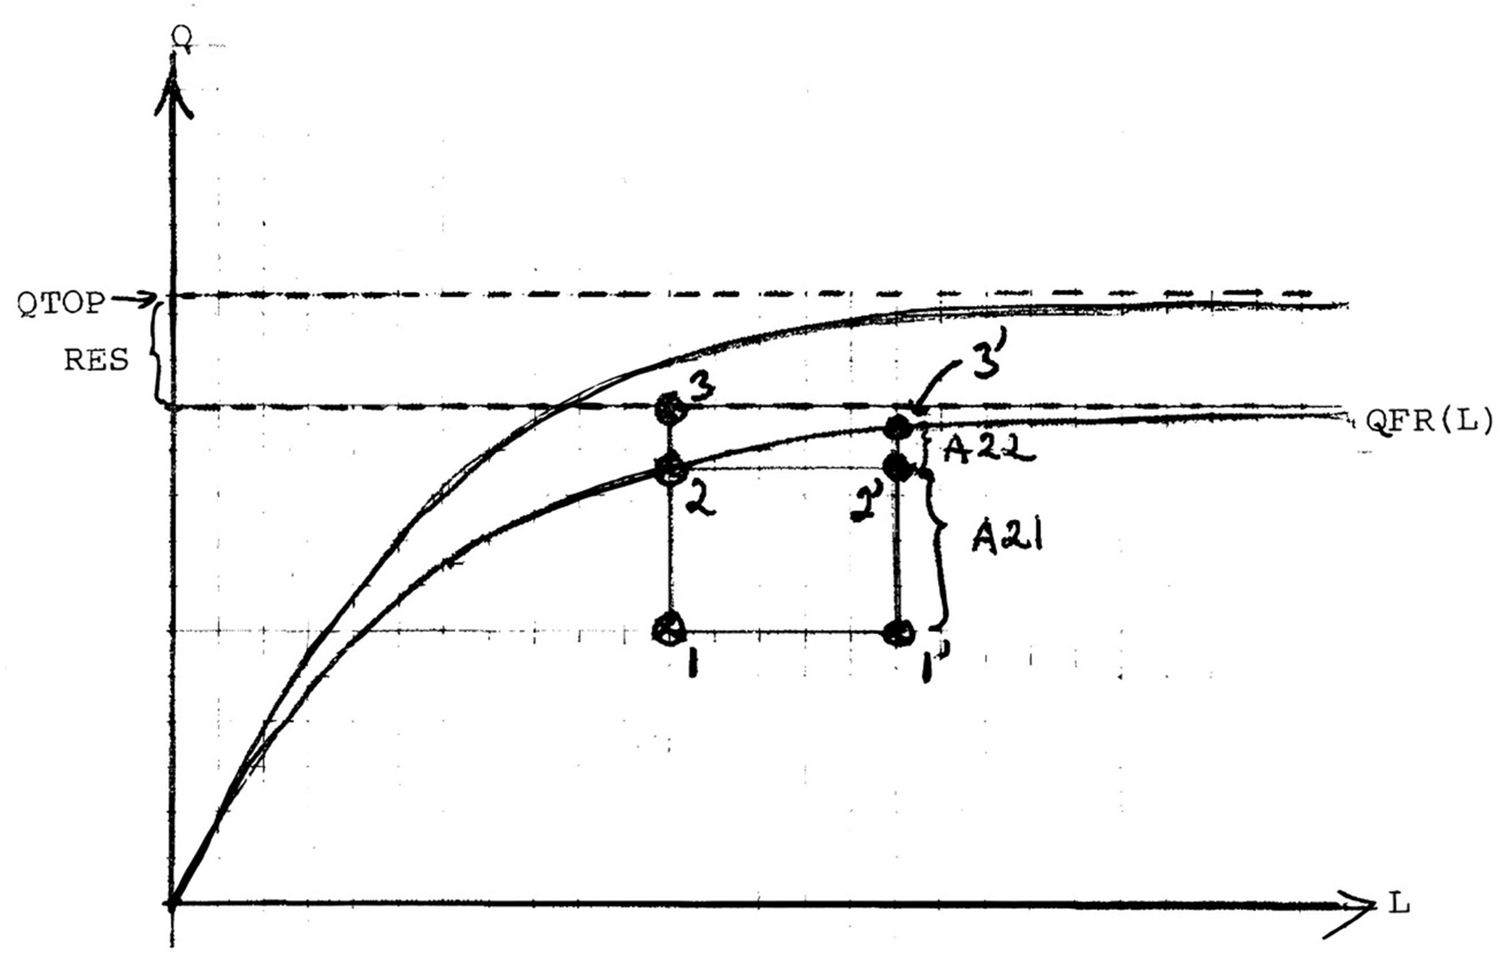
Figure 10
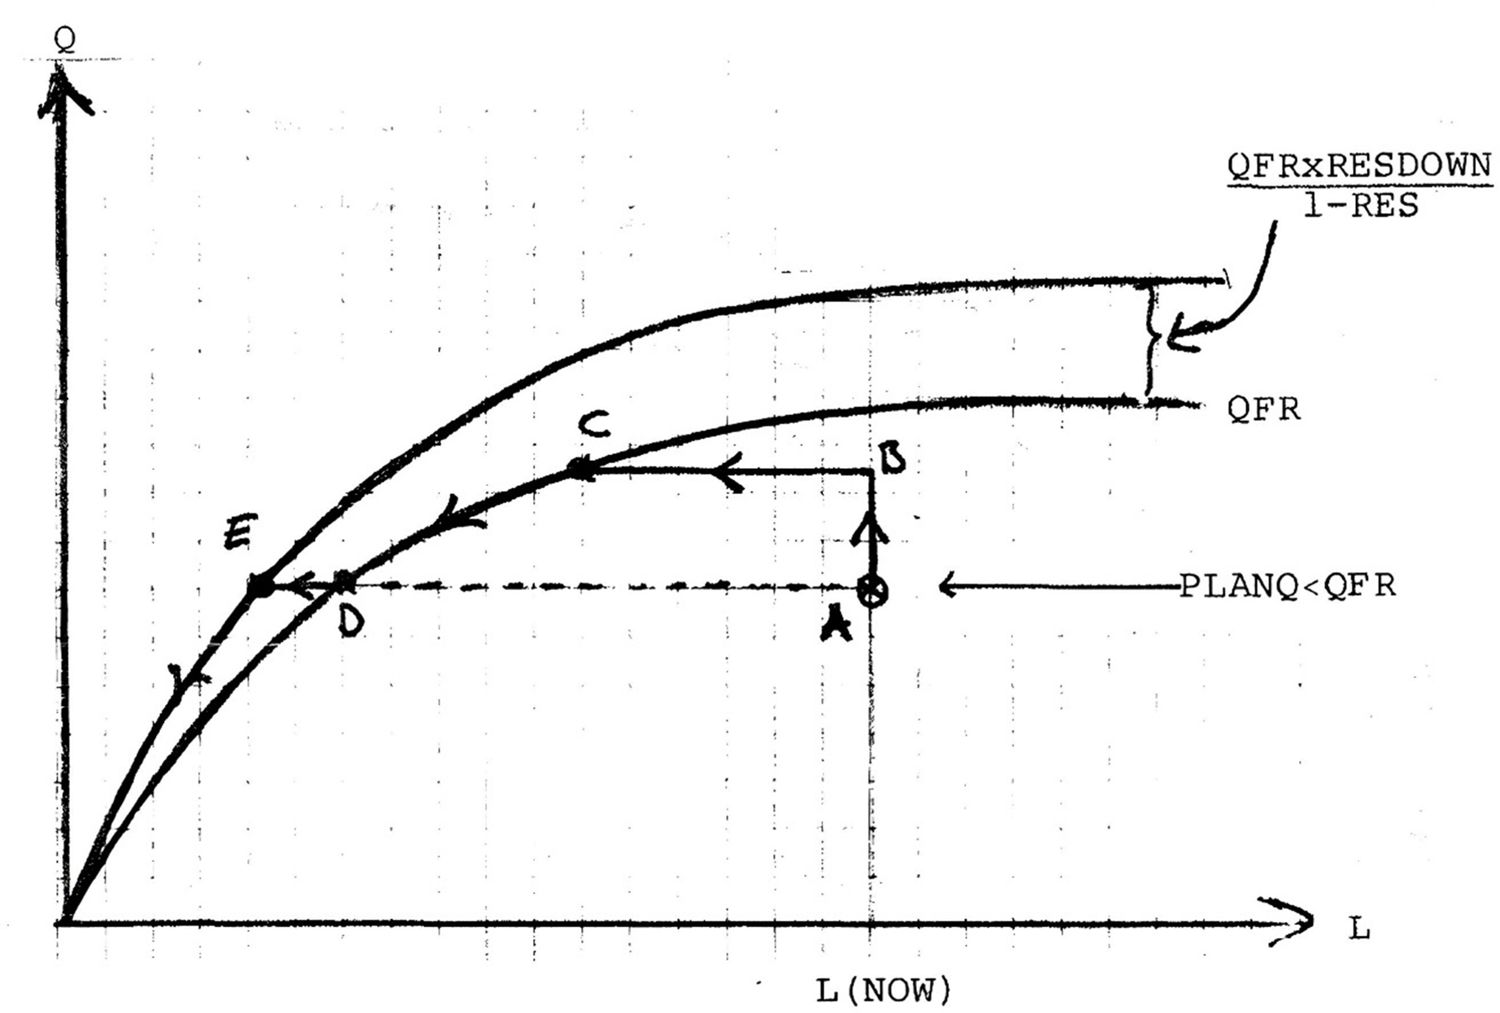
Figure 11
Tables
Table 1
Model modules
| Business system (manufacturing firm model) |
|---|
| Operations planning (short term) |
| Production system |
| Inventory system |
| Expectations |
| Profit targeting |
| (Cash management) |
| Investment-Financing (long term) |
| Investment plan |
| Long term borrowing |
| Household consumption (macro) |
| Buying/consuming |
| Saving |
| Service sector (macro) |
| Government sector (macro) |
| Employment |
| Taxes/transfers |
| Economic policy |
| Note: So far only Government employment has been entered into model, and government production is assumed to be proportional to government employment . |
| Other production sectors (six sectors from input/output table) |
| Foreign connections |
| Prices - exogenous |
| Exchange rate exogenous |
| Interest rate - exogenous |
| Export volume- endogenous for each firm |
| Import volume- endogenous (macro) |
| Trade assets and debts (endogenous by firm) |
| Markets |
| Labor market |
| Product market |
| Financial market (a bank) |
| Exogenous variables |
| Foreign prices: one for each of the four sub markets of manufacturing |
| Foreign Interest rate: |
| Technology: The rate of change in labor productivity of new investment vintages. |
| The labor force. |
Table 2
Step wise master criteria for statistical fit.
| A. | Certain macro industry trends approximately right (Within 1/2 percent) over a 20 year period (see trend chart Figure 6). |
| B. | Same trends for the four sub industries. |
| Same criteria for 5-year period. | |
| C. | Micro. Compatible with “stylized facts”. No obvious “misbehavior”. |
| D. | Identify (time reaction) parameters that work uniquely (or roughly so) on cyclical behavior around trends. |
Table 3
Calibration procedure (trend fitting)
| 1. Find first reference case. Assess its performance in terms of A in Table 3. |
| 2a). Perform sensitivity analysis with a view to finding new specifications that improve performance in terms of A. |
| 2b). Ditto with a view to investigating the numerical properties of the model within a normal operating range (analysis). Check and correct if properties can be regarded as unrealistic. |
| 2c). For each new reference case, repeat the whole analysis of 2 b) systematically. The purpose is to ensure, each time, that the new reference case is a better specification and not a statistical coincidence and that the properties of the system revealed by the sensitivity analysis above, and judged to be desirable, are presented in the new reference case. |
| 2d). Subject model to strong shocks. Check for “misbehavior”. (For instance, fast explosive or strong contractive economy wide behavior that have been generated by external shocks that may be considered extreme. If so, ponder the possibility that the model may generate empirically reasonable surprises that have not yet been observed. |
| 3. Define new and better references case. Repeat from 2. |
-
*
Find first reference case. Assess its performance in terms of A in Table 2.
Download links
A two-part list of links to download the article, or parts of the article, in various formats.