Modelling Financial Derivatives Markets in a Firm Based Evolutionary Macro Model (MOSES)-On the market integration of computing, communications, and financial services
- Industrial Economics/Dynamics, Kungliga Tekniska Högskolan (KTH), Sweden
- Middle East Technical University (METU), Turkey
- Article
- Figures and data
- Jump to
Figures
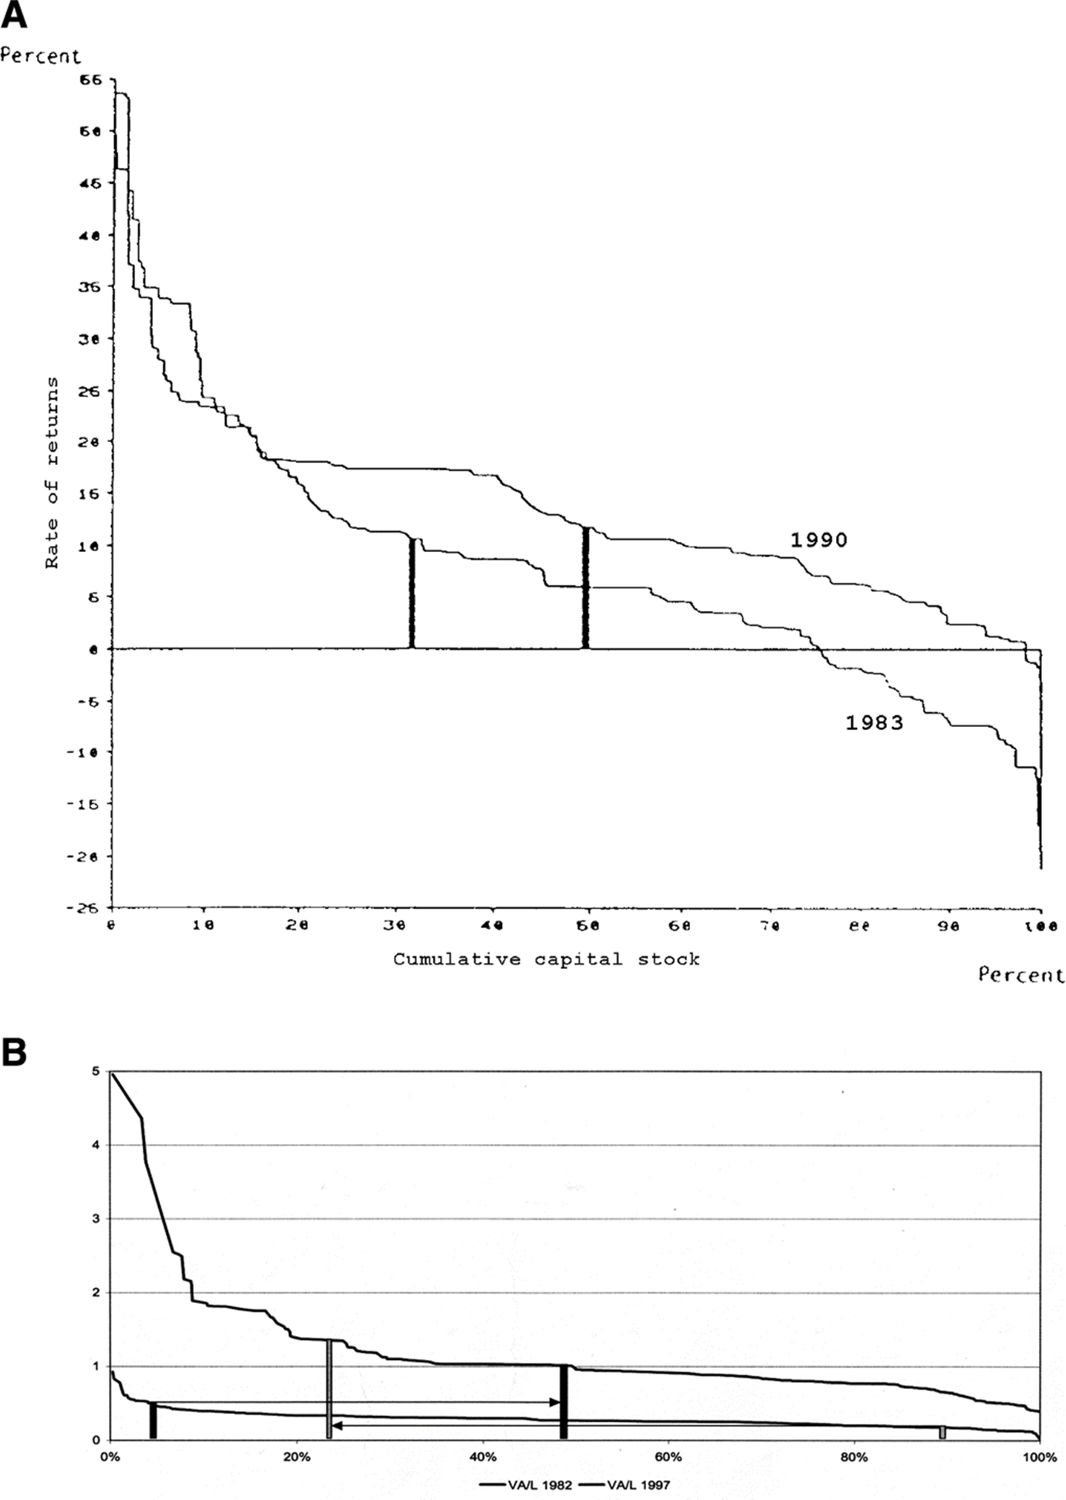
A) A Salter Ranking of Rates of Return to Capital in Swedish Manufacturing 1983 and 1990. Note: The figure ranks nominal rates of return over the nominal market interest rate across Swedish manufacturing firms 1983 and 1990. The vertical columns show the position of the same firm each year. The width of the column measures the size of the capital of the firm in percent of that for all manufacturing. Its rate of return has increased between 1983 and 1990, but it has lost in ranking. Its relative size has increased between 1983 and 1990. Source: Eliasson (1991a) and Albrecht et al. (1992): Moses Database.
Tables
The four mechanisms of schumpeterian creative destruction and economic growth
| 1. Entrepreneurial competition (entry) enforces |
| 2. Reorganization of incumbent agents and/or |
| 3. Rationalization, or |
| 4. Death (exit) |
-
Source: Eliasson (1993) and Eliasson (1996a).
A break down of economic systems effects
| 1. Rationalization of information processing given the manufacturing and distribution structure (“doing the same thing but faster”) |
| 2. Reorganizing information and communications flows, given manufacturing and distribution structures (e.g. through ”speeding up inventory turnover”) |
| 3. Optimizing manufacturing and distribution flows over a given structure |
| 4. Reorganizing physical flows to exploit information and communications technology (dynamic systems effects) |
| 5. Simultaneous reorganization of physical and information and communications flows (Integrated production) |
-
Source: (Eliasson, 1996c).
Outcomes of 60-year experiments
| Experiment | GDP | New firms | Exits | Number of firms on horizon | ||||
|---|---|---|---|---|---|---|---|---|
| E0000 | (7165) | 7164 | (132) | 132 | (93) | 93 | (264) | 264 |
| E0010 | (7922) | 6816 | (126) | 112 | (98) | 91 | (253) | 246 |
| E0100 | (8579) | 7779 | (117) | 123 | (105) | 99 | (237) | 249 |
| E0110 | (10001) | 7978 | (111) | 125 | (99) | 105 | (237) | 245 |
| E1000 | (5923) | 9098 | (126) | 118 | (137) | 197 | (214) | 146 |
| E1010 | (6113) | 4017 | (116) | 105 | (133) | 145 | (208) | 185 |
| E1100 | (5927) | 5097 | (?) | 128 | (?) | 231 | (?) | 122 |
| E1101 | (?) | 7980 | (156) | 132 | (202) | 206 | (179) | 151 |
| E1110 | (5193) | 3624 | (130) | 129 | (100) | 231 | (255) | 123 |
| E1111 | (?) | 5803 | (?) | 114 | (?) | 127 | (?) | 212 |
| E1200 | (4446) | 4746 | (137) | 170 | (230) | 199 | (132) | 196 |
| E1210 | (5955) | 4498 | (129) | 124 | (143) | 200 | (211) | 149 |
| E1001 | (9728) | 8721 | (124) | 122 | (141) | 110 | (208) | 237 |
| E1011 | (6394) | 5704 | (120) | 119 | (102) | 88 | (243) | 256 |
| E1201 | (6736) | 7932 | (122) | 123 | (130) | 120 | (217) | 228 |
| E1211 | (5159) | 5422 | (125) | 117 | (124) | 133 | (226) | 209 |
| E2000 | (?) | 4969 | (?) | 110 | (?) | 242 | (?) | 93 |
| E2010 | (?) | 4487 | (?) | 150 | (?) | 288 | (?) | 87 |
| E2011 | (?) | 5545 | (?) | 121 | (?) | 160 | (?) | 186 |
| E2001 | (?) | 7009 | (?) | 142 | (?) | 169 | (?) | 198 |
| E2100 | (?) | 4191 | (?) | 133 | (?) | 253 | (?) | 105 |
| E2200 | (4136) | 4143 | (154) | 158 | (277) | 280 | (102) | 103 |
| E2110 | (?) | 4532 | (?) | 154 | (?) | 266 | (?) | 113 |
| E2210 | (3601) | 4953 | (192) | 188 | (303) | 264 | (124) | 149 |
| E2101 | (?) | 6092 | (?) | 123 | (?) | 155 | (?) | 193 |
| E2201 | (5636) | 6689 | (138) | 145 | (191) | 187 | (172) | 183 |
| E2111 | (?) | 5691 | (?) | 114 | (?) | 191 | (?) | 148 |
| E2211 | (6220) | 5518 | (137) | 157 | (223) | 214 | (139) | 168 |
-
Initial number of firms, always = 225.
-
Note: Numbers within brackets are the results from same experiments conducted in Taymaz (1999). The two sets of experiments are identical except for the initial state year which has been moved up a couple of years in this paper, to allow statistical errors in the initial state (because of taxonomic differences between Planning Survey data and National Accounts data in the new C& C industry (Eliasson and Johansson, 1999 to sort themselves out in the markets of the MOSES model economy. For how to interpret these statistical error problems, see Albrecht (1992), and the text below. Apparently, they affect the relative outcomes of the experiments.
Stochastic R&D Choices
| Experiment | GNP | Enter | Exit | Number of firms on the horizon |
|---|---|---|---|---|
| E(0000) | 1842 | 143 | 93 | 275 |
| E(1201) | 4955 | 121 | 217 | 129 |
| E(2201) | 3297 | 135 | 169 | 191 |
-
Initial stock of firms, always = 225.
Insider Experiments
| Exp | No insider | Insider rob. 1% | Insider prob. 10% | ||||||
|---|---|---|---|---|---|---|---|---|---|
| GNP | Entry | Exit | GNP | Entry | Exit | GNP | Entry | Exit | |
| E1201 | 3688 | 583 | 178 | 4429 | 412 | 181 | 4287 | 423 | 180 |
| E1200 | 2828 | 485 | 226 | 2754 | 587 | 245 | 3499 | 581 | 241 |
| E1211 | 3609 | 424 | 170 | 3161 | 482 | 191 | 4899 | 483 | 194 |
| E2201 | 2789 | 496 | 238 | 3546 | 500 | 285 | 3086 | 528 | 255 |
| E1101 | 4704 | 398 | 140 | 4734 | 611 | 117 | 3973 | 373 | 136 |
| E1001 | 4374 | 414 | 99 | 4430 | 480 | 122 | 4597 | 466 | 91 |