Firm Turnover and the Rate of Macro Economic Growth: Simulating the Macroeconomic Effects of Schumpeterian Creative Destruction
- The Ratio Institute (and The Royal Institute of Technology), Sweden
- Department of Economics, Turkey
Cite this article
as: G. Eliasson, D. Johansson, E. Taymaz; 2024; Firm Turnover and the Rate of Macro Economic Growth: Simulating the Macroeconomic Effects of Schumpeterian Creative Destruction; International Journal of Microsimulation; 17(2); 279-296.
doi: 10.34196/ijm.00299
- Article
- Figures and data
- Jump to
Figures
Figure 1
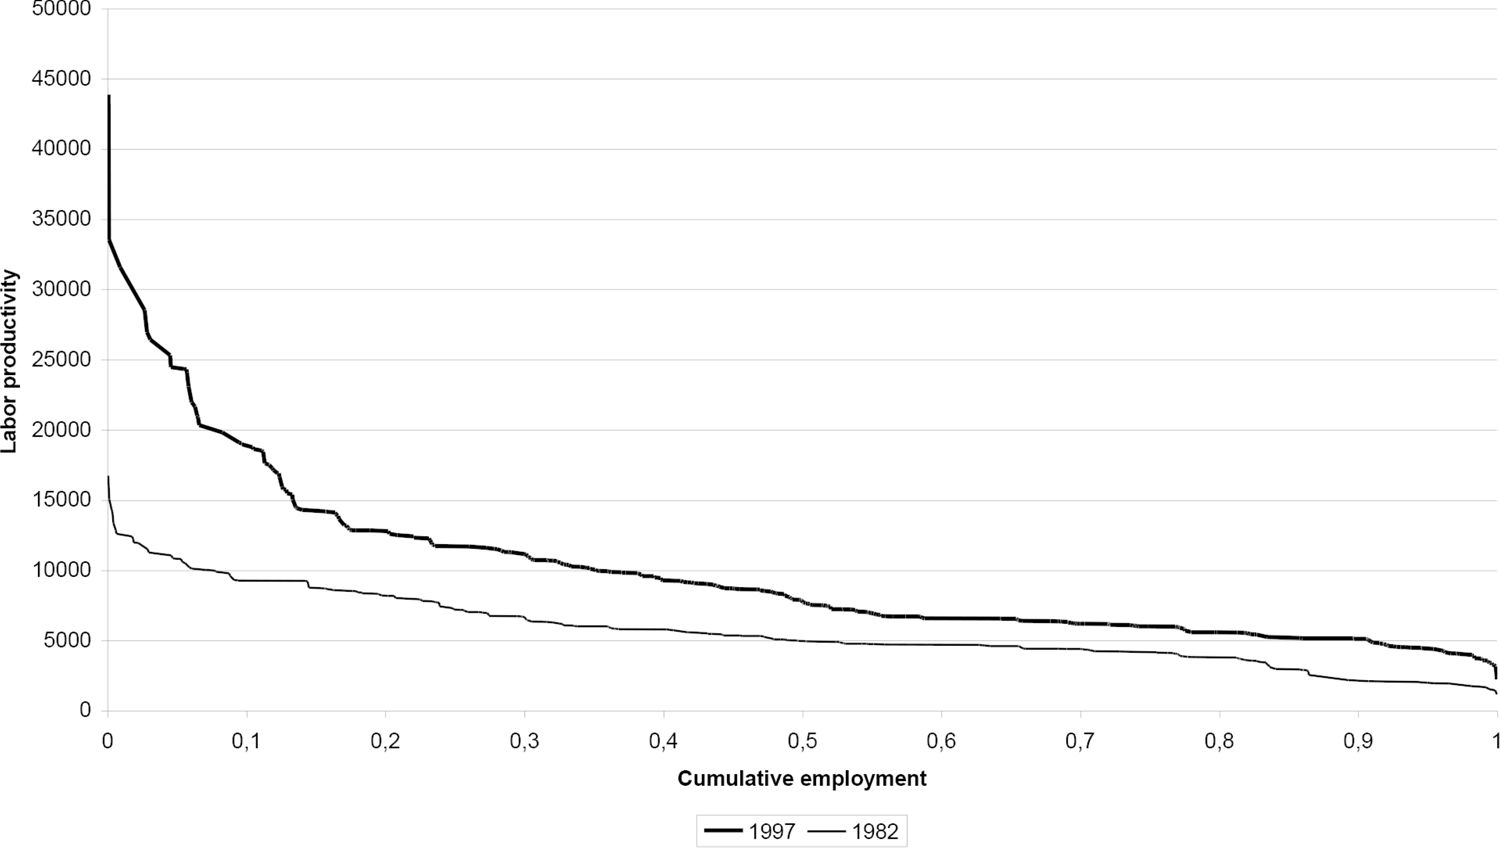
Salter curves showing labor productivities in Swedish manufacturing 1982 and 1997.
Figure 2
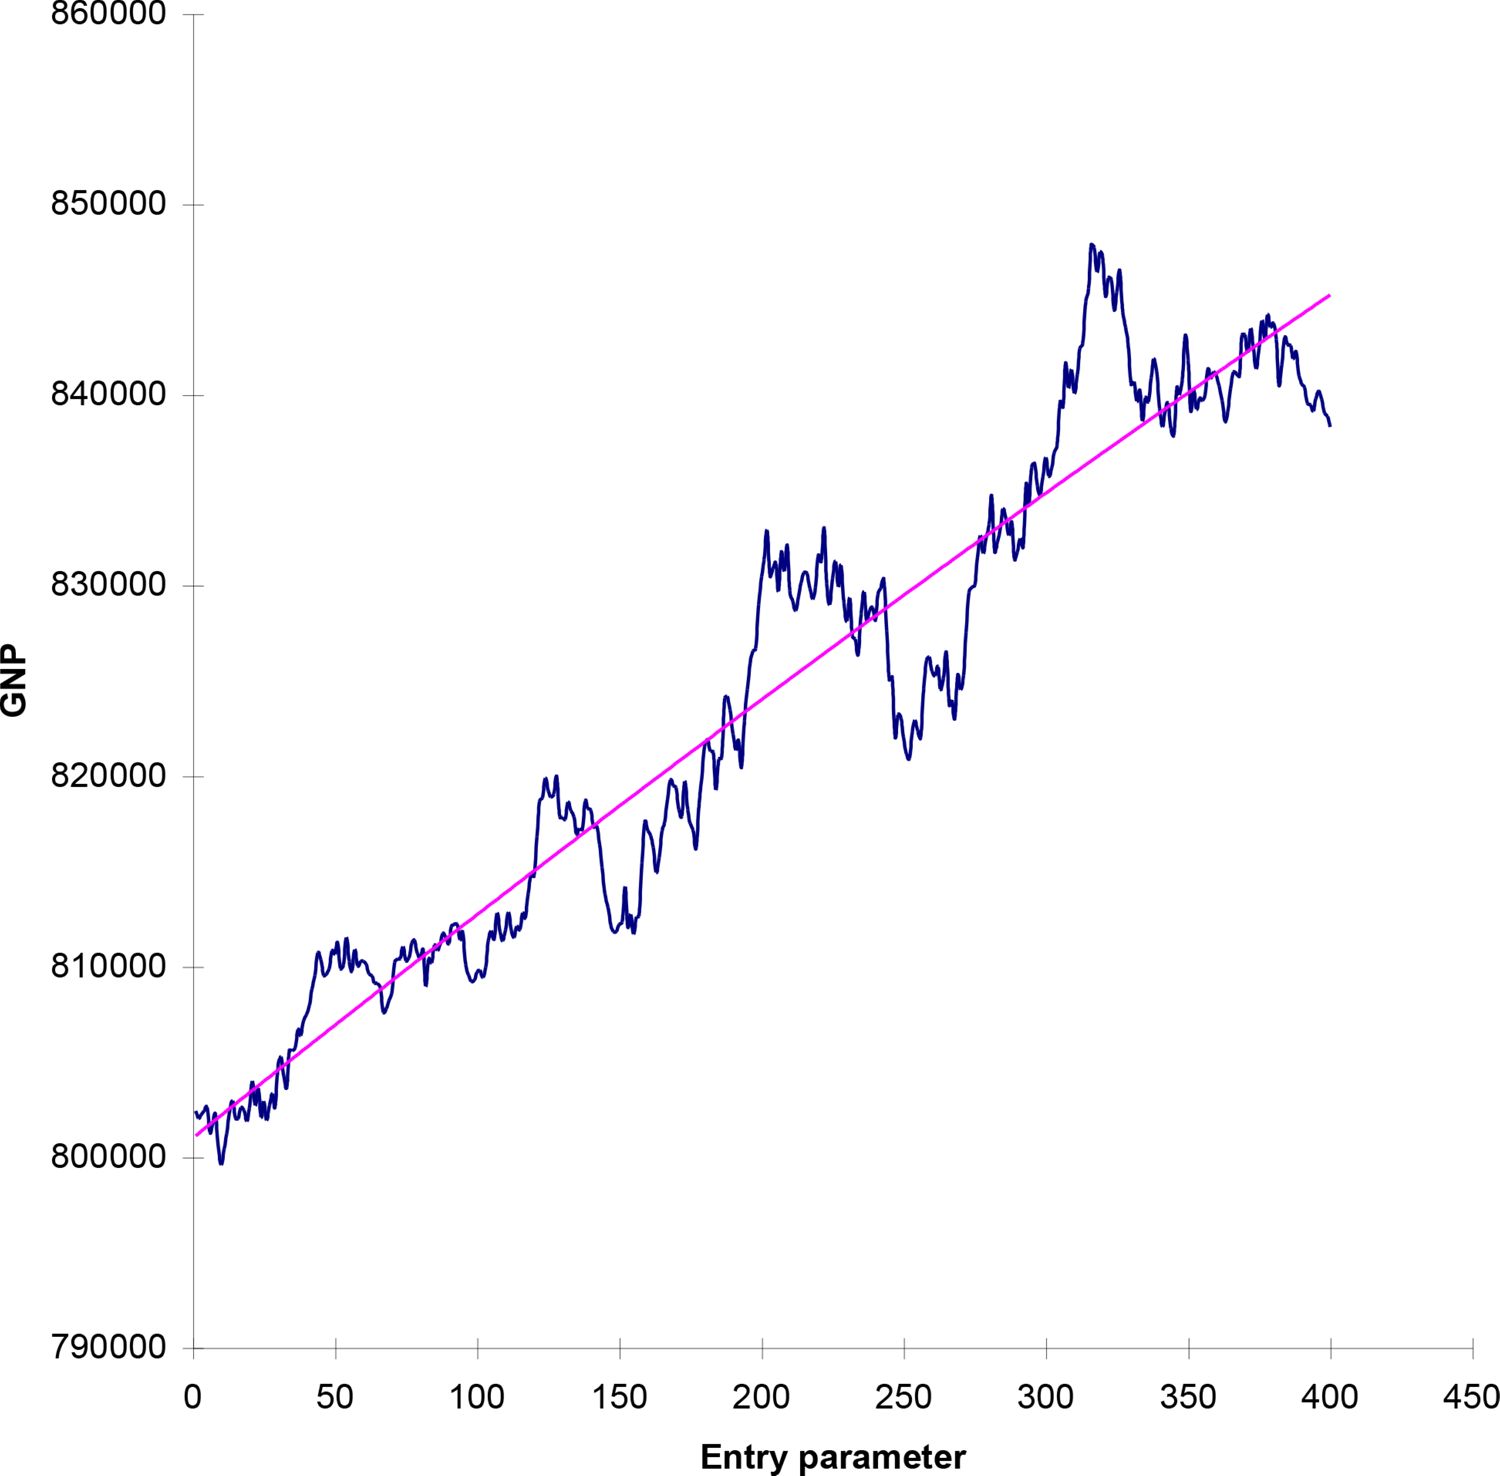
GNP levels at year 15 for different entry rate specifications.
Figure 3
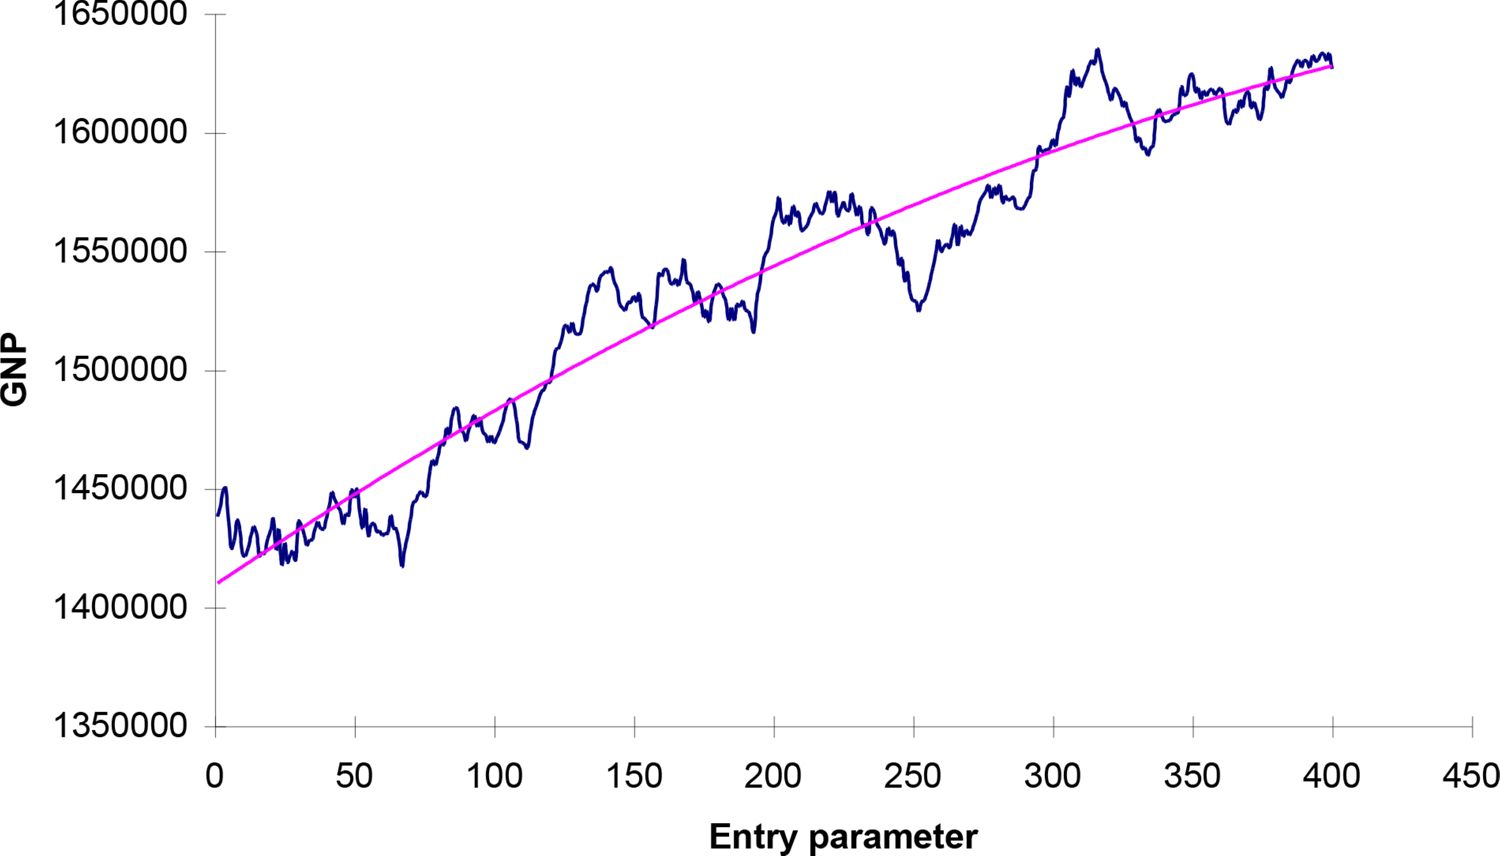
. GNP levels at year 35 for different entry rate specifications.
Figure 4
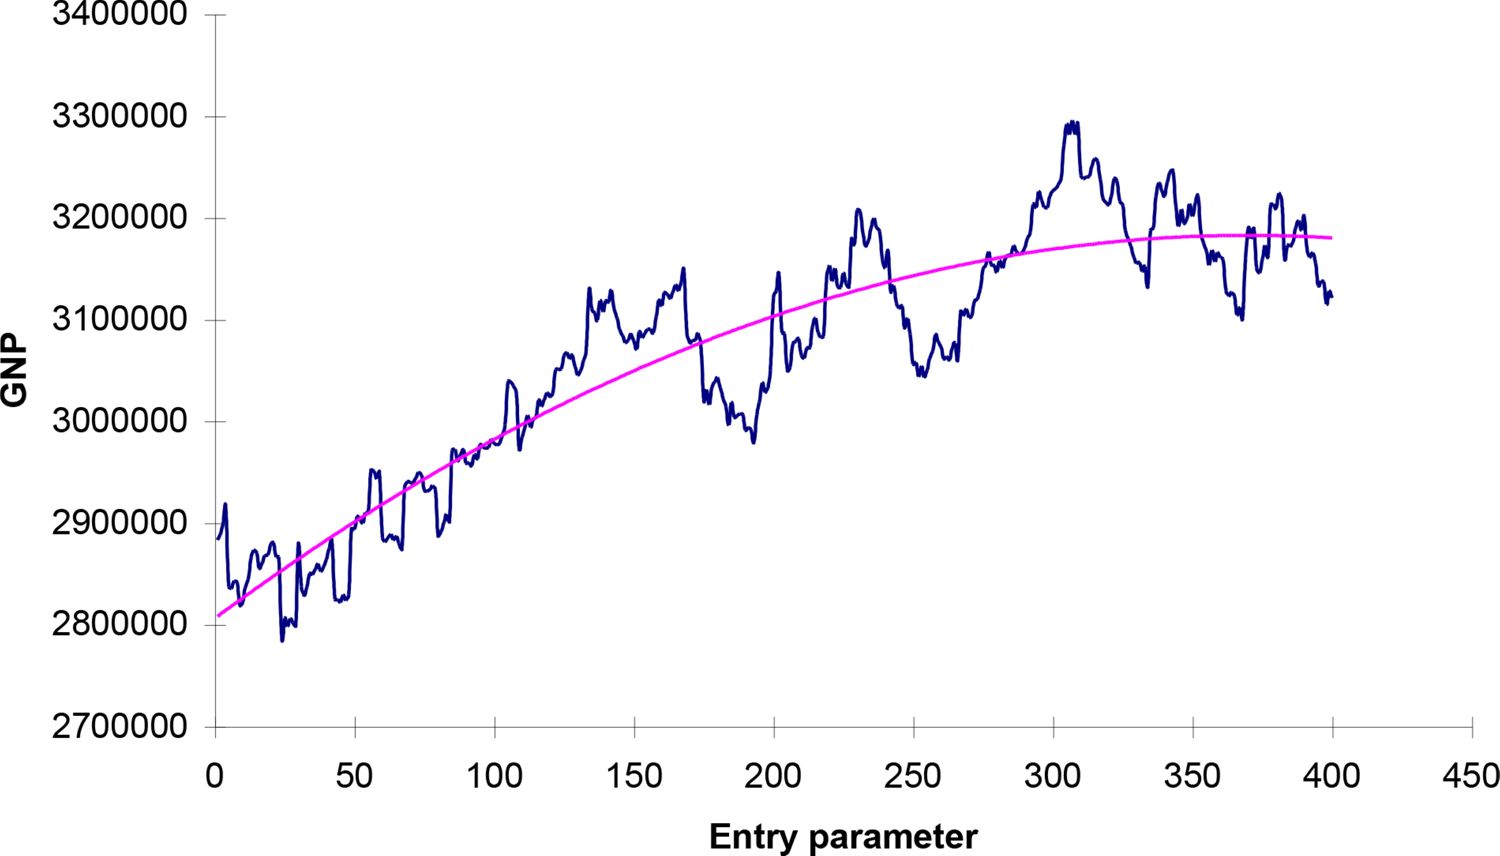
GNP levels at year 55 for different entry rate specifications.
Figure 5
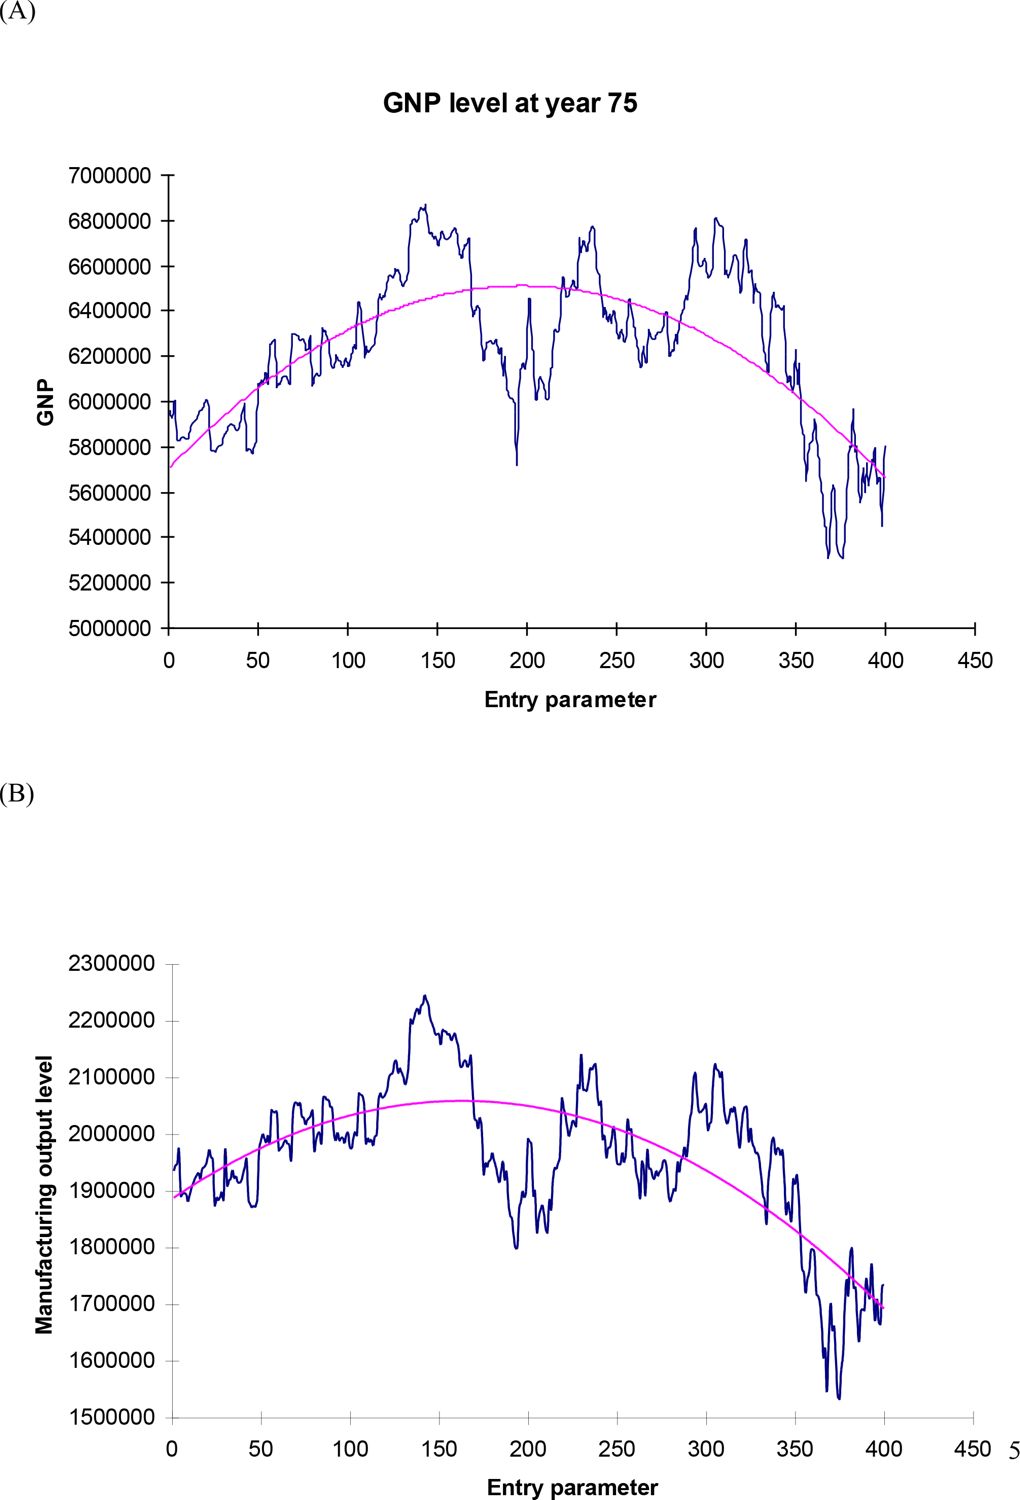
(A) GNP Levels at Year 75 for Different Entry Rate Specifications.(B) Manufacturing Output Levels at Year 75 for Different Entry Rate Specifications.
Figure 6
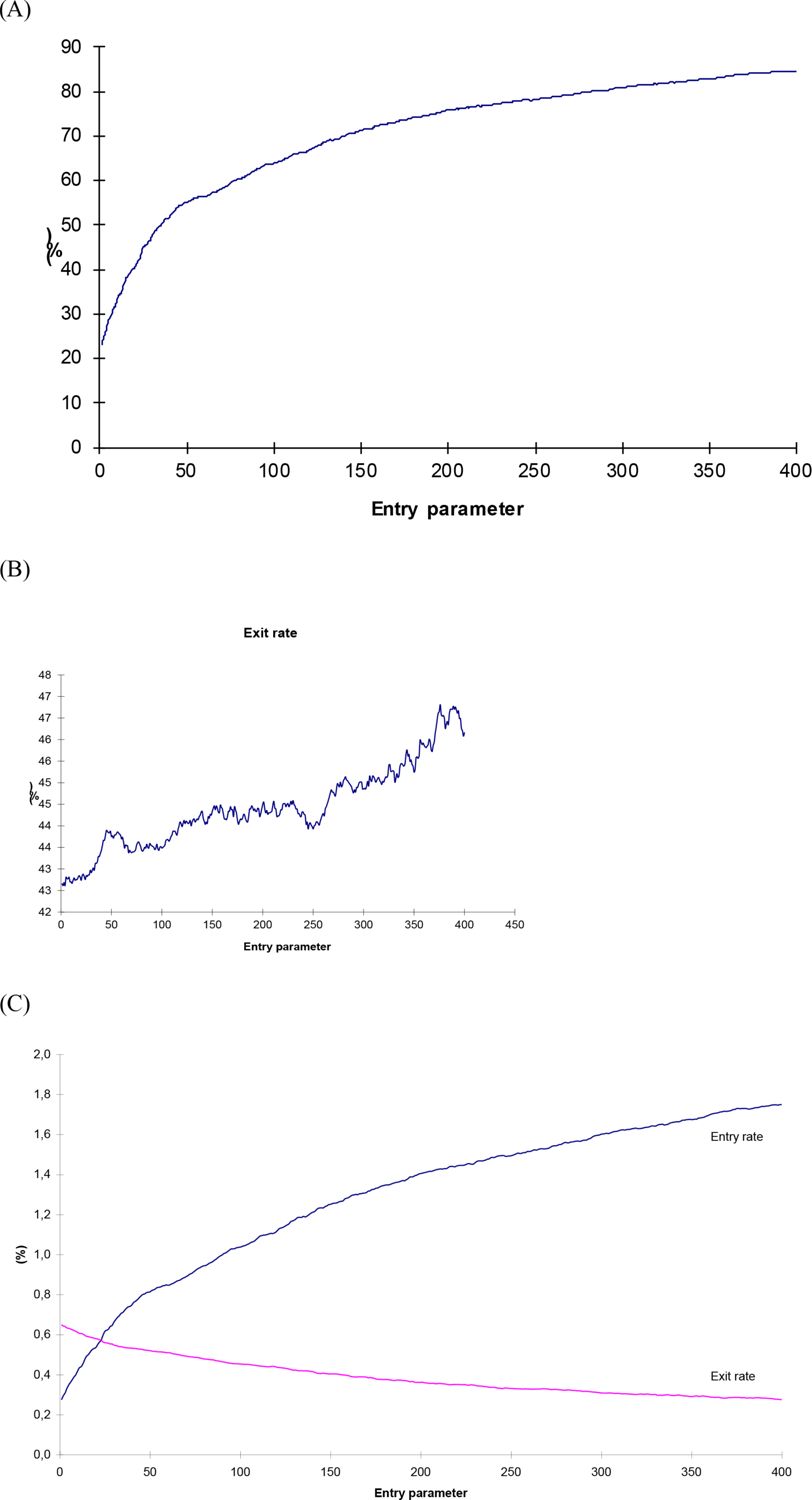
(A) Number of net (surviving) entrants in percent of 75 end-year populations of firms for different entry specifications. (B) Number of exits during 75-year simulations in percent of initial number of firms. (C) Number of entrants and exits per year in percent of stock of firms (number) for different entry specifications.
Tables
Table 1
The four mechanisms of schumpeterian creative destruction and economic growth.
| 1 | Innovative entry enforces (through competition) |
| 2 | Reorganization |
| 3 | Rationalization or |
| 4 | Exit (bankruptcy and/or shut down) |
-
Source: Eliasson (1996). Note: This is a stylized version on how growth occurs in the micro-to-macro model. We find the term creative destruction appropriate. It first appeared in Schumpeter (1942), but Schumpeter (1911) is a better reference for the dynamics we are discussing.
Download links
A two-part list of links to download the article, or parts of the article, in various formats.