Local Natural Capital Influences on the Geospatial Distribution of Farm Incomes
- School of Geography, Archaeology and Irish Studies, Ireland
- Teagasc, Ireland
Figures

Monthly mean gross margin per hectare by soil types (€).. Source: Author calculations using Teagasc NFS (2014).

Market Gross Margin per Hectare Sampled and Simulated (based on Jenks or Natural Breaks Classification).
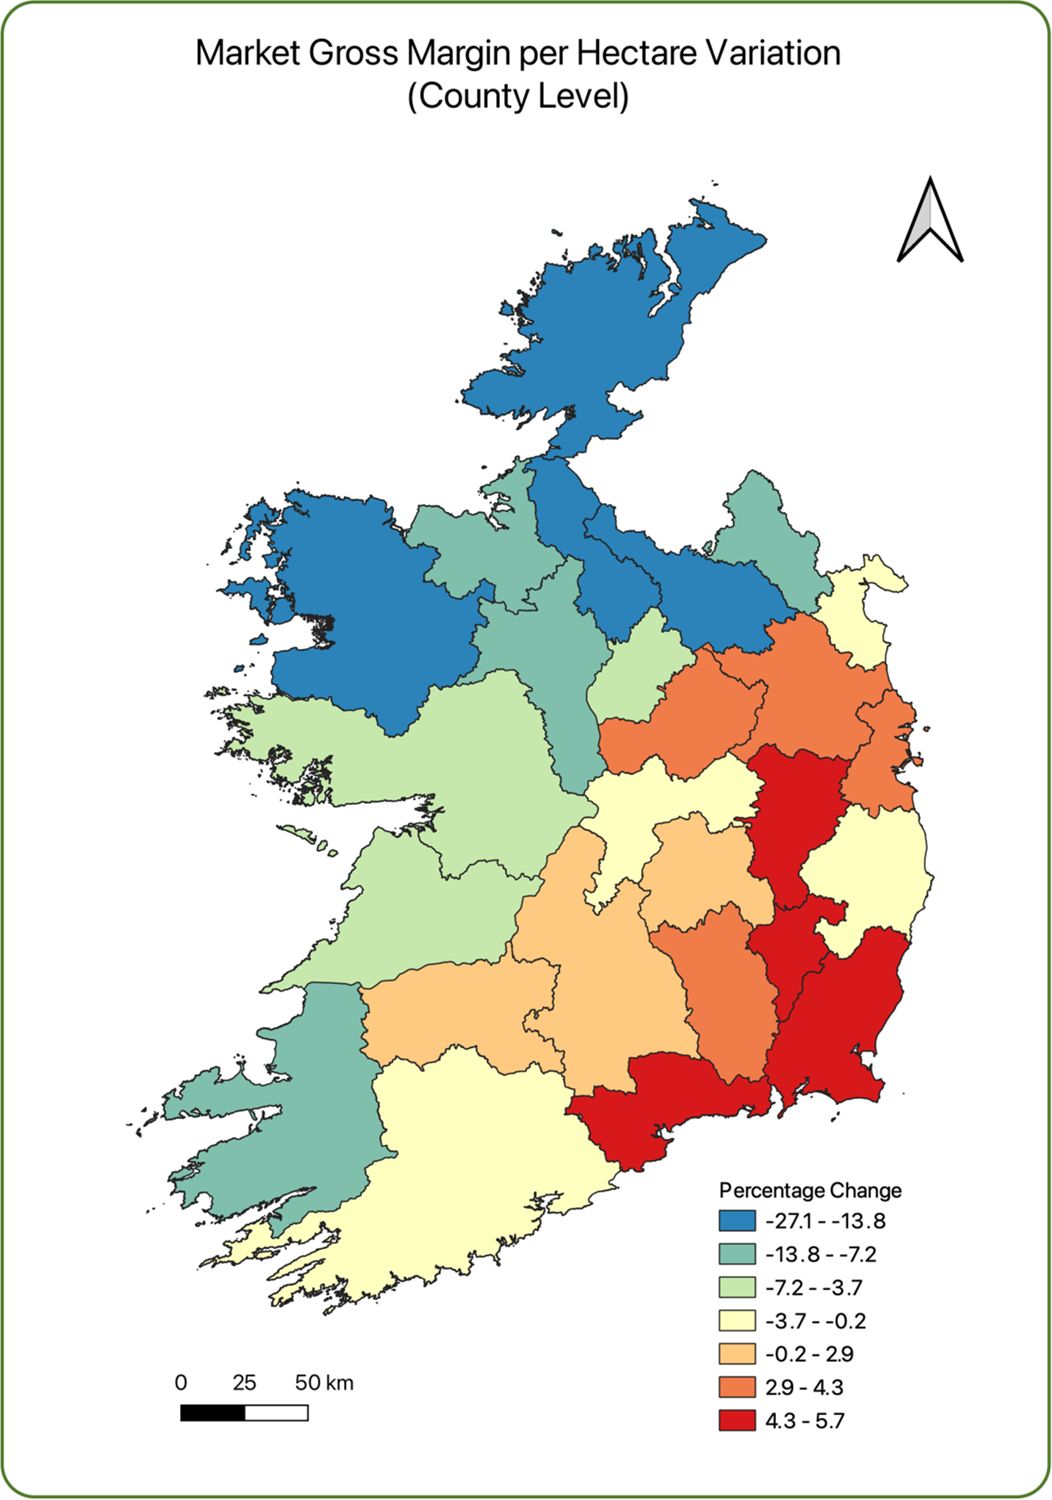
Market gross margin per hectare variation.
Tables
Stocking rate and purchased feed requirements in different regions.
| Livestock Unit (LU) per Ha | Feed (€) per LU | |||||
|---|---|---|---|---|---|---|
| Land Area | North/Border | SE | SW | North/Border | SE | SW |
| < 20 Ha | 1.68 | 2.39 | 2.22 | 163.9 | 97.1 | 120.1 |
| 20-30 Ha | 1.70 | 2.28 | 2.28 | 253.5 | 280.3 | 345.4 |
| 30-50 Ha | 1.78 | 2.13 | 2.12 | 347.3 | 223.5 | 265.3 |
| >= 50 Ha | 1.84 | 2.10 | 1.90 | 339.8 | 188.6 | 256.9 |
-
Source: Teagasc National Farm Survey 2014.
-
Note: LU per Ha – Stocking rate or livestock units per hectare; Feed (€) per LU - Purchased feed per livestock unit.
Comparison of survey and administrative data.
| NFS | Administrative Data | |||||||||
|---|---|---|---|---|---|---|---|---|---|---|
| system | <= 20 Ha | 20-30 Ha | 30-50 Ha | 50+ Ha | Total | <= 20 Ha | 20-30 Ha | 30-50 Ha | 50+ Ha | Total |
| Dairy | 1.1 | 2.4 | 11.1 | 20.8 | 35.4 | 0.4 | 1.1 | 3.6 | 6.1 | 11.2 |
| Cattle Rearing | 0.7 | 3.4 | 6.6 | 4.4 | 15.1 | 7.6 | 3.9 | 4.2 | 1.9 | 17.5 |
| Cattle Other | 2.5 | 3.6 | 7.8 | 11.4 | 25.4 | 15.7 | 7.6 | 8.5 | 5.6 | 37.5 |
| Sheep | 1.4 | 1.7 | 4.0 | 5.8 | 12.9 | 4.8 | 2.0 | 2.6 | 2.4 | 11.9 |
| Tillage | 0.5 | 1.0 | 1.4 | 5.7 | 8.6 | 2.2 | 1.1 | 1.7 | 2.6 | 7.7 |
| Mixed | 0.0 | 0.2 | 0.3 | 2.1 | 2.6 | 0.6 | 0.3 | 0.4 | 0.6 | 2.0 |
| Other Pasture Farms (Rental, Silage, Grazing) | 0.0 | 0.0 | 0.0 | 0.0 | 0.0 | 5.0 | 0.7 | 0.5 | 6.2 | 12.3 |
| Total | 6.2 | 12.3 | 31.2 | 50.3 | 100.0 | 36.3 | 16.7 | 21.5 | 25.4 | 100.0 |
Summary statistics of agronomic & environmental variables.
| Variable Name | Mean | St. Dev | Min | Max |
|---|---|---|---|---|
| Spring grass growth rate (dry matter kg/ha) | 9.33 | 6.36 | -19.37 | 30.32 |
| Spring grass cover (ha) | 6500.25 | 728.79 | 3176.46 | 8575.78 |
| Mean_Rain (annual average, mm) | 107.64 | 23.80 | 60.25 | 246.47 |
| Mean_Temp (annual average, °C) | 9.07 | 0.60 | 4.67 | 10.76 |
| Soil1 (binary) | 0.17 | 0.37 | 0 | 1 |
| Soil2 (binary) | 0.81 | 0.39 | 0 | 1 |
| Soil3 (binary) | 0.01 | 0.12 | 0 | 1 |
Sampled and simulated dependent variable (summary statistics).
| Variable | Obs | Mean | Std. Dev | Min | Max | |
|---|---|---|---|---|---|---|
| Sampled Gross Margin (€) | farmgm_ha | 111,369 | 483.27 | 705.46 | -1185.02 | 13377.3 |
| Simulated Gross Margin (€) | si_farmgm_ha | 111,369 | 483.24 | 802.28 | -6325.19 | 74604.22 |
Average Changes at County level for Sampled and Simulated Market Gross Margin per Ha
| Market Gross Margin per Ha (€) | Market Gross Margin per Ha relative to national average (€) | Ratio | |||||
|---|---|---|---|---|---|---|---|
| Sampled | Simulated | Sampled | Simulated | ||||
| County | Region | A | B | C | D | D/C | B/A |
| Carlow | SE | 1094.6 | 1147.8 | 1.13 | 1.24 | 1.10 | 1.05 |
| Cavan | NW | 860.2 | 735.7 | 0.89 | 0.79 | 0.90 | 0.86 |
| Clare | MW | 760.4 | 722.5 | 0.78 | 0.78 | 1.00 | 0.95 |
| Cork | SW | 1617.8 | 1584.1 | 1.67 | 1.71 | 1.03 | 0.98 |
| Donegal | NW | 688.8 | 515.7 | 0.71 | 0.56 | 0.79 | 0.75 |
| Dublin | E | 902.2 | 935.2 | 0.93 | 1.01 | 1.09 | 1.04 |
| Galway | W | 655.0 | 626.0 | 0.67 | 0.68 | 1.00 | 0.96 |
| Kerry | SW | 1129.3 | 996.2 | 1.16 | 1.08 | 0.93 | 0.88 |
| Kildare | E | 988.3 | 1033.6 | 1.02 | 1.12 | 1.10 | 1.05 |
| Kilkenny | SE | 1475.2 | 1528.0 | 1.52 | 1.65 | 1.09 | 1.04 |
| Laois | M | 1093.7 | 1093.8 | 1.13 | 1.18 | 1.05 | 1.00 |
| Leitrim | NW | 531.2 | 387.5 | 0.55 | 0.42 | 0.77 | 0.73 |
| Limerick | MW | 1384.3 | 1386.6 | 1.42 | 1.50 | 1.05 | 1.00 |
| Longford | M | 631.3 | 589.1 | 0.65 | 0.64 | 0.98 | 0.93 |
| Louth | NE | 933.6 | 905.9 | 0.96 | 0.98 | 1.02 | 0.97 |
| Mayo | W | 564.8 | 482.7 | 0.58 | 0.52 | 0.90 | 0.85 |
| Meath | E | 1030.0 | 1072.1 | 1.06 | 1.16 | 1.09 | 1.04 |
| Monaghan | NE | 837.8 | 725.7 | 0.86 | 0.78 | 0.91 | 0.87 |
| Offaly | M | 925.9 | 922.7 | 0.95 | 1.00 | 1.05 | 1.00 |
| Roscommon | W | 576.9 | 534.8 | 0.59 | 0.58 | 0.97 | 0.93 |
| Sligo | NW | 600.9 | 524.1 | 0.62 | 0.57 | 0.91 | 0.87 |
| Tipperary | MW/SE | 1380.2 | 1410.8 | 1.42 | 1.52 | 1.07 | 1.02 |
| Waterford | SE | 1564.9 | 1650.9 | 1.61 | 1.78 | 1.11 | 1.05 |
| Westmeath | M | 857.5 | 883.8 | 0.88 | 0.95 | 1.08 | 1.03 |
| Wexford | SE | 1490.0 | 1575.5 | 1.53 | 1.70 | 1.11 | 1.06 |
| Wicklow | E | 1127.7 | 1089.1 | 1.16 | 1.18 | 1.01 | 0.97 |
| Total | 971.6 | 926.4 | 1.00 | 1.00 | 1.00 | 0.95 | |
-
NB = This analysis focuses on primarily on pastoral farms; E = East; M = Midlands; NE = North East; N = North West; SE = South East; SW = South West; W = West;
Within and between group variation in market gross margin per hectare.
| Base | igm3 | |||
|---|---|---|---|---|
| GE(2) | Gini | GE(2) | Gini | |
| Total | 1.056 | 0.677 | 1.207 | 0.712 |
| Within | 0.960 | 1.088 | ||
| Between | 0.096 | 0.119 |
-
NB = This analysis focuses on primarily on pastoral farms;
-
The Geospatial unit is sub-catchment.
Statistical significance of changes in Farm Market Gross Margin per hectare and its components.
| Sampled | Simulated | |||||
|---|---|---|---|---|---|---|
| LB | UB | Mean | Mean | Ratio Simulated: Sampled | Statistically Different | |
| All Farms | ||||||
| Market Gross Margin per Ha | 964 | 980 | 972 | 926 | 0.95 | 1 |
| Market Gross Output Per Ha | 1398 | 1418 | 1408 | 1336 | 0.95 | 1 |
| Farm Direct Costs per Hectare | 434 | 439 | 437 | 409 | 0.94 | 1 |
| Dairy Farms | ||||||
| Dairy Livestock Units per Ha | 1.83 | 1.85 | 1.84 | 1.87 | 1.01 | 1 |
| Dairy Gross Output per Livestock Units | 1858 | 1869 | 1864 | 1822 | 0.98 | 1 |
| Cattle Farms | ||||||
| Cattle Livestock Units per Ha | 1.33 | 1.34 | 1.33 | 1.26 | 0.95 | 1 |
| Cattle Gross Output per Livestock Units | 565 | 568 | 567 | 541 | 0.96 | 1 |
| Sheep Farms | ||||||
| Sheep Gross Output per Livestock Units | 1.59 | 1.60 | 1.59 | 1.38 | 0.87 | 1 |
| Farm Direct Costs per Hectare | 464 | 469 | 466 | 441 | 0.95 | 1 |
-
NB = LB stands for Lower Bound and UB for Upper Bound;
-
The Lower Bound represents the minimum level of gross output, gross margin, direct costs, etc. that farms have within the simulation, while the Upper Bound represents the maximum level of gross output, gross margin, direct costs, etc. The "Statistically Different" column with a value of 1 represents that the change in mean is significantly different from zero and has a probability of less than 5% of being random in terms of the mean being different from zero.
Regression model of market gross margin per hectare as a function of natural capital variables.
| Explanatory Variables | Coef. | Std. Err. | t | Mean (Survey Data) | Mean (SMILE-GIS) |
|---|---|---|---|---|---|
| Acid Brown Earth 70% | 0.3 | 0.3 | 0.92 | 0.006 | 0.000 |
| Acid Brown Earth 70% (Coarse texture) | 0.4 | 0.3 | 1.31 | 0.008 | 0.000 |
| Acid Brown Earth 75% | 0.5 | 0.2 | 2.05 | 0.040 | 0.000 |
| Acid Brown Earth 90% | 1.2 | 0.4 | 2.73 | 0.011 | 0.000 |
| Basin Peat 100% | -0.6 | 1.5 | -0.41 | -0.010 | 0.000 |
| Blanket Peat (Low level) 100% | -0.1 | 0.4 | -0.28 | -0.001 | 0.000 |
| Brown Podzolic 60% | 0.1 | 0.2 | 0.61 | 0.016 | 0.000 |
| Brown Podzolic 80% | 0.2 | 0.4 | 0.49 | 0.007 | 0.000 |
| Degraded Grey Brown Podzolic 50% | -0.5 | 0.3 | -1.68 | -0.014 | 0.000 |
| Gley 50% | -0.3 | 0.3 | -1.08 | -0.011 | 0.000 |
| Gley 60% | 0.2 | 1.5 | 0.13 | 0.002 | 0.000 |
| Gley 75% | 0.4 | 0.2 | 1.51 | 0.024 | 0.000 |
| Gley 80% | 0.1 | 1.5 | 0.08 | 0.002 | 0.000 |
| Gley 90% | -0.4 | 1.4 | -0.29 | -0.019 | 0.000 |
| Grey Brown Podzolic 60% | -0.1 | 0.3 | -0.33 | -0.004 | 0.000 |
| Grey Brown Podzolic 70% | 0.2 | 0.3 | 0.88 | 0.011 | 0.000 |
| Grey Brown Podzolic 75% | 0.3 | 0.3 | 1.01 | 0.009 | 0.000 |
| Grey Brown Podzolic 80% | 0.5 | 0.3 | 1.64 | 0.017 | 0.000 |
| Island not surveyed | -0.9 | 0.4 | -2.26 | -0.011 | 0.000 |
| Lithosols and Outcropping Rock 70% | 0.8 | 0.2 | 3.57 | 0.084 | 0.000 |
| Minimal Grey Brown Podzolic 70% | 0.4 | 0.2 | 1.48 | 0.026 | 0.000 |
| Peaty Gley 70% | -1.1 | 0.3 | -4.18 | -0.047 | 0.000 |
| Peaty Podzol 75% | -1.2 | 0.5 | -2.65 | -0.010 | 0.000 |
| Podzol 70% | 0.4 | 0.7 | 0.59 | 0.001 | 0.000 |
| Distance to Sea | 0.0 | 0.0 | -1.53 | -0.112 | 0.000 |
| Average Temperature | -0.1 | 0.0 | -5.09 | -1.144 | 0.000 |
| Average Rainfall | 0.0 | 0.0 | -5.7 | -1.673 | 0.000 |
| Flat to Undulating Lowland (Mainly dry | -0.3 | 0.2 | -1.11 | -0.091 | 0.000 |
| Flat to Undulating Lowland (Mainly wet | 0.4 | 1.4 | 0.26 | 0.033 | 0.000 |
| Hill | 0.0 | 0.3 | 0.09 | 0.002 | 0.000 |
-
Source: Teagasc National Farm Survey and Simulation Model of the Irish Local Economy.
Gross output estimation.
| Dep var | Dairy | Dairy | Cattle | Cattle | Sheep | Sheep | Cereal |
|---|---|---|---|---|---|---|---|
| Livestock Units/Ha | Output per livestock unit | Livestock Units/Ha | Output per livestock unit | Livestock Units/Ha | Output per livestock unit | Output per livestock unit | |
| Obs | 4966 | 4957 | 13,933 | 13,845 | 4860 | 4772 | 2987 |
| R2 | 0.4225 | 0.3841 | 0.5157 | 0.2666 | 0.5976 | 0.1891 | 0.2276 |
| Price | 0.000045*** | 0.0001*** | 0.0001*** | ||||
| Fertiliser per ha | 0.0815*** | 0.0783*** | 0.2295*** | 0.033* | 0.2196*** | ||
| Purchased concentrate per Ha | 0.1525*** | 0.0988*** | 0.0147* | 0.0981*** | |||
| Share of enterprise area usage | -0.2927*** | -0.3804*** | -0.125*** | ||||
| Stocking rate for the enterprise | -0.0812*** | -0.1345*** | -0.2149*** | -0.0513** | |||
| Labour (Log) | 0.0542*** | -0.0106 | 0.0794 | 0.0419*** | 0.1001*** | 0.0829*** | 0.0172 |
| Age (Log) | -0.024*** | -0.0122 | -0.0129** | -0.0015 | 0.0007 | 0.0267 | -0.0347 |
| Has an off-farm job | -0.0109 | 0.0139 | -0.0143 | -0.01 | -0.0171 | ||
| Farm size (Log) | -0.132*** | 0.0565*** | -0.1142*** | 0.028 | |||
| Has forestry | -0.0259 | -0.0221 | -0.0499 | 0.1501*** | |||
| Extension service | -0.0055 | 0.0077 | 0.0067 | 0.0289*** | -0.0015 | 0.0035 | 0.0052 |
| Agri-environmental Sch | 0.0121* | 0.0129** | 0.0077 | 0.0001 | -0.018* | 0.0325* | 0.021 |
| Constant | -22.671*** | -5.7243*** | -6.2127*** | 19.4944*** | -0.8441*** | 14.5525 | 7.0117*** |
| Sigma u | 0.1798 | 0.1936*** | 0.2523*** | 0.3014*** | 0.3075*** | 0.4936*** | 0.4378*** |
| Sigma e | 0.1329 | 0.1343*** | 0.179*** | 0.3293*** | 0.2426*** | 0.4209*** | 0.3392*** |
| Rho | 0.6466 | 0.6753 | 0.6651 | 0.4558 | 0.6164 | 0.5791 | 0.6249 |
-
Source: O’Donoghue (2017).
Data and code availability
To access the proprietary data used to support the findings of this study, Teagasc - the Agriculture and Food Development Authority should be contacted at https://www.teagasc.ie/rural-economy/rural-economy/national-farm-survey/.