Population-based Simulation of COVID-19 Outbreak in Iran: Comparison of Different Policy Options
- Department of Community Nutrition, Iran
- Department of Demography, Iran
Abstract
Simulation and modeling of the COVID-19 outbreak can prognosticate behavior of the disease and simultaneously provide planners with a picture of what to expect. The existing studies simulating the COVID-19 outbreak in Iran, regardless of their macro or micro approaches, have been based on the principle of population homogeneity. Assuming population homogeneity in the simulation will lead to far-fetched results, as the actual population of a society is heterogeneous. This study uses a micro simulation approach and real demographic data drawn from the national census of 2016 conducted by the Statistical Center of Iran to simulate the outbreak. The conceptual framework of the National Corona Virus Taskforce Epidemiological Committee, which uses a SEIR approach, has been developed and expanded in this study to include socioeconomic, demographic, and geographical variables in the model. Total of eight policy scenarios (i.e. No Intervention, Student Quarantine, Weekend Lockdown, Inter-Province Travel Ban, Jobless Quarantine, Elderly Quarantine, Inter-District Travel Ban and Iranian School Policy) have been examined in the simulation. The results indicate, in terms of the number of population at risk, hospitalized patients, and total number of deaths, Jobless Quarantine is the most effective and No Intervention is the least effective policy option in Iran.
1. Introduction
Over the last few decades, mathematical models of disease transmission have been helpful to gain insights into the transmission dynamics of infectious diseases and the potential role of different intervention strategies (Chowell et al., 2016; Jenner et al., 2020). Currently, there is a global pandemic of COVID-19. To assess its prevalence, it is necessary to have adequate models that allow real-time modeling of the impact of various quarantine measures by the state. It is advisable to simulate and assess organizing or planning any epidemic prevention measures before their implementation. In other words, all the possible ways of spreading a viral infection should be simulated in real time without the involvement of real people (Vyklyuk et al., 2021). Simulation and modeling of the COVID-19 outbreak can prognosticate behavior of the disease and simultaneously provide planners with a picture of what to expect. Furthermore, simulation allows the planner to test different scenarios and programs in a hypothetical setting beforehand and choose the suitable option.
When reformulating the conceptual population model into an operative simulation model, one can choose between a micro-model approach describing every individual or a macro-model approach aggregating the individuals into classes/states of individuals where only the number of individuals in each state is described. These types of models are needed for different perspectives (Gustafsson and Sternad, 2007). It was stated that micro-simulation and macro-simulation are essentially two alternative methods for making similar statements about the future. However, despite this essential similarity, for practical purposes one will virtually never be indifferent between micro-simulation and macro-simulation (Van Imhoff and Post, 1998). Macro models can provide useful projections at the aggregate level, but their analyses are usually insufficient to reveal the individual impact (Li, 2011).
In fact, microsimulation models differ from the more traditional cohort-based models since they simulate the impact of interventions or policies on individual trajectories rather than the deterministic mean response of homogeneous cohorts. Cohort models investigate a hypothetical homogeneous cohort of individuals as they transition across health states (Krijkamp et al., 2018; Marois and Aktas, 2021). Microsimulation is a technique used to model complex real-life events by simulating the actions of, and/or the impact of, policy change on the individual micro unit (Harding, 2007; Spielauer, 2011; Marois and Aktas, 2021). In a standard situation, each individual in the simulation is an observation in a rectangular data file, which contains records of demographic characteristics and other key variables of interest. The simulator takes as input population files and demographic/epidemiological rates, and updates the population accordingly (Zagheni, 2015).
Microsimulation is the preferred modeling choice if individuals are different, if differences matter, and if there are too many possible combinations of considered characteristics to split the population into a manageable number of groups (Spielauer, 2011). Microsimulation can be used to create static or dynamic models. A static model is a way of synthesising data to produce an entire population estimate of individuals. It is dynamic microsimulation which is used in population projections and to perform ‘what if’ scenario testing of policy interventions (Lomax and Smith, 2017). When heterogeneous populations are used in simulation, one can not only predict the future behavior of the model, but it’s also possible to test different scenarios and policy options on different population groups and compare the results. In this paper we pursue the latter goal to assess the effect of different policy options on COVID-19 outbreak in Iran.
1.1. COVID-19 in Iran
On February 19, Iran confirmed two cases of death due to COVID-19 in the city of Qom, some 150 km south of the capital city, Tehran. This was the first report of death officially diagnosed as COVID-19 in West Asia, Middle East and North Africa. Following its worldwide spread and two deaths in Qom city, on February 19, the Iranian officials announced the COVID-19 outbreak in the country. The virus spread was rapid in Iran and by March 5, 2020, all 31 provinces had reported infected cases (Raoofi et al., 2020). The COVID-19 situation in Iran continues to evolve rapidly, with the number of individuals who have contracted the virus have increased sharply since the first case was reported around mid-February 2020. According to the spokesperson of the Iranian Ministry of Health and Medical Education, the pandemic has so far claimed 62,999 lives in Iran (April, 2021). The pandemic caused by the spread of this virus has caused different countries to adopt policies in accordance with their conditions. These policies have been formulated and Implemented in accordance with their own circumstances. Due to the novelty of the pandemic, it is not simply possible to measure the effectiveness of aforementioned policies. There is no need to say that the consequences of such interventions taken by the countries will be revealed during time.
Since the outbreak of the pandemic, Iran has tried to find the best national policy package to deal with it. Approaching this precious goal, the trend of the disease has been examined as an important task to discover models of various interventions on changing the natural course of the disease in Iran. When it comes to the interventions, it should be mentioned that Iran’s Epidemiological Committee was obliged by the National Corona Virus Taskforce to model the disease in the shortest possible time using the maximum scientific power of the country to present its scientific findings in the form of policy statements to be a suitable basis for national decisions. Based on this given task and by creating different working groups in the country among universities and using the power of experts inside and outside the country, various statistical models were designed and after expert discussions, the most important and instructive ones were selected (Haghdoost, 2020). This paper, adapts the conceptual framework and parameter values proposed by the Epidemiological Committee.
2. Previous Research
There are a few simulation studies on the outbreak in Iran. The COVID-19 International Modeling Consortium (CoMo Consortium) was created by researchers at the University of Oxford and Cornell University, is partnering with infectious disease modelers and public health experts from over 40 countries in Africa, Asia and America. Iran is part of this Consortium and uses its results in planning. The CoMo consortium has developed an age-structured, compartmental Susceptible-Exposed-Infectious-Recovery (SEIR) model to estimate the trajectory of COVID-19 based on different scenarios, and assess the potential impact of the various behavioral change strategies as well as treatment and vaccines, when they become available.
In Iran, on the other hand, the study conducted by Ghaffarzadegan and Rahmandad (2020), draws a modeling-in-real-time of the emerging outbreak of COVID-19 for understanding the state of the disease. They developed a simple dynamic model of the epidemic to provide a more reliable picture of the state of the disease based on time series data for official reports of death, recovered patients, and cumulative number of infections over time and unofficial data points including four observations about the number of Iranian passengers diagnosed with COVID-19 upon arrival in international airports, and three estimates aggregated by healthcare providers in Iran and reports by some news agencies about total cases of death from COVID-19. They estimated about 493,000 infected cases (90% CI: 271K-810K) as of March 20th, 2020. Their estimate for cumulative cases of infection until that date is 916,000 (90% CI: 508K, 1.5M), and for total death is 15,485 (90% CI: 8.4K, 25.8K). These numbers are significantly higher than official statistics. In an another study, Zareie et al. (2020) predicted the number of patients until April 15, 2020 through estimating the three parameters of time-dependent transmission rate, time-dependent recovery rate, and time-dependent death rate from COVID-19 outbreak in China and using the number of COVID-19 infections in Iran. Based on their predictions of Iran about 29,000 people were supposed to be infected from March 25 to April 15, 2020. On average, 1,292 people with COVID-19 were expected to be infected daily in Iran. The epidemic peaks within 3 days (March 25 to March 27, 2020) and reaches its highest point on March 25, 2020 with 1715 infected cases.
The Como Model as a representative of macro-models uses UN aggregate data based on age and sex. However, this model defects in assuming the population to be homogeneous. Some of individual based models are suffering from this presumption as well. For example, in the Cellular Automata (CA) model, population movement (in order to be at risk of disease) is assumed to be random and stochastic while a population is heterogonous in terms of demographic, economic and social characteristic.
Indeed, an important feature of a CA is that the automata’s location does not move; they can only change their state. The position of the cells and their neighbourhood relations remain fixed over time. CAs cannot have more than one attribute; for example, a cell could be occupied or unoccupied, but the cell could not contain multiple attributes (Crooks and Heppenstall, 2012).
Simulations considering only final outcomes, e.g. infections/deaths, that use time series data, fall into another problem. In other words, number of infections or deaths is function of age structure, geographical distribution of the population and other socio-economic characteristics. Due to the fact that the population of Iran is scattered in different districts with different population densities, and also this population is heterogeneous in terms of age and sex, our study provides a better understanding of the mechanism of disease prevalence and policy scenarios.
3. Conceptual framework
Recent modeling papers on COVID-19 focus principally on the epidemiology, attempting to both estimate the basic reproductive number of the disease and to provide estimates of the effectiveness of different interventions in flattening the growth curve of the epidemic in order to reduce the burden on the healthcare system (Currie et al., 2020). The theoretical framework most commonly used is based on the division of the human host population into categories containing susceptible, infected but not yet infectious (exposed), infectious, and recovered individuals (Lekone and Finkenstädt, 2006). The (SEIR) model provides a mathematical framework to explain the spread of infectious diseases and has been previously used for estimating the epidemiological parameters of several infectious diseases such as measles, Ebola, and influenza (Sharifi et al., 2020).
Iran’s Epidemiological Committee of National Corona Virus Taskforce used an extended form of the susceptible-exposed-infected/infectious-recovered/removed (SEIR) model, which is a dynamic modelling approach. Such epidemiological models are assumed to be compartmental; the target population will be divided into different sections or compartments (To see mathematical formulas and relationships, please refer to the Supplementary file 1 of the study conducted by Sharifi et al., 2020). In brief, they considered the following compartments: (a) susceptible, referring to the total number of individuals (ie, hosts) who have been susceptible to COVID-19. They assumed the entire population as susceptible in their model; (b) exposed, referring to individuals who are exposed to COVID-19 while they are asymptomatic and not yet infectious; (c) infected, referring to infected people who demonstrate clinical symptoms after their incubation period and have the potential to transmit the disease to other susceptible individuals; and (d) recovered/ removed, depending on the severity of the disease. they assumed that the infected people will (i) be recovered and immune from re-infection and therefore, no longer transmit the infection, (ii) have mild to moderate clinical symptoms and follow home-isolation guidelines without the need to be hospitalized, or (iii) have severe clinical symptoms and require hospitalization. These individuals would either be recovered or die and therefore, removed from the model (Sharifi et al., 2020).
In our study, we expanded the conceptual framework of Iran’s Epidemiological Committee of the National Coronavirus Taskforce by incorporating socioeconomic, demographic, and geographical variables into the model.
The aforementioned model assumes that individuals in the society are homogeneous. For example, the probability of infection is calculated by dividing the number of infected individuals by total population and this probability is presumed to be equal for all individuals of the society.
On the other hand, in our study the probability of infection is calculated separately for each district and in case of no infected individual in the district, the probability will be zero. Furthermore, in the households with an infected person, the probability is calculated by dividing the number of infected individuals by the number of the household members. For these households, the model uses the maximum of household or district probabilities of infection. In the expanded model (Figure 1), the variables of district, household, population movement, population density, urban and rural status, economic and social status, age, gender, occupation, and education have been added to the original framework. As a matter of fact, early onset of the disease occurs from a few districts, hence as long as an infected individual has not moved to another district, the probability of infection in the latter district is zero which causes no prevalence. Moreover, the probability of infection within households with an infected individual may be more than other individuals in the same district. Population movement causes the spread and dissemination of the disease in different districts. Population density affects an individual’s number of daily contacts. It is expected that districts with low population density, have lower number of daily contacts. In rural areas, population density is lower than in the urban areas. Employed individuals have more contacts than others and if infected, they are less likely to be effectively isolated. Educated individuals, due to their job type and health literacy level, mostly have fewer contacts (in epidemic conditions) and if infected, they are more likely to isolate. The socioeconomic status of individuals can affect the probabilities of exposure, isolation, recovery, hospitalization, and death. Age and sex can also affect the probabilities of hospitalization and death. The newly added variables are marked with green boxes and red lines in Figure 1.
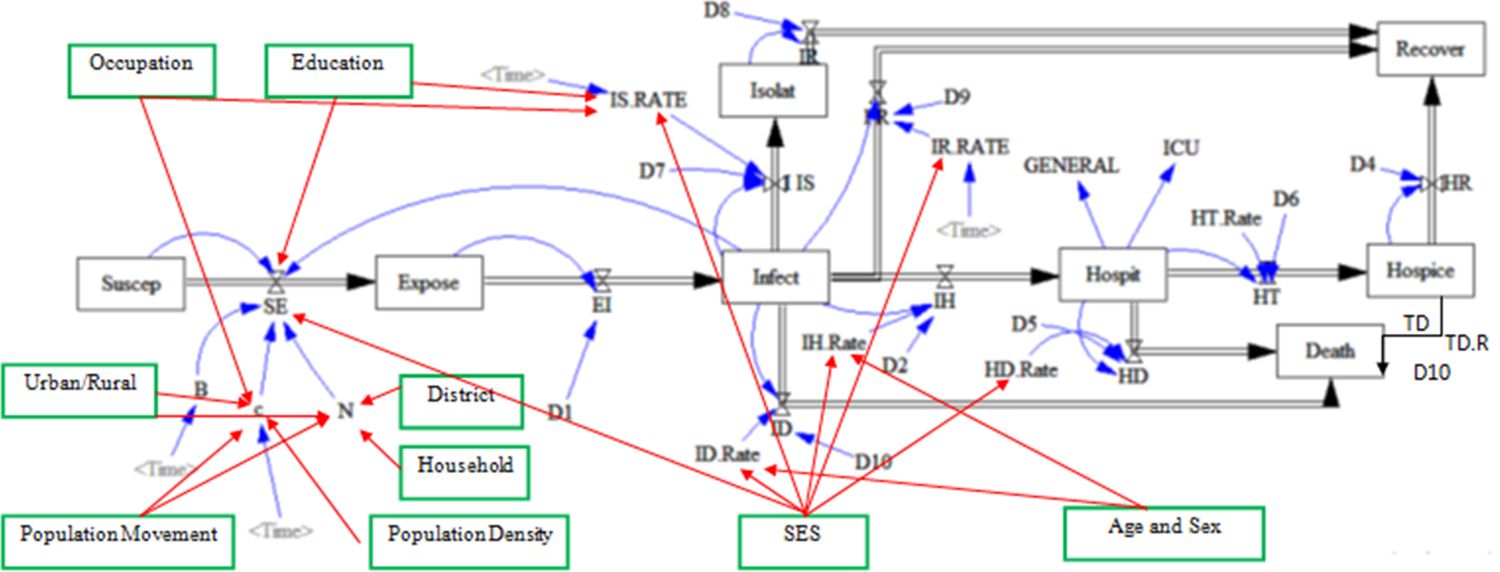
Extended conceptual framework in the present study for the outbreak of COVID-19. Source: The Epidemiological Committee of Iran’s National Corona virus Taskforce. The new variables illustrated via green boxes and red lines are added to the original conceptual framework by authors.
4. Data and Software
The statistical population of this study includes 78,921,893 individuals of population in Iran based on the 2016 census. However, a 2% sample of this census which has been published by the Statistical Center of Iran (SCI) as raw data is used in simulation. The SCI selects a 2% sample of census and publishes for public use.1 The sampling method is considered as stratified random sampling. After determining the 2% sample size for each urban/rural area of each district, households are selected. To have enough samples from less populated districts, they may contribute more than 2% to the sampling framework. Weights are used at both household and individual level to offset any over or under representation. On the basis of this process, the household weight is calculated equal to the inverse- probability- of- selection and by adjusting this weight based on the population of each sex in the urban/rural area of each district, the individual weight is defined. As a result, there are representative samples from all 429 districts of Iran in this data. For example, more samples are selected from districts with low population, but they will also be given less weight. Therefore, the 2% sample data represents the total population of Iran and its districts at the time of census (SCI, 2016a). The sample size used in this simulation is 1,579,435 individuals. Considering the variable of weight in the data and applying this variable in statistical calculations, we may show indicators for the whole statistical population. Due to the 5.67% growth of the country’s population since the 2016 census, all indicators related to the number of events must be multiplied by 1.0567 to calculate the value of the indicator for the current time. However, one should beware of the fact that not all population groups grow at similar rate.
This simulation uses R Software. R is a programming language that has gained recognition within the field of decision modeling and simulation. It has the capacity to perform microsimulations more efficiently than software commonly used for decision modeling, incorporate statistical analyses, produce more transparent models and reproducible results. However, no clear guidance of implementation of microsimulation models in R exists (Krijkamp et al., 2018). So, all R codes are written by researchers and no specific package was utilized for simulation. However, multiple packages were used in the process of data management and simulation.2
5. Methodology
Based on the country’s official reports and available epidemiological data, January 21, 2020 was considered as the initial day of the COVID-19 outbreak in Iran. National Epidemiological Committee used several parameters as model inputs and obtained their values from a comprehensive literature review and published articles in relation to COVID-19, as well as relevant parameters derived from estimates in similar epidemics, in particular, H1N1 influenza (Haghdoost et al., 2009). They first shared the initial values of the parameters with Iran’s national and scientific committees and experts, and made the necessary adjustments, accordingly. They compared the revised values of these parameters with the literature as well as the epidemic pattern in Iran. They then made the final revisions for the values of the parameters used as the extended SEIR model inputs (Sharifi et al., 2020). The model variables and their parameters are presented at Table 1.
Modeling the COVID-19 outbreak in Iran: parameters, definitions, and values
| Model parameter | Definition | Value | References |
|---|---|---|---|
| Suscep | Susceptible population to disease at any time | 78,921,893 individuals1 Sample size:1,579,435 | SCI (2016b)SCI (2016b) |
| Expose | Exposed population to COVID-19 virus at any time | With a probability of 105 individuals per a million population in three districts of Qom (136 people), Tehran (917 people), and Rasht (100 people) on the first day | -- |
| Infect | Infected population by COVID-19 virus at any time | Based on mechanism of model (zero individual on day zero) | -- |
| Isolate | Isolated population after infection who were not hospitalized | zero individual on time zero (T0) | -- |
| Recover | Recovered population | zero individual on T0 | -- |
| Hospice | Hospitalized patients | zero individual on T0 | -- |
| Death | deceased population | zero individual on T0 | -- |
| hospice | discharged patients (at home or in a special residence that is under care and follow-up) | zero individual on T0 | -- |
| N | Total population | 78921893 individuals who are scattered throughout the country in 429 districtsSample size:1579435 | SCI (2016b) |
| C | Number of daily contacts of healthy individual per day | The mean number of daily contacts proposed by Iran’s Taskforce3 experts with a normal distribution and standard deviation of 2 (min 2 & max 50) is used to assign the daily effective contact numbers. To take into account population density of districts, number of contacts at each district is also set to have a positive correlation coefficient with district population density. The correlation is assumed to have a normal distribution with mean of 0.4 and standard deviation of 0.1 ranging from 0.15 to 0.55. | -- |
| B | Probability of transmission in case of encountering healthy individual with infected individual | Using the formula applied by the Epidemiology Committee of Iran’s Taskforce:B = (((Sin (2 × 3.14 × (Time +110) / 365)) + 1) ×((0.045 – 0.02) / 2)) +0.02 | Haghdoost et al., 2009&WanWan et al. (2020) et al., 2020 |
| SE | The number of individuals from the susceptive group who are added to the exposed group daily. | B×c(Infect/N)Infect/N at the district and household levels is calculated and the higher probability is used. | -- |
| EI | The number of individuals from exposed group who are added to infected group daily | All exposed people will become ill in D1 days. | -- |
| D1 | Duration of time until an exposed individual becomes infected | Randomly determined for each individual with normal distribution and with mean of 5.334 days and a standard deviation of 0.445 and a minimum of 2 and a maximum of 9 days. N~(5.33,0.445,2,9) | You et al., 2020 |
| IIS | The number of individuals who are isolated daily | Each infected individual may be isolated randomly with a normal distribution and with a mean probability IS.RATE, standard deviation of 0.05, minimum of 0, and maximum of 1. | -- |
| D7 | Duration of time until an infected individual becomes isolated | Randomly determined for each individual with a normal distribution, mean of 3 days, standard deviation of 0.5, and a minimum of 1 day.N~(3,0.5,1,-) | Expert Opinion |
| IS.RATE | rate of infected individuals who become isolated | Randomly determined for each iteration with a normal distribution and mean of 20%, a standard deviation of 5%, a minimum of 5%, and a maximum of 50%. N~(20,5,5,50) | -- |
| D8 | Duration of time until an isolated individual becomes recovered | Randomly determined for each person with normal distribution and mean of 7.91 days, standard deviation of 0.5, and a minimum of 3 days.N~(7.91,0.5,3,-) | You et alYou et al. (2020)., 2020 |
| IR | The number of infected individuals(without hospitalization and isolation) who recover daily | Each individual may be randomly recover daily with a probability calculated by subtracting sum of probabilities of isolation, hospitalization, and death of the individual from 1 | -- |
| IR.RATE | Rate of infected individuals(without hospitalization and isolation) who recover | Calculated by subtracting sum of probabilities of isolation, hospitalization, and death of the individual from 1 | -- |
| D9 | Duration of time until an infected individual(without hospitalization and isolation) recovers | Randomly determined for each individual with a normal distribution and an average of 10.91 days, standard deviation of 0.5, and a minimum of 6 days.N~(10.91,0.5,6) | -- |
| IH | Number of infected individuals who are hospitalized daily. | The daily number of hospitalized patients is, first, determined by multiplying the IH.Rate with the number of infected people. For each individual, then, the probability of hospitalization is estimated based on the age-sex distribution of hospitalized patients (See table 2). | -- |
| IH.Rate | Rate of infected individuals who are hospitalized daily. | Randomly determined for each iteration with a normal distribution and mean of 5%, a standard deviation of 1%, a minimum of 2%, and a maximum of 15%.N~(0.05,0.01,0.02,0.15) | -- |
| D2 | Duration of time until an infected individual becomes hospitalized | Randomly assigned for each individual with a normal distribution and an average of 2 days and a standard deviation of 0.5 and a minimum of 1 day. N~(2,0.5,1) | Expert Opinion |
| GENERAL | Number of hospitalized individuals who are admitted to general wards (non-ICU). | Hospit × 0.9 | -- |
| ICU | Number of hospitalized individuals who are admitted to ICUs | Hospit × 0.10 | -- |
| HT | Probability of hospital discharge | This probability for each individual is determined randomly with a normal distribution, an average of HT.Rate, standard deviation of 0.01 and a minimum of 0 and maximum 1 (100%).N~(HT.Rate,0.01,0,1) | -- |
| HT.Rate | Rate of hospital discharge | Randomly determined for each iteration with a normal distribution, mean of 90%, standard deviation of 1%, minimum of 80%, and maximum of 99%.N~(0.9,0.01,0.8,0.99) | National Data and Expert Opinion |
| D6 | Duration of time until hospital discharge | Randomly determined for each individual with a normal distribution and an average of 5 days, standard deviation of 0.5, and a minimum of 1 day. N~(5,0.5,1) | -- |
| HR | The number of individuals who recover daily after discharge | 1- TD.Rate | -- |
| D4 | Duration of time between discharge and recovery | Randomly determined for each individual with a normal distribution and an average of 7 days and a standard deviation of 0.5 and a minimum of 3 days.N~(7,0.5,3) | National Data and Expert Opinion |
| HD | The Number of individuals who die daily in hospital | The daily number of hospital deaths is, first, determined by multiplying the HD.Rate with the number of hospitalized patients. For each individual, then, the probability of death is estimated based on the age-sex distribution of deaths (See table 2). | -- |
| HD.Rate | Hospital deaths rate | 1- HT.Rate | -- |
| D5 | Duration of time between hospitalization and death | Randomly determined for each individual with a normal distribution and an average of 5 days, standard deviation of 0.5, and a minimum of 0.N~(5,0.5,0) | -- |
| ID | Number of infected individuals who die daily (without hospitalization) | The daily number of deaths is, first, determined by multiplying the ID.Rate with the number of infected patients. For each individual, then, the probability of death is estimated based on the age-sex distribution of deaths (See table 2). | -- |
| ID. Rate | Rate of death for infected individuals without hospitalization | Randomly determined for each iteration with a normal distribution and mean of 2 per thousand, a standard deviation of 5 in tens of thousands, a minimum of 1 per hundred thousand, and maximum 5 per thousand.N~(0.002,0.0005,0.00001,0.005) | -- |
| D10 | Duration of time until infected individual die without hospitalization. | Randomly determined for each individual with a normal distribution and an average of 11 days, standard deviation of 0.5, and a minimum of 4 days.N~(11,0.5,4) | justify with expert opinion&Haghdoost et al., 2009 |
| TD | Number of individuals who die daily after discharge from hospital | The daily number of deaths is, first, determined by multiplying the TD.Rate with the number of discharged patients. For each individual, then, the probability of death is estimated based on the age-sex distribution of deaths (See table 2). | -- |
| TD.Rate | Rate of death for individuals who die after discharge | Randomly for each iteration:N~(0.005,0.001,0.0001,0.01) | National Data and Expert Opinion |
| D11 | Duration of time until infected individual dies after discharge from hospital. | Randomly for each individual:N~(7,0.5,1) | -- |
| Population Movement | Population movement | 2016 Census inter-district migration Matrix: based on this matrix, individuals randomly change their place of residence (probability of daily movement of approximately 8% of the population) | -- |
| Urban/Rural | NA | the place of residence can be used in policy scenarios | -- |
| Population Density | Population density | Obtained by dividing the population of each district by its area and is used to determine the number of daily contacts | -- |
| Household | Household | Individuals in each district are nested in households. The household size shows the number of members and is used to calculate the probability of an infection at the household level | -- |
| District | District | The country's population lives in 429 districts. The probability of infection is calculated at the district level, as well | -- |
| Age & Sex | Age and sex | Individual characteristics of members of the society that are used to estimate the probabilities of hospitalization and death | -- |
| SES | NA | Indicates the level of welfare of the household. Can be used in policy scenarios. | -- |
| Occupation | NA | Indicates a person's occupational status. Can be used in policy scenarios | -- |
| Education | NA | Indicates a person's level of education. can be used in policy scenarios | -- |
As mentioned earlier, in this study, the simulation is using micro and real demographic data. Accordingly, individuals are located in different districts of Iran, a total of 429, and in each district they are clustered within households. The population of the districts is not closed, and a number of individuals move inter-districts daily. On the day of the study, the entire population is in a susceptible to disease state. On the first day (January 21, 2020), in three districts of Tehran, Qom, and Rasht, approximately 1150 individuals (with a probability of 105 individuals per one million individual) are exposed to the disease. Due to population movement, these individuals or new patients who were in contact with the initial cases, may travel to other districts and expose the individuals of these districts to disease. Individuals in the household are exposed to the disease by the maximum of probabilities of infection at the district or household level. The population density of the districts affects the number of daily contacts. In this study, the correlation coefficient between the population density of the districts and the number of daily contacts of individuals is considered in average to be 0.4. To determine daily population movement pattern between districts, the migration matrix of the 2016 census which shows permanent inter-district migration for a five-year period (2011-16), has been used.5 As daily movements are not recorded, the migration matrix is used as a proxy for daily movements. In the model which runs by daily increments, single-day movements are assumed which means travelers return to their permanent place of residence at the end of the day. Age and sex distribution of hospitalized patients as well as the deceased patients reported for Tehran University of Medical Sciences, used to determine the probability of hospitalization and death by age and sex (Table 2).
The proportion of hospitalized COVID-19 patients and deaths by age and sex at TUMS
| Age group | Hospitalization | Deaths | ||
|---|---|---|---|---|
| Female | Male | Female | Male | |
| 0 | 0.001192 | 0.001523 | 0 | 0 |
| 1-9 | 0.001937 | 0.002475 | 0 | 0 |
| 10-19 | 0.006754 | 0.008631 | 0.00356 | 0.00561 |
| 20-29 | 0.035259 | 0.045058 | 0.00356 | 0.00561 |
| 30-39 | 0.081592 | 0.104267 | 0.01305 | 0.02059 |
| 40-40 | 0.084373 | 0.107821 | 0.02551 | 0.04024 |
| 50-59 | 0.079954 | 0.102173 | 0.05577 | 0.08796 |
| 60-69 | 0.073249 | 0.093606 | 0.08958 | 0.1413 |
| 70-79 | 0.04539 | 0.058004 | 0.10857 | 0.17125 |
| 80-89 | 0.025973 | 0.03319 | 0.07594 | 0.11978 |
| 90 | 0.003327 | 0.004252 | 0.01246 | 0.01965 |
-
Calculated from epidemiological report of COVID-19 patients of the Tehran University of Medical Sciences Hospitals, April 2020.
In order to take into account, the stochastic and uncertainty nature of the model, two steps are taken. In the first step, all parameters are randomly determined by a specific distribution for individuals. For example, if it takes an average of 4.9 days for an exposed person to become ill, a random number is assigned to each exposed individual. These random numbers follow a normal distribution with a mean of 4.9, and a standard deviation of 1. However, no one can have a number less than 2. The details of all parameters are presented at Table 1, which are either based on available literature or agreed upon by a group of national experts. In the second step, to consider the randomness of the phenomenon, the whole process must be iterated several times. This allows not only calculation of the average parameter values as the best estimate, but also calculation of the confidence interval of the estimates (for example, with 95% and/or 80% probabilities).
As mentioned earlier the simulation is done in a series of iterations, the procedure to run iterations is as follows. The iteration starts with a rectangular data of 1,579,435 cases and a set of necessary variables including a state variable which is set to susceptible state for all at day 0. At start of iteration, the R code randomly assigns the model parameters for each individual based on information provided in Table 1. At day 1 some cases are exposed to the infection as mentioned above. Once someone becomes exposed to the infection, s/he should pass through the conceptual framework and experience new status values determined by parameters assigned. As the model progresses to next days, it updates the status of each individual by calculating new probabilities of exposure for susceptible cases and assigning new status for exposed cases. The probabilities of exposure are calculated at both household and district levels. The maximum of the two is used in the model, however. At the end of iteration and also at each time increment, cases have different status (i.e. susceptible, exposed, infected, isolated, hospitalized, deceased, & recovered). The weighted frequency of status variable by time provides daily statistics at population level. Once an iteration ends, the program starts the whole process again in a new iteration where new values of parameters for each case are set randomly.
Probabilities of inter-district travel, calculated from migration matrix, are also used to calculate the daily location of each individual. Random number generators with binomial distribution are used to determine daily status and location for each individual utilizing the related probabilities.
The socio-economic and demographic variables added to the conceptual framework could affect the model in two ways. They either act on transition from susceptible to exposure state, by affecting number of daily contacts (e.g. the higher the population density, the higher the number of daily contacts) and population size (e.g. population movement spreads exposed and infected cases across different districts for new districts to be affected). Or they can affect the probabilities of isolation, hospitalization, and death (e.g. age-sex distribution of death). Not all socio-economic and demographic variables of the expanded conceptual framework are used in this simulation. For list of variables and their parameter values see Table 1. It’s worth noting that this study is not aiming to predict number of population at each state for the purpose of predicting the course of the pandemic in Iran. Instead, this study’s main goal is to use the model to examine different policy and health options and their effect on population. If the goal was to predict the course of disease in Iran, one needed to update the parameters regularly as new information becomes available. However, for comparing different policy scenarios, the important point is to run all scenarios using similar parameter values. This study compares the effect of eight different policy options on the spread of COVID-19 pandemic.
5.1. Description of the eight COVID-19 Pandemic Scenarios
Eight different policy scenarios are tested in this study using the aforementioned conceptual framework and methodology. Individuals are passed through the conceptual framework tunnel and based on the model parameters during simulation. Individuals experience one of the different states during each one of the simulation days. The states include susceptible (at risk of exposure), exposed, infected, isolated, hospitalized, deceased, and recovered. In each of the following scenarios, from the 61th day of simulation, an intervention is defined. In other words, from day zero to day 60, individuals are passed through the conceptual tunnel based on specified parameters set in the model. From day 61 onwards in each scenario,6 a policy is applied which may affect these parameter values. Comparing the number of healthy individuals, number of patients, number of patients hospitalized, number of deceased persons and so on in different scenarios one can show the effect of each policy option on the prevalence of COVID-19 disease. The total duration of the simulation is 200 days in all scenarios. The eight scenarios include:
Scenario 1 (No Intervention): In this scenario no intervention takes place after day 60. This scenario is similar to policy without practical action against prevalence of disease or it is the same as what is known as herd immunity.
Scenario 2 (Student Quarantine): Schools and universities are closed from the 61st day of study and students are quarantined at home. Accordingly, since 61st of the simulation all persons who positively answered yes to this question in the census "Are you studying now?” are only exposed to the household probability of infection. In other words, the district probability of infection for students becomes zero.
Scenario 3 (Weekend Lockdown): From the 61st day of the simulation, commuting and movement is free for all individuals on the working days; i.e. Saturday, Sunday, Monday, Tuesday, and Wednesday, but it is banned on the weekends; i.e. Thursday and Friday.
Scenario 4 (Inter-Province Travel Ban): Inter-province (total of 31 provinces) travel ban is exerted from day 61 of the study.
Scenario 5 (Jobless Quarantine): Like other scenarios, there are no restrictions for individuals in the first 60 days of the study. From day 61, only people with jobs (those who declared their activity status as “employed” in the census) are allowed to commute or move and all other individuals are in quarantine. Hence, jobless people are exposed to household probability of infection while working population are exposed to both household and district probabilities of infection.
Scenario 6 (Elderly Quarantine): From day 61 of study, elderly people, i.e. people over 60 years old, are quarantined inside the household.
Scenario 7 (Inter-District Travel Ban): It is similar to inter-province travel ban with the difference that in this scenario the ban is applied at the district (a total of 429) level and individuals cannot move between districts.
Scenario 8 (Iranian School Policy): There are two differences between this scenario and previous ones. First, this scenario starts from the 31st day onwards instead of the 61st day and secondly, this policy applies only for 3 months. According to this policy which bears a resemblance to the policy of Iranian schools, universities and schools are closed on the 31st day of the study (equivalent to February 20, 2020) and supposed to be opened 3 months later just for two months and then closed again. Until day 30 of the study, students (persons who are currently studying) are exposed to the probability of exposure to the disease in three levels. The first level is the probability of exposure to the disease in the district of residence, the second level is the probability of exposure to the disease in household and the third level is the probability of exposure to the disease in school/university. Being quarantined from day 31 to day 120 of study, these people are only exposed to the probability of exposure to the disease in the household level. From day 121 to 180 they are exposed to all three probabilities (which the highest values is used in the model) one more time, then quarantined again from day 181 onwards and therefore are exposed to the probability in the household level.
6. Results
The results presented in this research are based on several times iteration of every policy scenario.7 The reported results for each scenario include the calculation of the median line, where 50% of the iterations are below the line and 50% above it. The first quarter (Q1) shows the line where 25% of the iterations are below it, and 75% are above the line. The third quarter (Q3) shows the line where 75% of the iterations are below it and 25% above the line. The median line of all scenarios is brought together in Figures 2–4, which compare different policy scenarios. Figures 2–4 show the median line of iterations for population at risk (susceptible state), hospitalized patients, and the total number of deaths at different scenarios. Figures 5–7 show all iterations for each policy scenario. The area between the first and third quarters, in these figures, is marked in light blue color. In these figures, the red line represents the median, and the gray lines are single iterations.
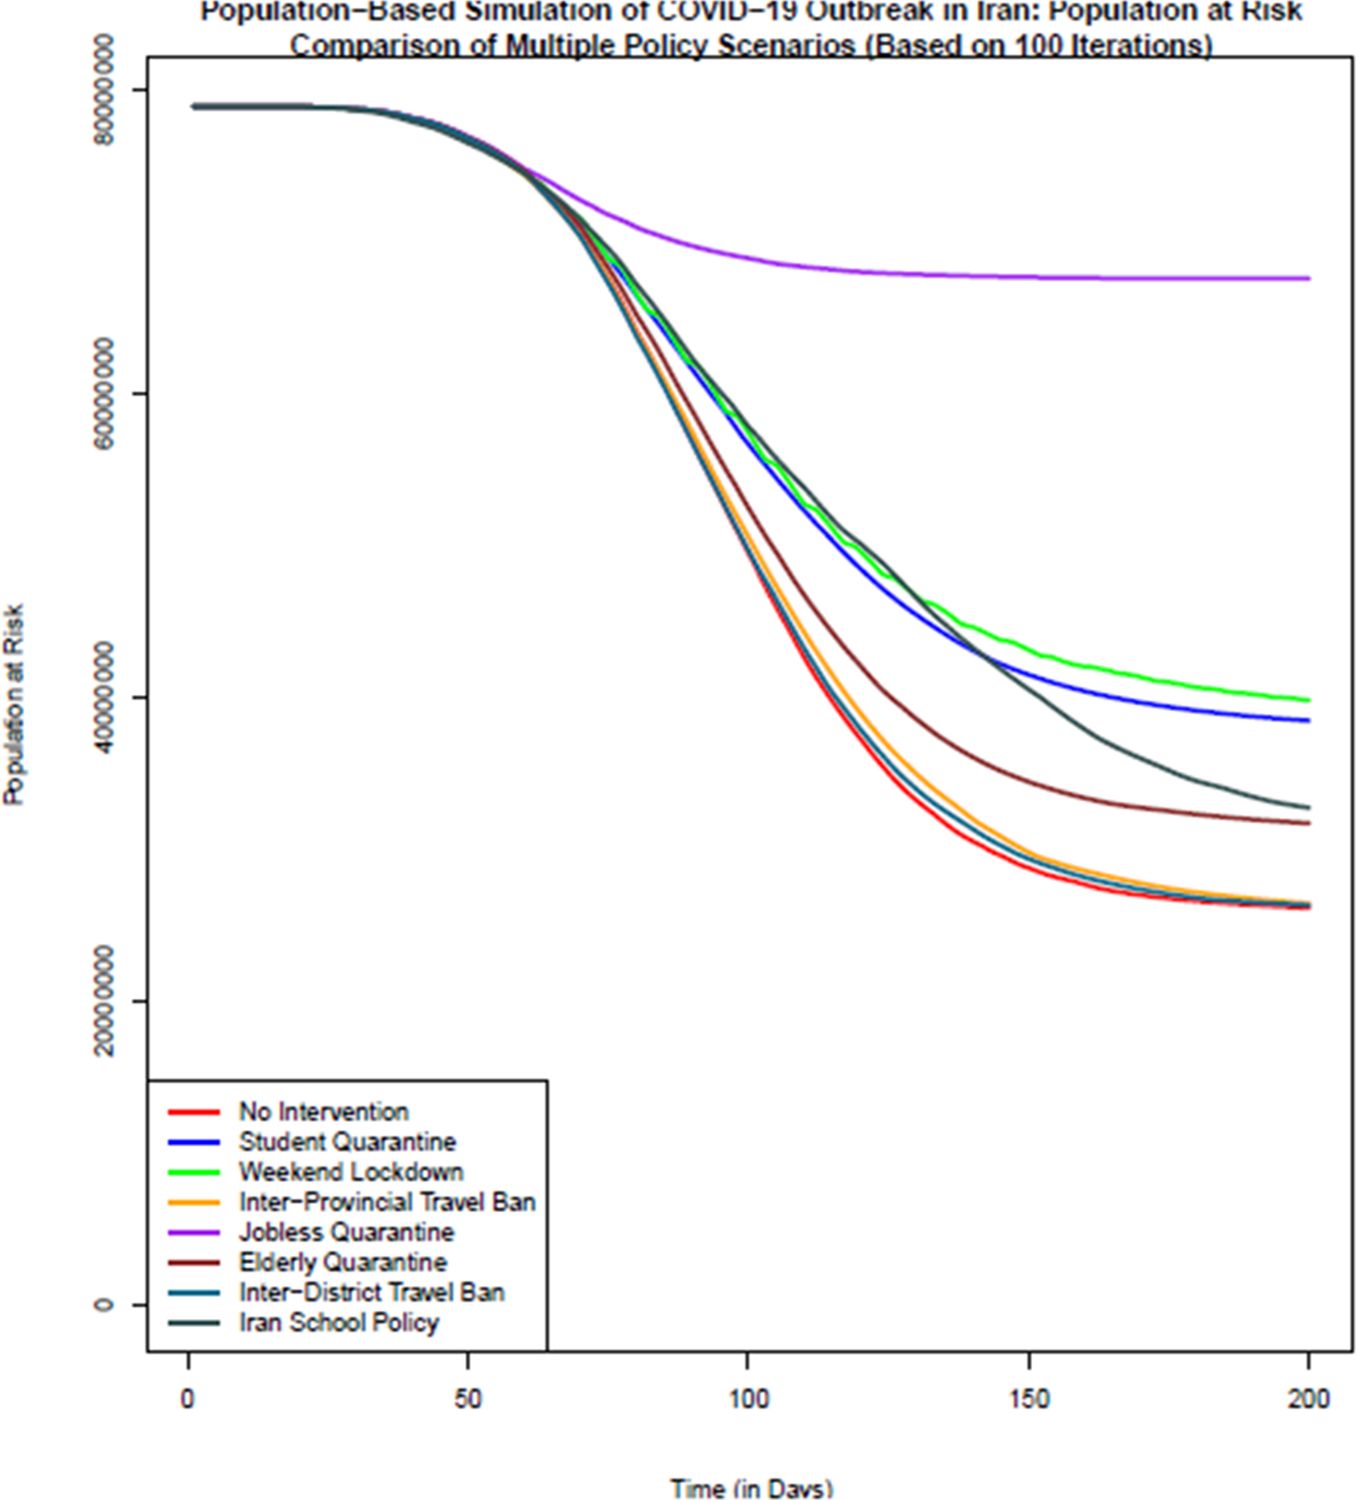
Comparison of the number of population at risk (healthy individuals) in different policy scenarios: population-based simulation based on 100 iterations. Source: The authors’ own analyses on the basis of the national census data of 2016 conducted by the Statistical Center of Iran.
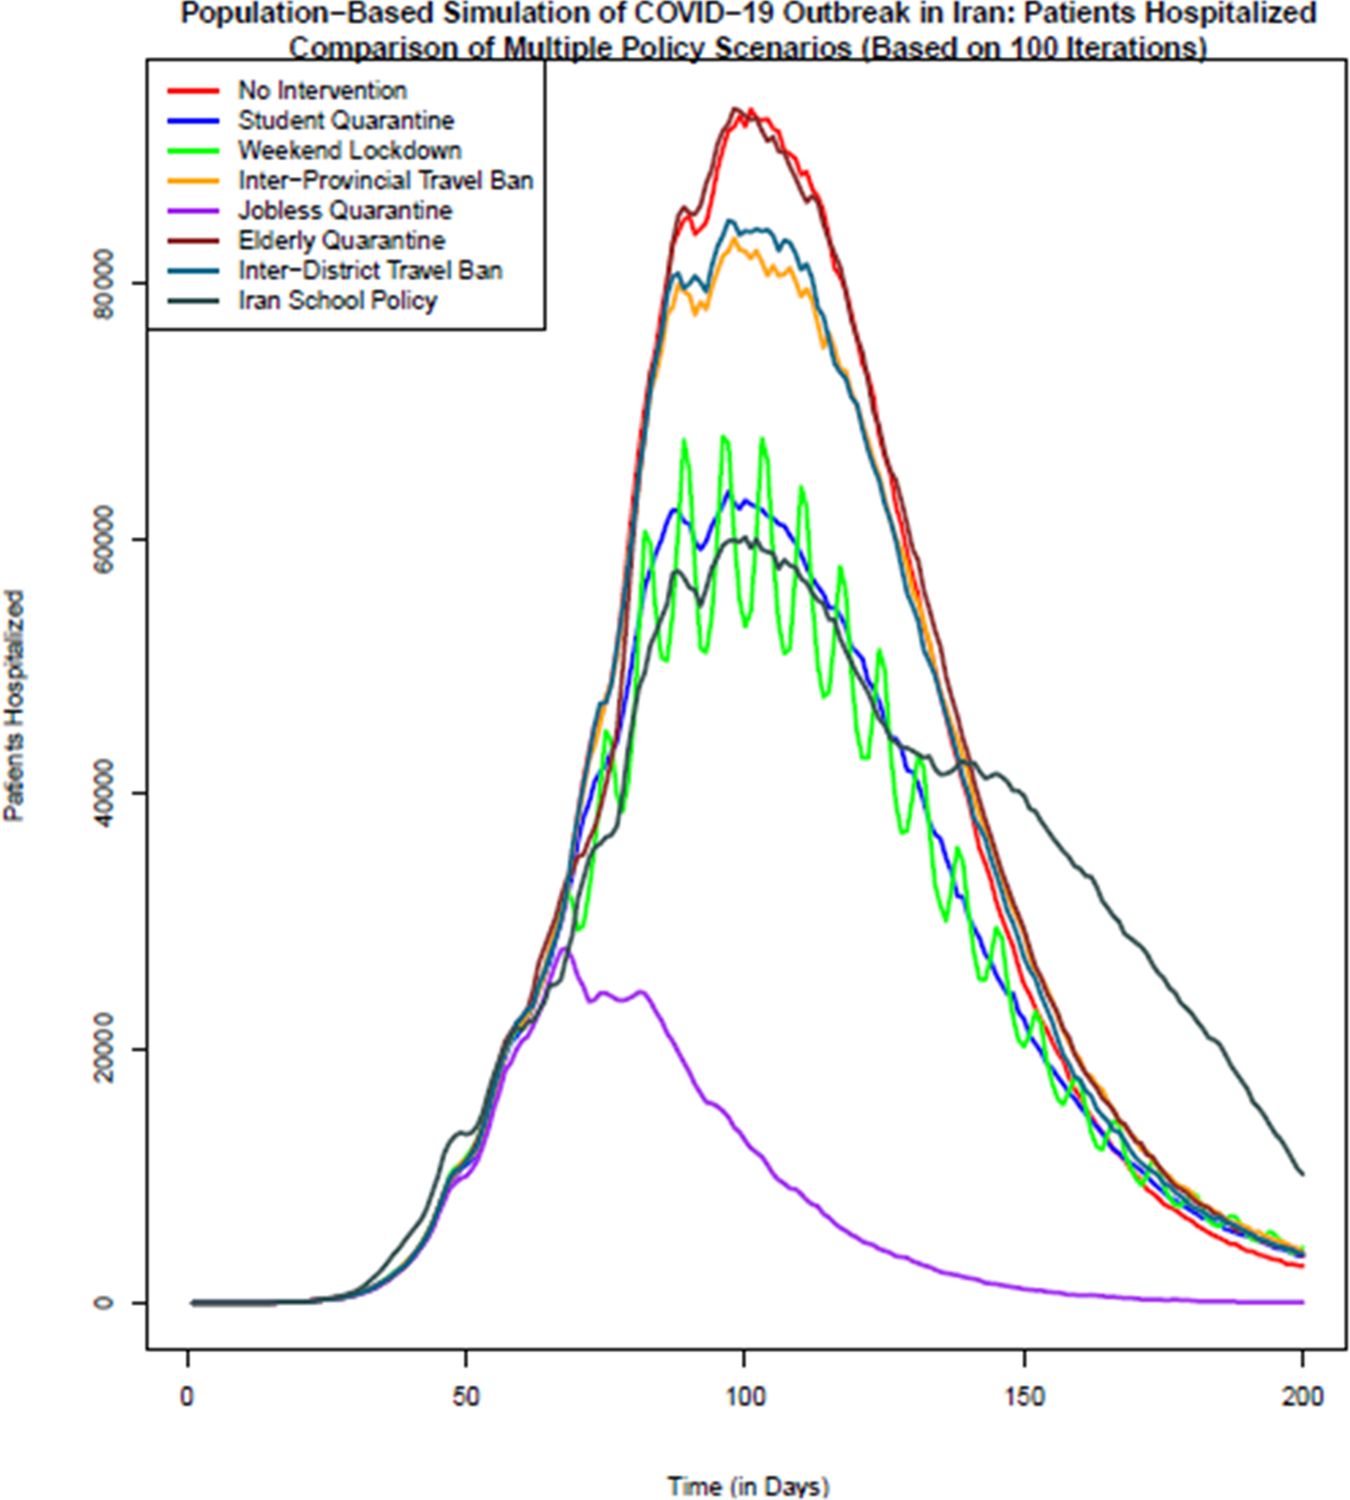
Comparison of the number of patients hospitalized in different policy scenarios: Population-based simulation based on 100 iterations. Source: The authors’ own calculations based on national census data of 2016 conducted by the Statistical Center of Iran.
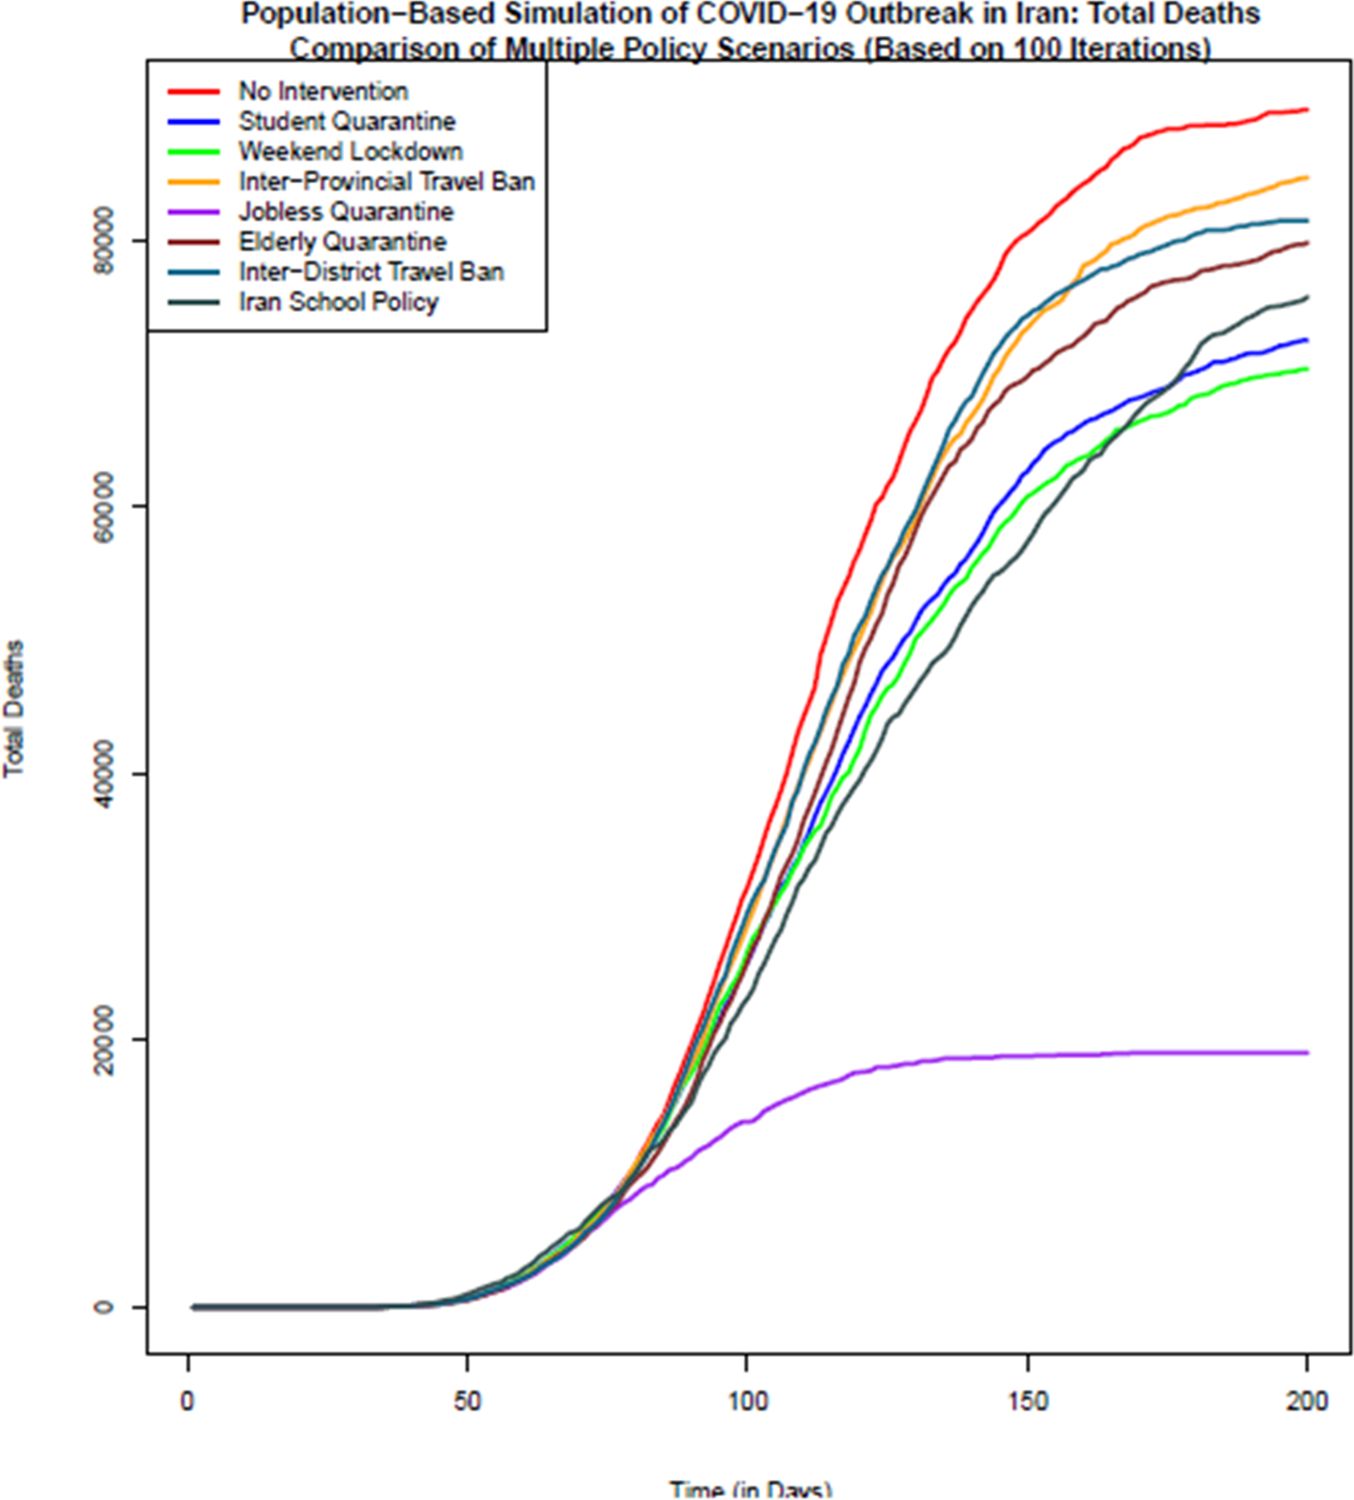
Comparison of the total number of death in different policy scenarios: Population-based simulation based on 100 iterations. Source: The authors’ own calculations based on national census data of 2016 conducted by the Statistical Center of Iran.
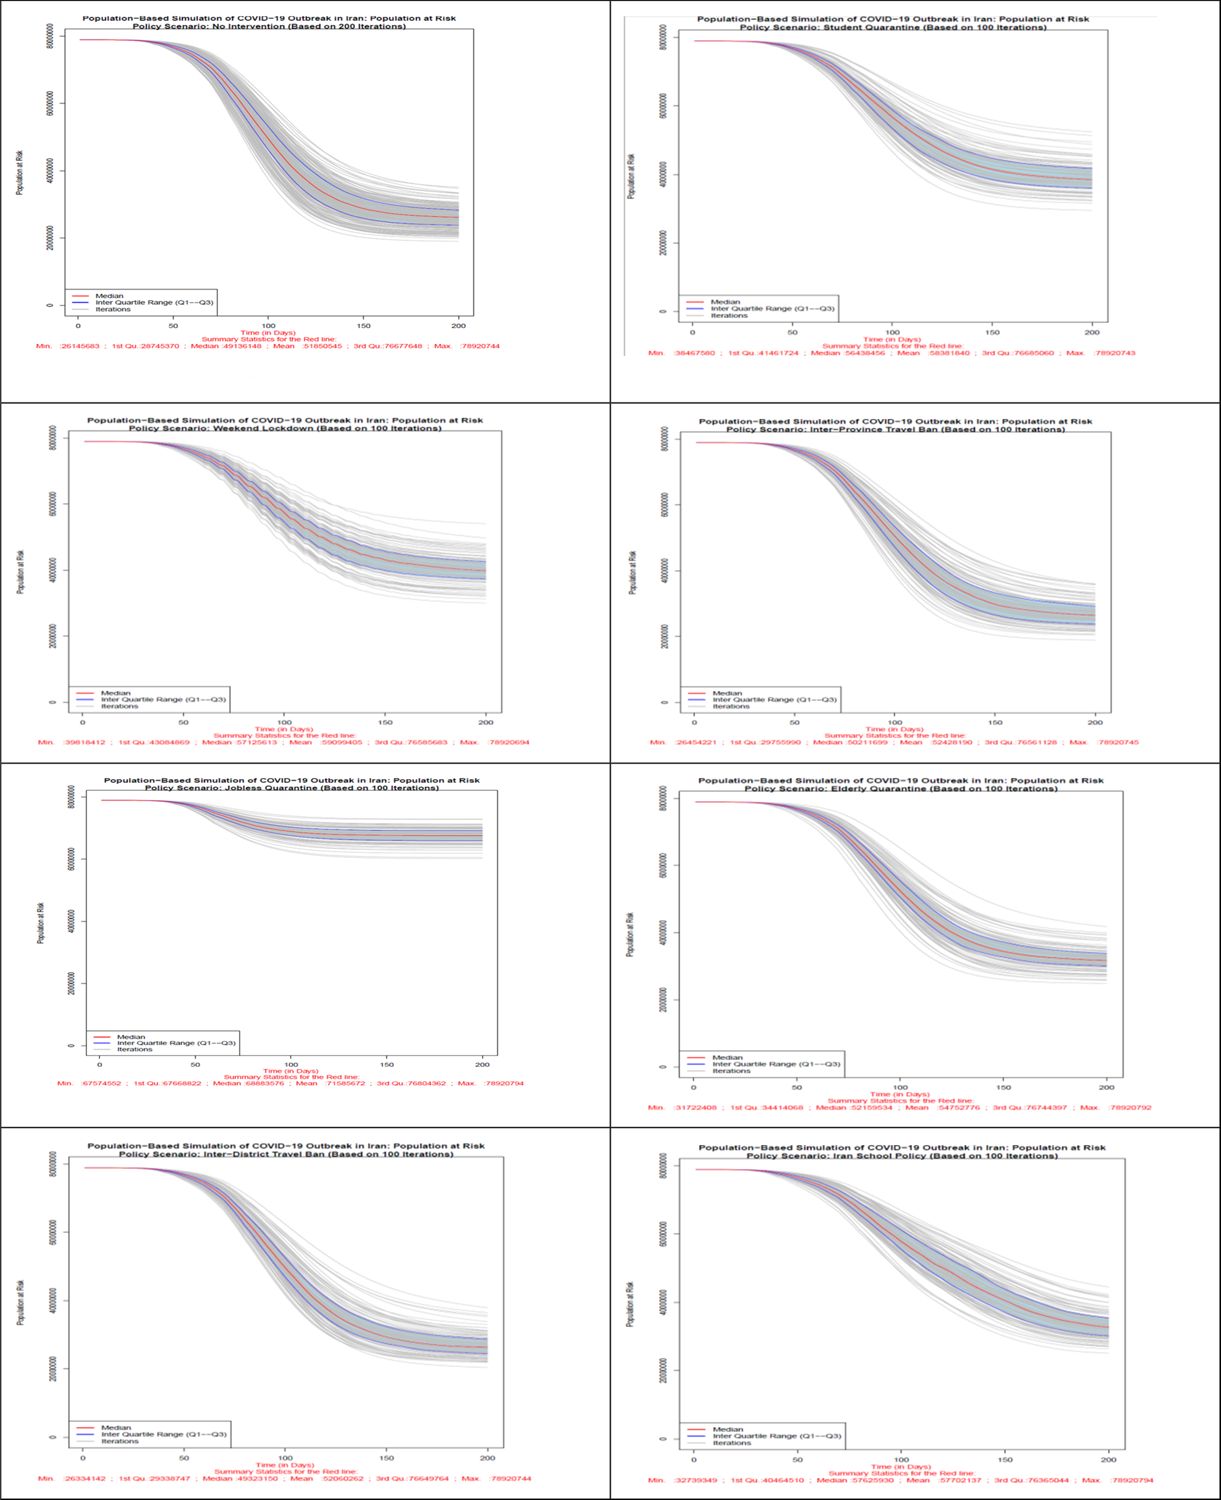
Number of population at risk in all 8 scenarios. Source: The authors’ own calculations based on national census data of 2016 conducted by the Statistical Center of Iran.
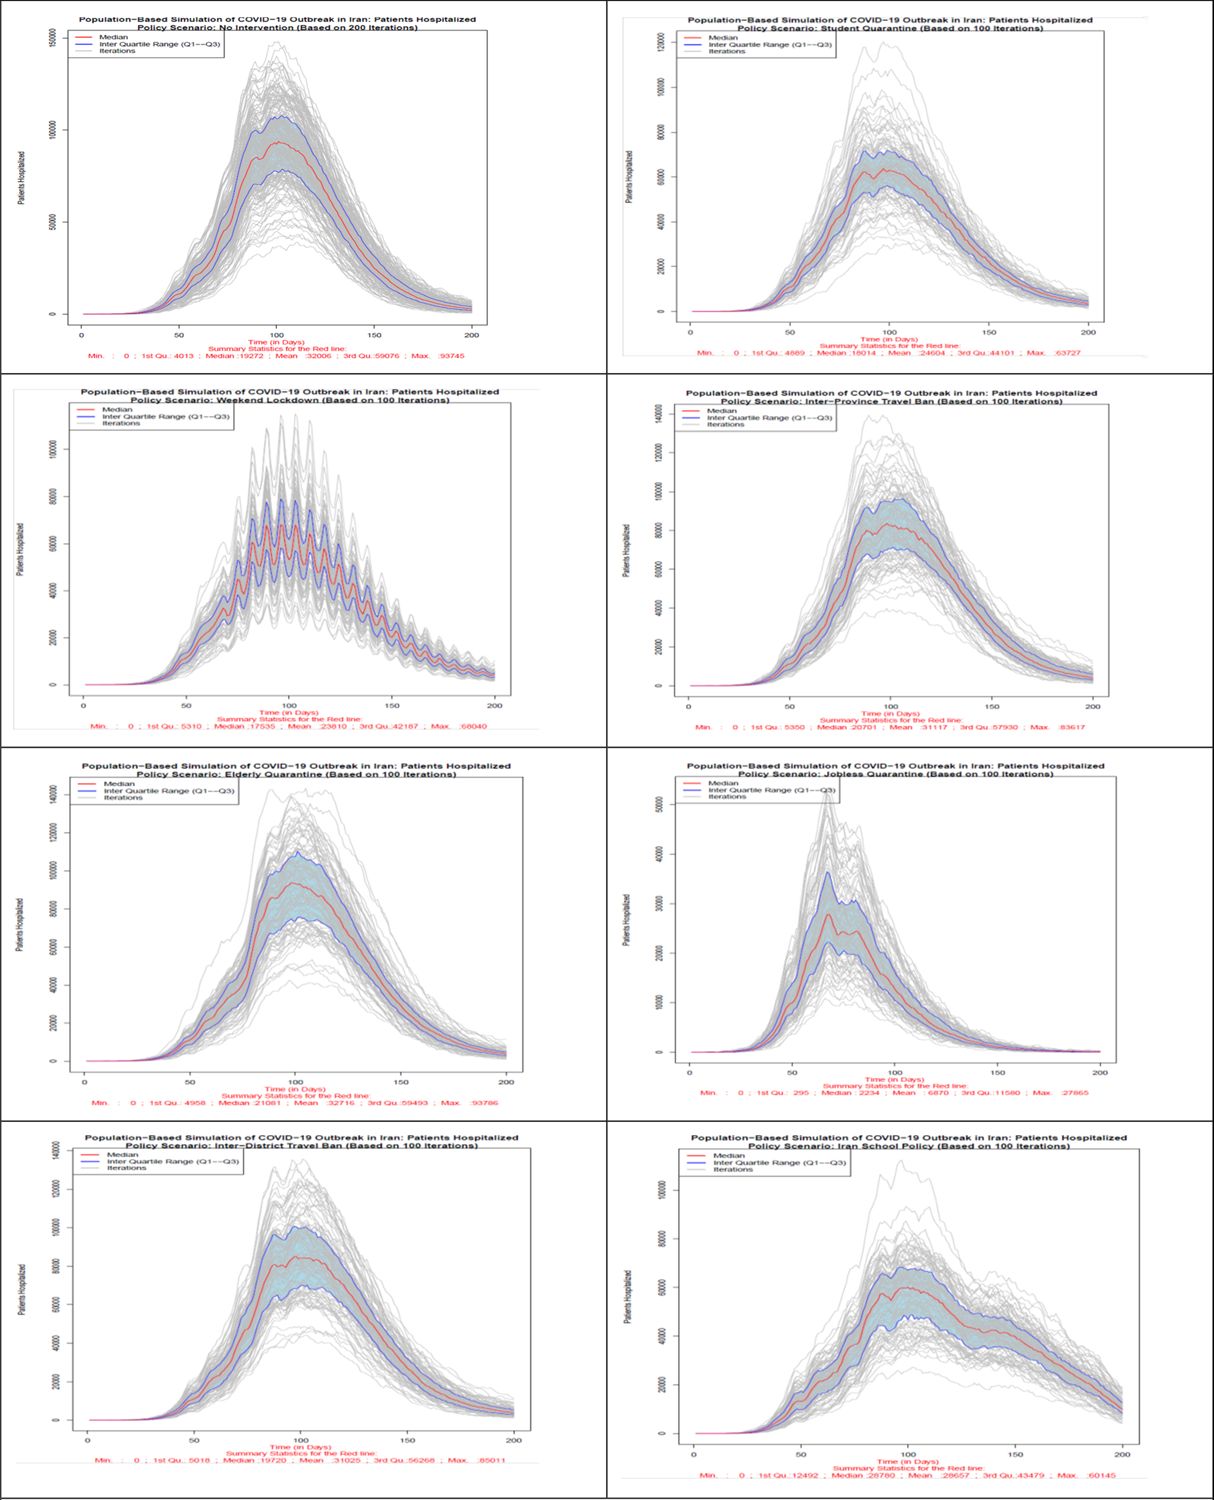
Number of hospitalized patients in all 8 scenarios. Source: The authors’ own calculations based on national census data of 2016 conducted by the Statistical Center of Iran.
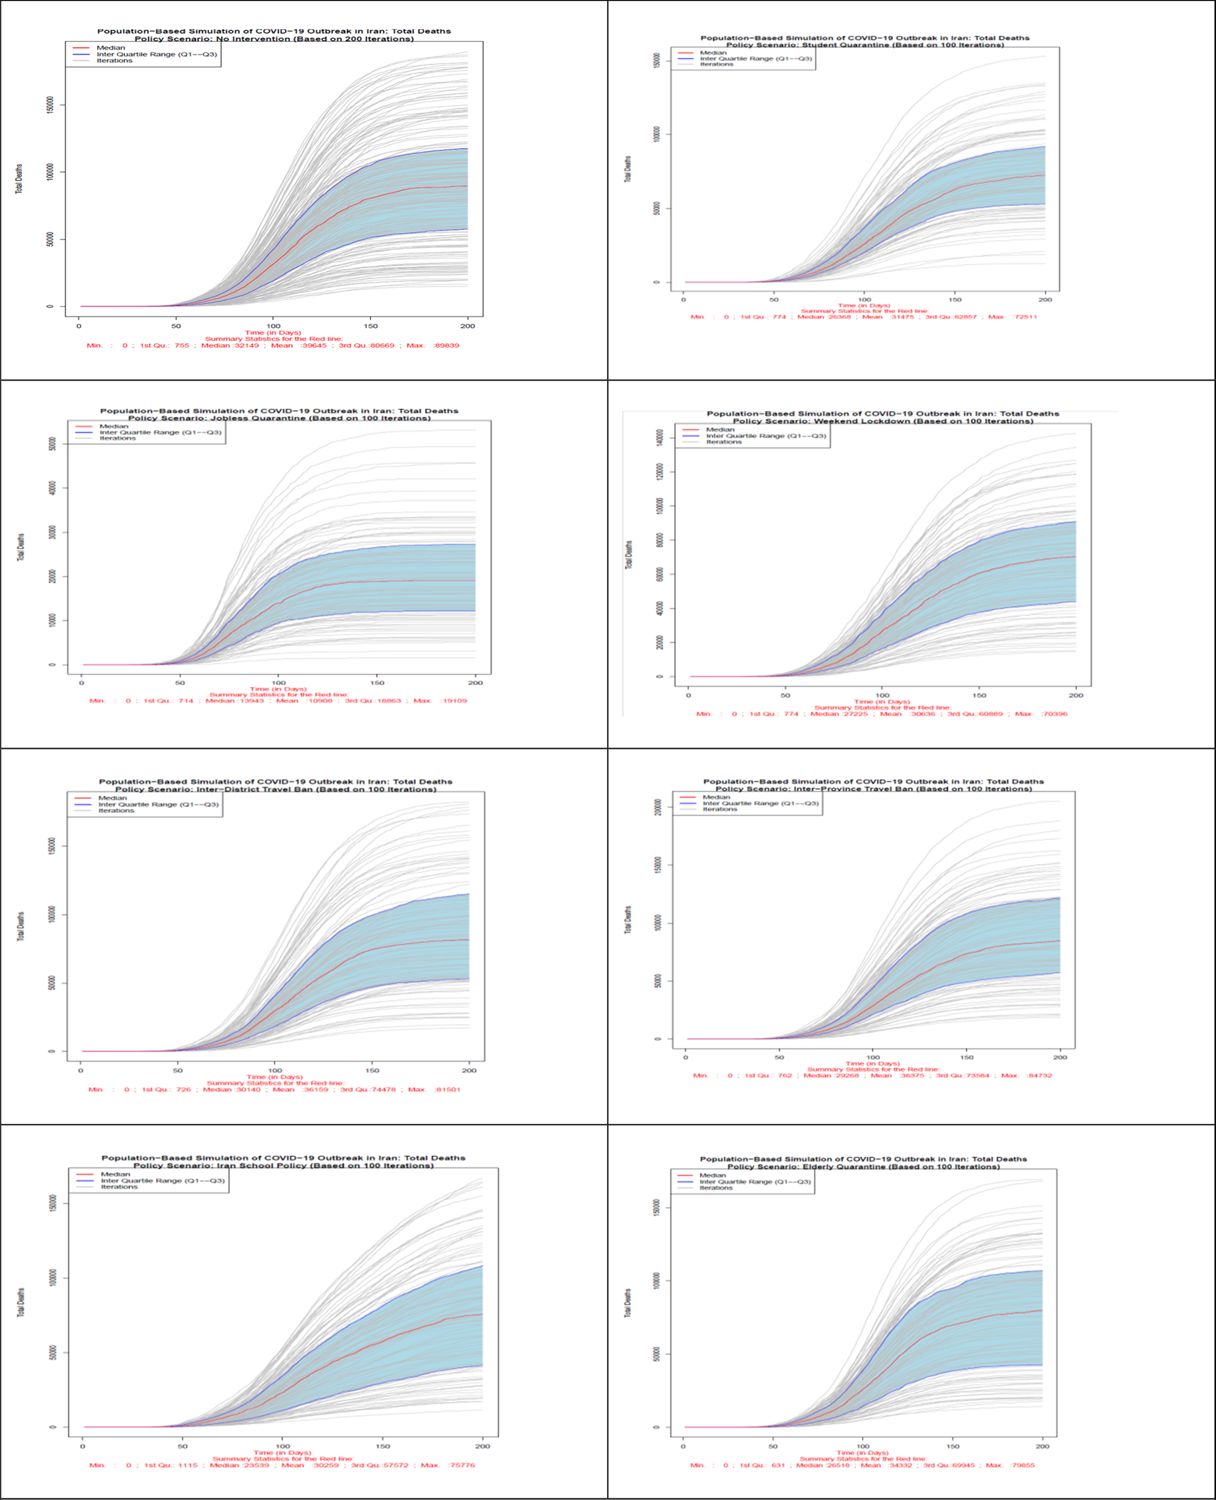
Number of total death in all 8 scenarios. Source: The authors’ own calculations based on national census data of 2016 conducted by the Statistical Center of Iran.
According to Figure 2, the scenario with no intervention on all days of simulation (Scenario 1) has the lowest number of population at risk almost all the times. The most successful disease control policy seems to be the jobless quarantine scenario which has the largest number of healthy individuals at all times after starting of interventions. Based on this figure, of 78,921,893 healthy and susceptible individuals to disease on day zero of study across country, in no-intervention scenario 26,145,683 individuals are still healthy and exposed to disease on the last day of the simulation (day 200). In case of quarantining the students, this number increases to 38,467,580. Providing weekend lockdown, 67,574,552 individuals, with inter-province travel ban 26,334,141 individuals, with jobless quarantining 67,574,552 individuals; with elderly quarantine 31,722,408 individuals; with inter-district travel ban 26,334,142 individuals and with school policy which bears a resemblance to the policy of Iranian schools, 32,739,349 individuals do not get infected during the course of simulation. Therefore, quarantining of jobless individuals, and consequently keeping most people healthy is the most effective scenario among different scenarios. After the scenario without intervention, the least effective scenarios are the inter-district and inter-province travel ban from the 61st day onwards. It seems day 61st is too late for travel ban as districts could have their own outbreak once they have enough of infected population. Figure 2 also confirms this conclusion for all simulation days.
In terms of the hospitalized patients, as Figure 3 shows, no intervention and elderly quarantine policy scenarios have the highest number of hospitalized patients on the most days of the simulation. The lowest number of hospitalized patients is related to the policy option of jobless quarantine, which from the day of implementation of this policy, the 61st day, the number of hospitalized patients shows a decreasing trend. Policy options of students quarantine, weekend lockdown and school closure policy in Iran after the jobless quarantine policy, show the lowest number of hospitalized patients on different days. It should be mentioned that in the school policy of Iran (scenario 8), due to the reopening of the schools after a temporary closure, the number of hospitalized has an increasing trend after the 121st day. The implementation of two policy options of inter-district and inter-province travel ban from the 61st day shows the least effect in reducing the number of hospitalized patients.
In terms of the total number of deaths due to COVID-19 disease, as Figure 4 shows, no intervention scenario or Herd Immunity has the highest number of deaths. The lowest number of death is related to the most effective policy option of jobless quarantine. Closuring policy of Iranian schools and universities due to its early start compared to other policies is the second effective policy in reducing the number of deaths up to day 120 of simulation. With reopening of schools and universities, the number of deaths in this scenario also increases. Like the previous indicators, in terms of the number of deaths as well, inter-district and inter-province travel ban due to late start, are the least effective policies after policy without intervention. Based on this figure, on day 200th of study the median number of deaths in no intervention scenario is 89,839. If the jobless quarantine policy is implemented, this number declines to 19,109 with the highest decrease. Inter-Province Travel Ban with 84,732 deaths and Inter-District Travel Ban with 81,501 deaths are the least effective policy scenarios to reduce deaths from COVID-19 disease. Quarantining of students after the 60th day of study until the last day of simulation is the second most effective policy.
6.1. Simulation results by the scenarios
The results related to the number of (healthy) exposed population, infected, hospitalized patients, and total deaths are shown in the Figure 5–7. The median lines are marked in red, the first and third quarter lines are marked in blue, and the area between the quarters are marked in light blue. The results presented here are mainly based on the median line.
Scenario 1 (No Intervention): In this scenario, which was conducted in 200 iterations, all individuals are exposed to the disease at district and household level probabilities of infection. Based on the information of the median lines, red color, 26,145,683 individuals won’t get infected with the disease at the end of the 200-day period. The highest number of patients in one day will reach to 6,865,231 individuals and the maximum number of hospitalized patients in one day will reach to 93,745 individuals. At the end of the simulation period, the total number of deaths will be 89,839 individuals.
Scenario 2 (Student Quarantine): The number of iterations of this and the other remaining scenarios are 100 iterations. As explained earlier, in this scenario, students are quarantined at home from day 61 of the iteration. Students comprise 21.8% of the census data. Hence, about 78% of the population will be exposed to both district and household level probabilities of exposure and students exposure probabilities are limited to household level during the policy. Based on the information of the median lines, red color, by applying this scenario, 38,467,580 individuals won’t get infected with the disease at the end of the 200th day of the study. The highest number of patients in one day will reach to 4,727,158 individuals while the maximum number of hospitalized patients (including new and previously hospitalized patients) in one day will reach to 63,727 individuals. At the end of the simulation period, the total number of deaths will be 72,511 individuals.
Scenario 3 (Weekend Lockdown): In this scenario, during the policy implementation all population groups are exposed to both district and household level probabilities during the 5 work-days and only to household level probabilities for the 2 week-end days. Based on the information of the median lines, red color, of Figure 5–7 by applying this scenario from the 61st day of the simulation, 39,818,412 individuals won’t get infected with disease at the end of the 200th day. The highest number of patients in one day will reach to 4,806,783 individuals while the maximum number of hospitalized patients in one day will reach to 68,040 individuals. At the end of the simulation period, the total number of deaths will be 70,396 individuals.
Scenario 4 (Inter-Province Travel Ban): In this scenario, starting from day 61 of the simulation, travels between provinces are prohibited, however, movement between districts of each province is allowed. All population groups are exposed to both district and household level probabilities during the policy implementation. Based on the information of the median lines, red color, by applying this scenario, 26,454,221 individuals won’t get infected with the disease at the end of the 200th day period. The highest number of patients in one day will reach to 6,356,434 individuals while the maximum number of hospitalized patients in one day will reach to 83,617 individuals. At the end of the simulation period, the total number of deaths will be 84,732 individuals.
Scenario 5 (Jobless Quarantine): As explained earlier, in this scenario, all population groups are quarantined at home from day 61 of the iteration, except those who have a job. According to the 2% sample data of 2016 census data, about 28.5% have stated their economic activity status as “employed”. Hence, about 71.5% of the population will be exposed to only household level probability of exposure during the policy implementation and employed population’s exposure probabilities will include both district and household levels. Based on the information of the median lines, red color, by applying this scenario, 67,574,552 individuals won’t get infected with the disease at the end of the 200th day. The highest number of patients in one day will reach to 1,969,160 individuals while the maximum number of hospitalized patients in one day will reach to 27,865 individuals. At the end of the simulation period, the total number of deaths will be 19,109 individuals. This scenario is the most effective policy in reducing the number of infected individuals, hospitalized patients, and the total number of deaths.
Scenario 6 (Elderly Quarantine): In this scenario, all elderly people (population aged 60+) are quarantined at home from day 61 of the iteration. Elderly people comprise 9.4% of the census data. Hence, more than 90% of the population will be exposed to both district and household level probabilities of exposure and population aged 60 and above are exposed to only household level probabilities during the policy. Based on the information of the median lines of Figures 5–7, red color, by applying this scenario, 31,722,408 individuals are still healthy at the end of the study period. The highest number of patients in one day will reach to 5,861,062 individuals while the maximum number of hospitalized patients in one day will reach to 93,786 individuals. At the end of the simulation period, the total number of deaths will be 79,855 individuals.
Scenario 7 (Inter-District Travel Ban): This policy restricts exchange of all population groups, including the infected, between districts. In this scenario, starting from day 61 of the simulation, travels between districts, including those in a same province, are prohibited. All population groups are exposed to both district and household level probabilities during the policy implementation. Based on the information of the median lines, red color, by applying this scenario, 26,334,142 individuals won’t get infected with the disease at the end of the 200th day of the study. The highest number of patients in one day will reach to 6,553,475 individuals while the maximum number of hospitalized patients in one day will reach to 85,011 individuals. At the end of the simulation period, the total number of deaths will be 81,501 individuals.
Scenario 8 (Iranian School Policy): This policy, which resembles Iran school policy at early days of the outbreak, is similar to scenario 2 in terms of the affected population. During the restriction periods of this scenario, 21.8% of the population is exposed to household probabilities of exposure to the infection. Based on the information of the median lines of the figures, red color, by closuring of schools and universities from the 31st day onwards for 3 months and reopening it for 2 months and then quarantining students at home again, 32,739,349 individuals will be healthy (not infected at all) at the end of the simulation period. The highest number of patients in one day will reach to 4,244,883 individuals while the maximum number of hospitalized patients in one day will reach to 60,145 individuals. At the end of the simulation period, the total number of deaths will be 75,776 individuals. In the case of preventing schools and universities from reopening, this scenario could become the second most effective policy in declining the prevalence of COVID-19 disease. It should be noted that the results of this scenario is not comparable to previous scenarios due to different start day for policies. This scenario is more effective than the similar scenario 2 policy option because of its early implementation, i.e. day 31st instead of 61st.
7. Conclusion
The purpose of this study is to compare different policy options in Iran to prevent the spread of COVID-19 cycle and achieve the best policy scenarios. To reach this goal, the conceptual framework of the model proposed by the Iran’s National Corona Virus Taskforce has been developed and expanded in this study to include socioeconomic, demographic, and geographical variables. The simulation results of the Coronavirus Taskforce demonstrated that in the absence of new treatments, vaccines and stability of the contagious and infectivity rate of coronaviruses, the natural course of disease will continue in Iran in the coming years and is expected to affect up to 63% of population. This value is similar to the values predicted in other countries of the world. From their point of view, the most effective tool available is patient isolation to delay the severe wave of disease, so that suspected and infected patients have the least contact with healthy population and thus break the transmission chain.
In terms of comparison with other statistical models suggesting policy interventions, Pourmalek et al. (2021) conducted a rapid review to inform researchers about the methodology and results of epidemic estimation studies performed for COVID-19 epidemic in Iran. They believe that COVID-19 models which consider scenarios for policy options include key influencing factors such as role of asymptomatic cases in spread of the disease, under-reporting of deaths and cases, testing availability, and delayed diagnosis, and providing estimates for sub-national regions are more useful for epidemic control. This study has shown that most studies about COVID-19 intended to predict the upcoming situation. However, most of them were unsuccessful in evaluating and presenting policy interventions. This failure was rooted in two distinct reasons. First, using inappropriate data which did not represent heterogeneous population structure of Iran and second, making a model that considered the same probability of infection and death for all population assuming homogeneity of the entire population of Iran.
Contrary to the model proposed by the Coronavirus Taskforce, which uses the macro method and assumes that the entire population of Iran is homogeneous, the main innovation of our study was to use real micro and demographic data in order to simulate the COVID-19 outbreak in Iran. This data allowed us not only to be able to simulate COVID-19, but also to examine various policy scenarios. After defining and investigating eight scenarios including no Intervention, student quarantine, weekend lockdown, inter-province travel ban, jobless quarantine, elderly quarantine, inter-district travel ban, and Iranian school policy, we came to the conclusion that in terms of the number of population at risk, hospitalized patients and total number of deaths, Jobless quarantine is by far the most effective policy option in preventing the rapid spread of the COVID-19 in Iran. In all scenarios, the results are compared with the first scenario i.e. no intervention. In jobless quarantine scenario, all of these people must stay at home and the probability of infection for these people will only be at the household level. This seems to be true because of some demographic characteristics of Iran such as the low employment rate for women, high unemployment rate and the high proportion of student population. On the other hand, regarding restrictions on mobility and population movement, inter-province travel ban and inter-district travel ban scenarios are effective in the early stages of the disease, but if the infected population are scattered in all provinces/districts, these policies will play little role.
Footnotes
1.
According to the population clock of the Statistical Centre of Iran, the population of Iran on April 1, 2020 was 83,399,663 people which shows a 5.67% growth in Iran’s population since November 2016 census. All reported numbers in this report must be multiplied by 1.0567 to get the numbers for 2020.
2.
All R codes are available on-demand from the corresponding author.
3.
Numbers of daily effective contacts proposed by national experts in increments of 10 days are 13, 12, 10, 9, 5, 4, 5, 6, & 5 for the first 90 days of simulation. The number is fixed at 5 for the rest of study duration.
4.
The mean and SD of most parameters in this table are taken from national taskforce modeling study.
5.
6.
The important thing about scenarios is that all scenarios are hypothetical. The day chosen for the simulation may have different effects, but the goal is to compare scenarios. So, we have to choose a specific day for all scenarios. In the case of the last scenario, Iranian School Policy, its simulation started on the 31 day and this is because Iranian schools have been closed since the 30th day. All other scenarios start from day 61.
7.
The initial plan was to run all scenarios at least 200 times. However, due to time consuming nature of simulation, only first policy scenario has 200 iterations and the remaining are run by 100 times.
References
-
1
Mathematical models to characterize early epidemic growth: A reviewPhysics of Life Reviews 18:66–97.https://doi.org/10.1016/j.plrev.2016.07.005
-
2
Agent-Based Models of Geographical Systems85–105, Introduction to agent-based modelling, Agent-Based Models of Geographical Systems, Dordrecht, Netherlands, Springer, p, 10.1007/978-90-481-8927-4.
-
3
How simulation modelling can help reduce the impact of COVID-19Journal of Simulation 14:83–97.https://doi.org/10.1080/17477778.2020.1751570
-
4
Simulation-Based Estimation of the Spread of COVID-19 in IranMedrxiv.https://doi.org/10.1101/2020.03.22.20040956
-
5
Bringing consistency to simulation of population models--Poisson simulation as a bridge between micro and macro simulationMathematical Biosciences 209:361–385.https://doi.org/10.1016/j.mbs.2007.02.004
- 6
-
7
Ministry of Health and Medical Education (MOHME)20, First report of modeling COVID-19 epidemic in Iran, Ministry of Health and Medical Education (MOHME), Tehran, Iran.
-
8
Challenges and Opportunities of Dynamic Microsimulation ModellingInternational Journal of Microsimulation 16:1–13.https://doi.org/10.34196/IJM.00280
-
9
Leveraging Computational Modeling to Understand Infectious DiseasesCurrent Pathobiology Reports 8:149–161.https://doi.org/10.1007/s40139-020-00213-x
-
10
Microsimulation Modeling for Health Decision Sciences Using R: A TutorialMedical Decision Making 38:400–422.https://doi.org/10.1177/0272989X18754513
-
11
Statistical inference in a stochastic epidemic SEIR model with control intervention: Ebola as a case studyBiometrics 62:1170–1177.https://doi.org/10.1111/j.1541-0420.2006.00609.x
- 12
-
13
Microsimulation for demographyAustralian Population Studies 1:73–85.https://doi.org/10.37970/aps.v1i1.14
-
14
Projecting health-ageing trajectories in Europe using a dynamic microsimulation modelScientific Reports 11:1785.https://doi.org/10.1038/s41598-021-81092-z
-
15
Rapid review of COVID-19 epidemic estimation studies for IranBMC Public Health 21:257.https://doi.org/10.1186/s12889-021-10183-3
-
16
COVID-19 Pandemic and Comparative Health Policy Learning in IranArchives of Iranian Medicine 23:220–234.https://doi.org/10.34172/aim.2020.02
-
17
The 2016 National Census of Population and Housing (Post-Enumeration Survey; Sample Design)Tehran: Statistical Center of Iran.
-
18
The 2016 National Census of Population and Housing (Post-Enumeration Survey)Tehran: Statistical Center of Iran.
-
19
Estimating COVID-19-Related Infections, Deaths, and Hospitalizations in Iran Under Different Physical Distancing and Isolation ScenariosInternational Journal of Health Policy and Management 11:334–343.https://doi.org/10.34172/ijhpm.2020.134
-
20
What is Social Science Microsimulation?Social Science Computer Review 29:9–20.https://doi.org/10.1177/0894439310370085
-
21
Microsimulation methods for population projectionPopulation 53:97–136.https://doi.org/10.3917/popu.p1998.10n1.0136
-
22
Modeling and analysis of different scenarios for the spread of COVID-19 by using the modified multi-agent systems - Evidence from the selected countriesResults in Physics 20:103662.https://doi.org/10.1016/j.rinp.2020.103662
-
23
Risk estimation and prediction of the transmission of coronavirus disease-2019 (COVID-19) in the mainland of China excluding Hubei provinceInfectious Diseases of Poverty 9:116.https://doi.org/10.1186/s40249-020-00683-6
-
24
Estimation of the time-varying reproduction number of COVID-19 outbreak in ChinaInternational Journal of Hygiene and Environmental Health 228:S1438-4639(20)30213-3.https://doi.org/10.1016/j.ijheh.2020.113555
-
25
Microsimulation in Demographic ResearchInternational Encyclopedia of Social and Behavioral Sciences.https://doi.org/10.1016/B978-0-08-097086-8.31018-2
-
26
A Model for COVID-19 Prediction in Iran Based on China ParametersArchives of Iranian Medicine 23:244–248.https://doi.org/10.34172/aim.2020.05
Article and author information
Author details
Hananeh Sadat Sadeghi

Funding
No specific funding for this article is reported.
Publication history
- Version of Record published: April 30, 2024 (version 1)
Copyright
© 2024, Eini-Zinab and Sadeghi
This article is distributed under the terms of the Creative Commons Attribution License, which permits unrestricted use and redistribution provided that the original author and source are credited.