Population-based Simulation of COVID-19 Outbreak in Iran: Comparison of Different Policy Options
- Department of Community Nutrition, Iran
- Department of Demography, Iran
Cite this article
as: H. Eini-Zinab, H. Sadat Sadeghi; 2024; Population-based Simulation of COVID-19 Outbreak in Iran: Comparison of Different Policy Options; International Journal of Microsimulation; 17(1); 102-121.
doi: 10.34196/ijm.00305
Figures
Figure 1
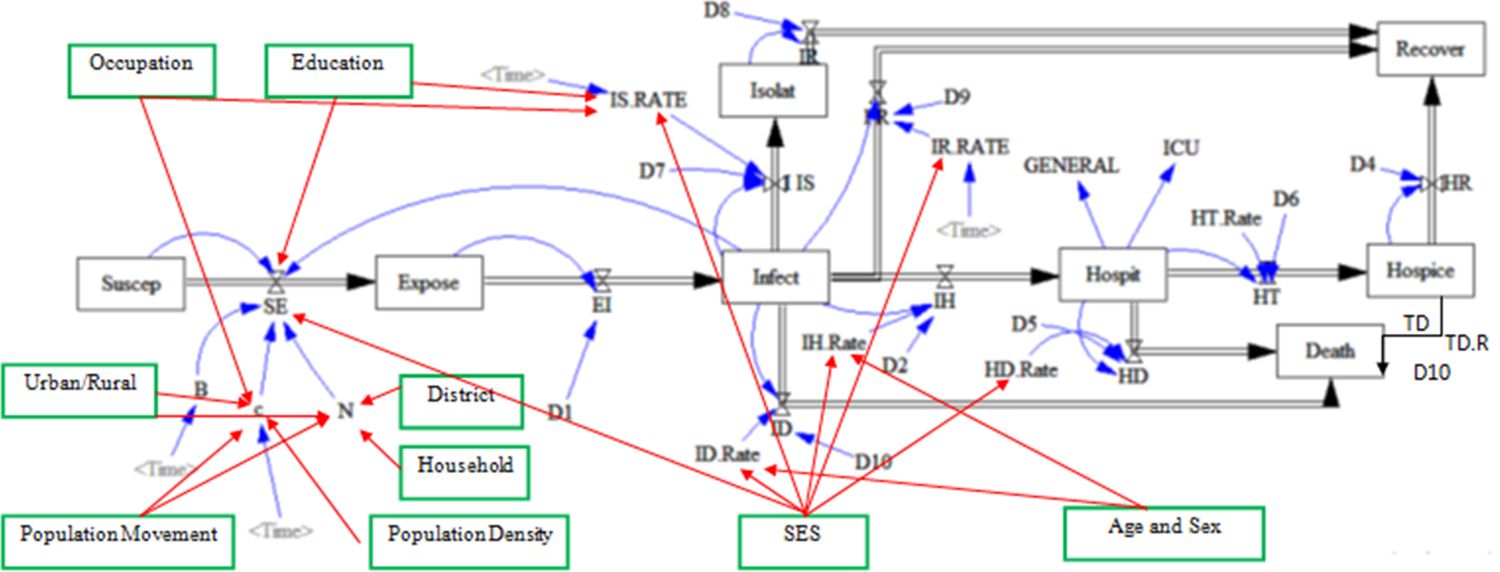
Extended conceptual framework in the present study for the outbreak of COVID-19. Source: The Epidemiological Committee of Iran’s National Corona virus Taskforce. The new variables illustrated via green boxes and red lines are added to the original conceptual framework by authors.
Figure 2
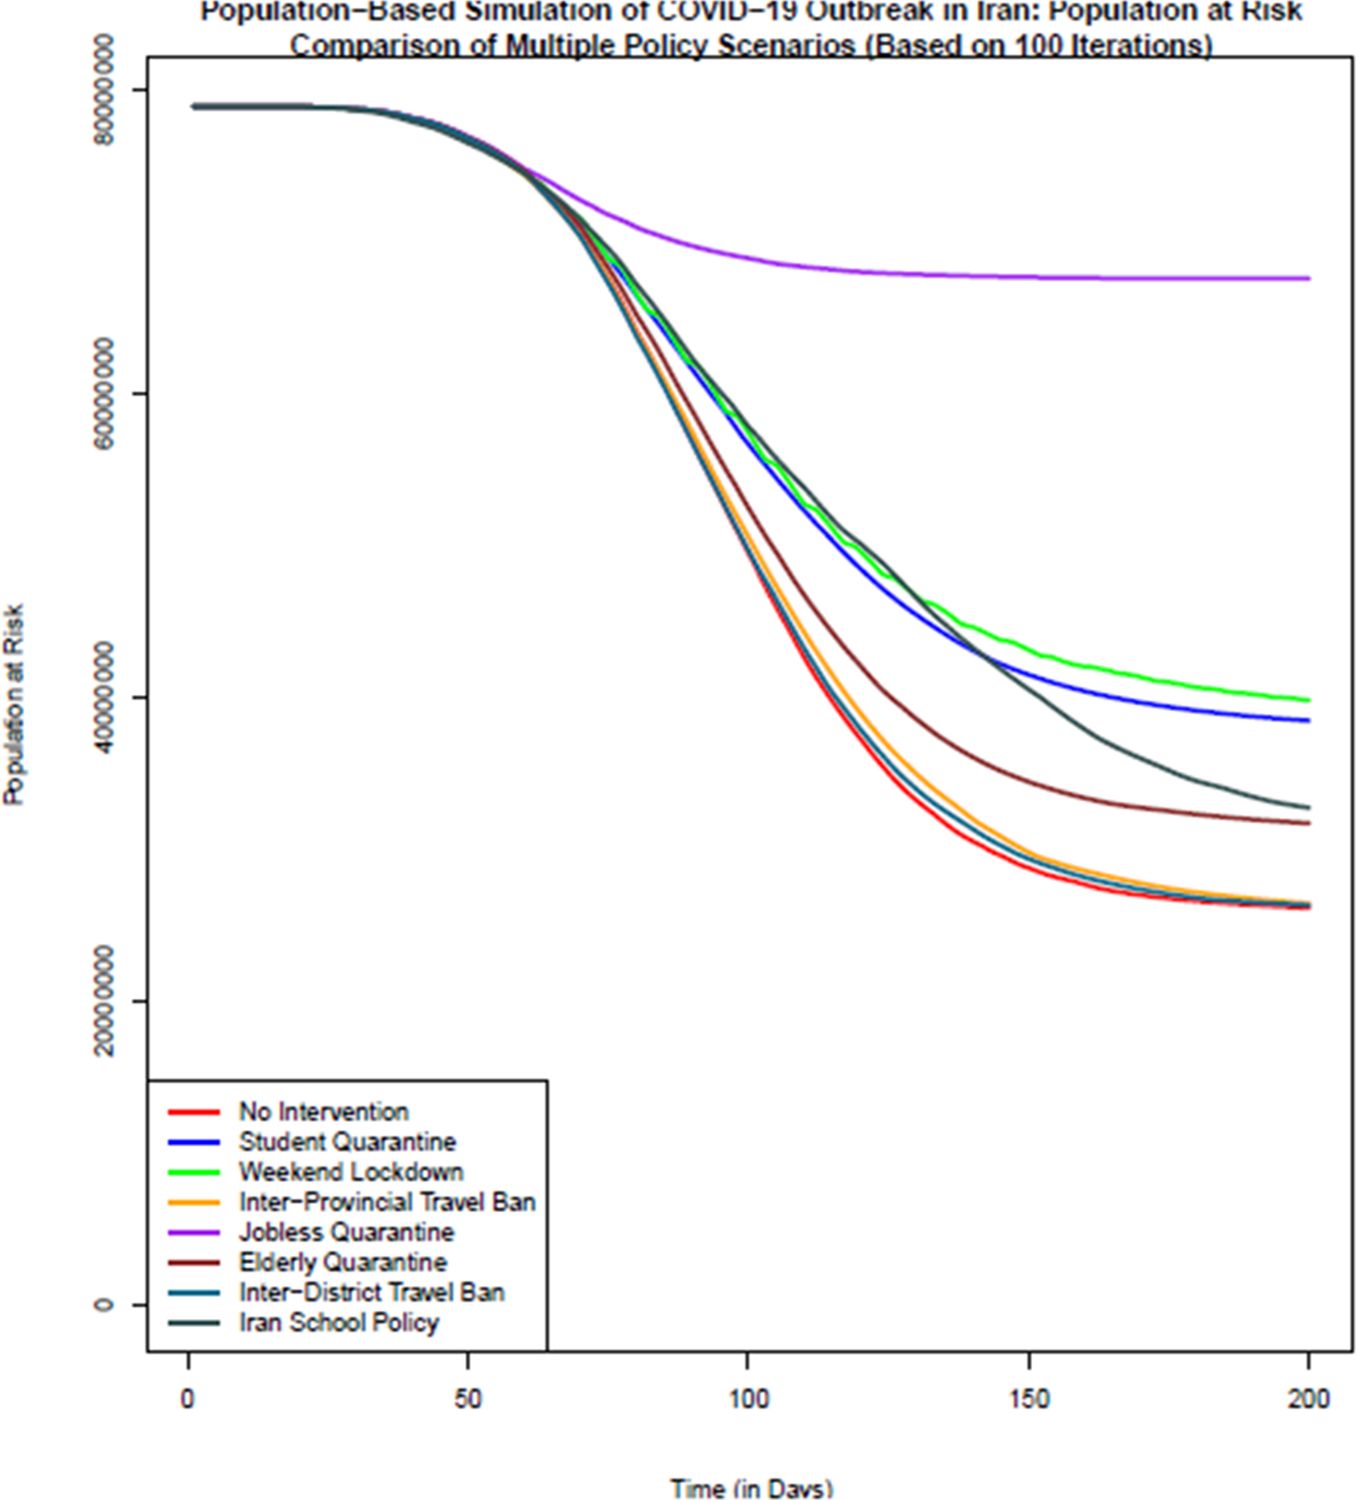
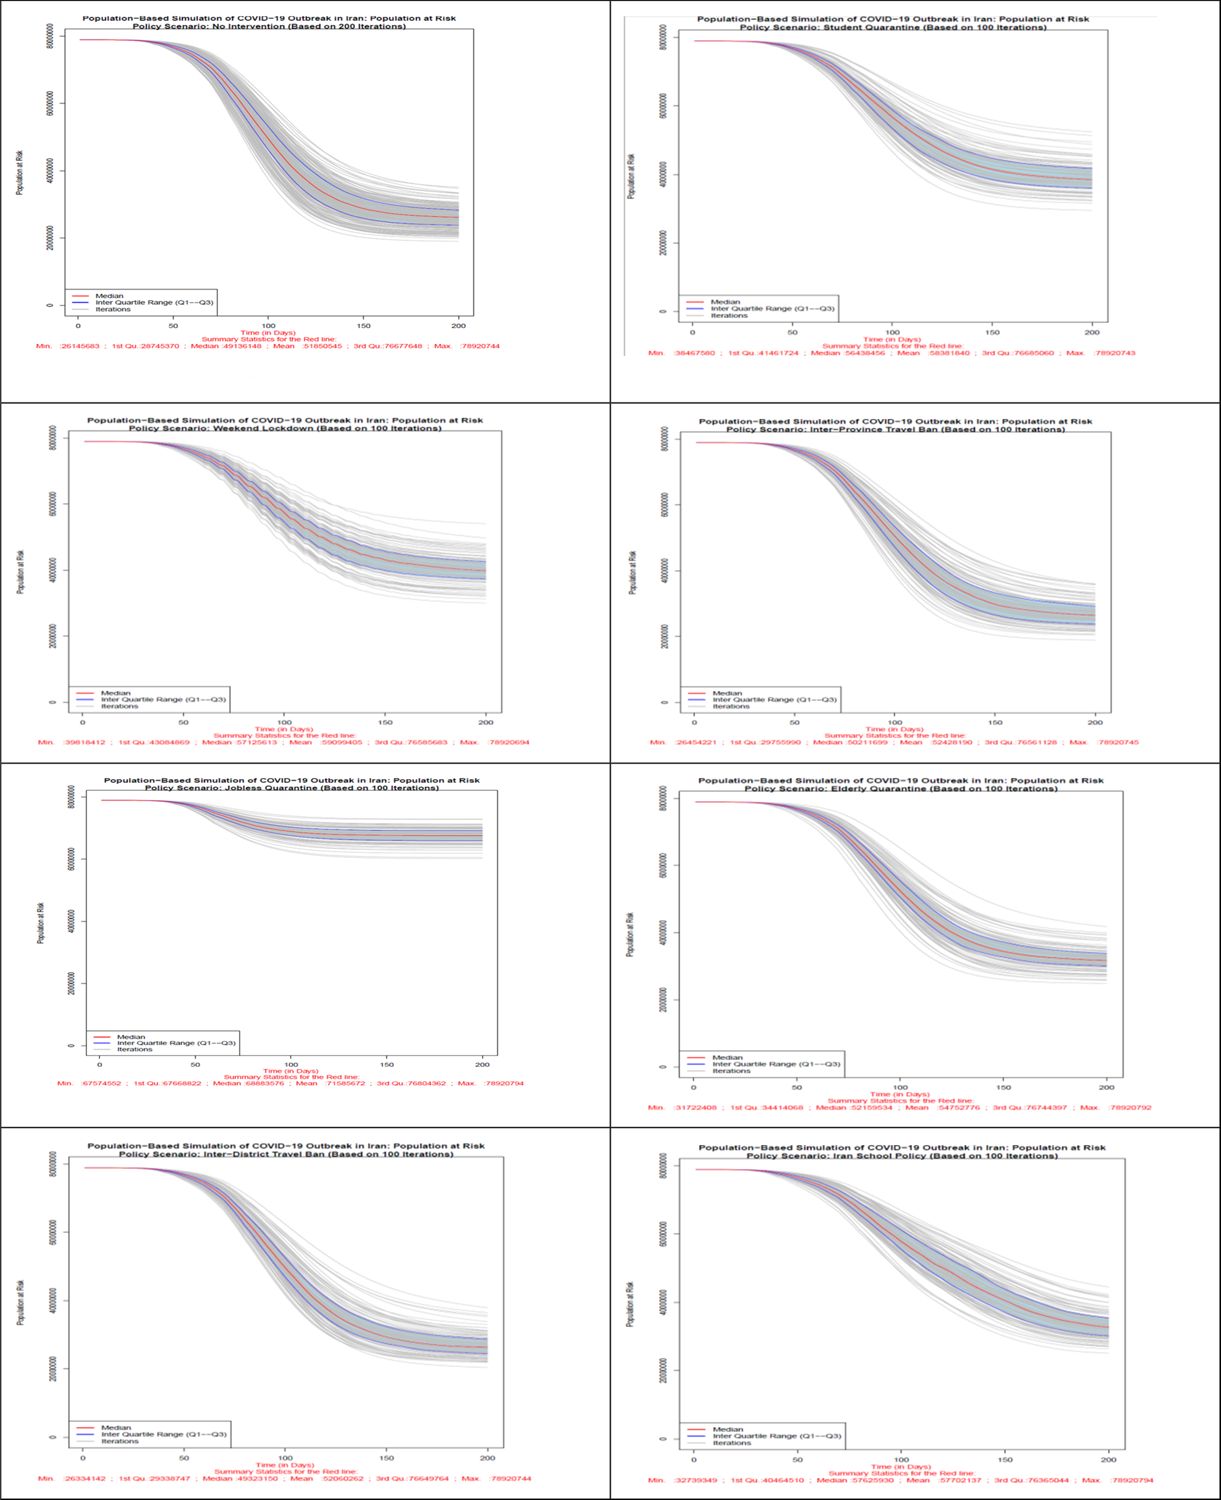
Comparison of the number of population at risk (healthy individuals) in different policy scenarios: population-based simulation based on 100 iterations. Source: The authors’ own analyses on the basis of the national census data of 2016 conducted by the Statistical Center of Iran.
Figure 3
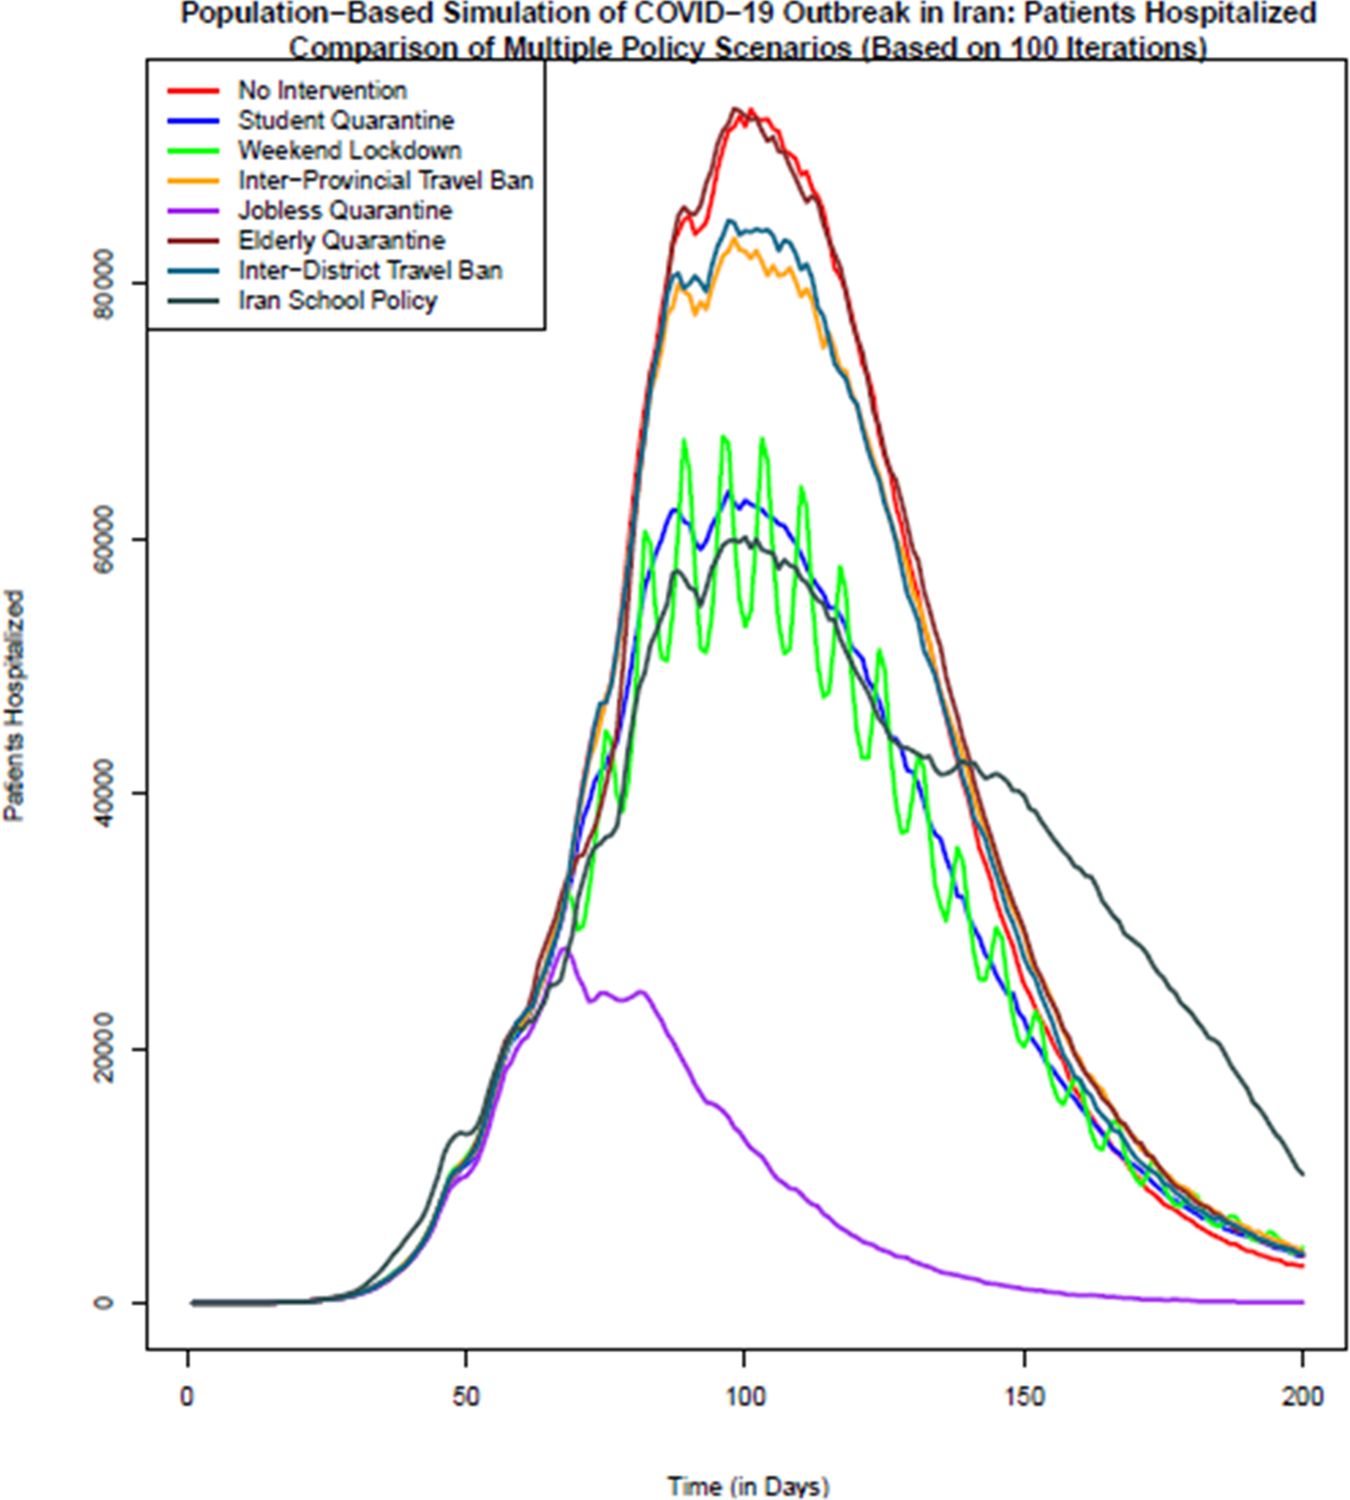
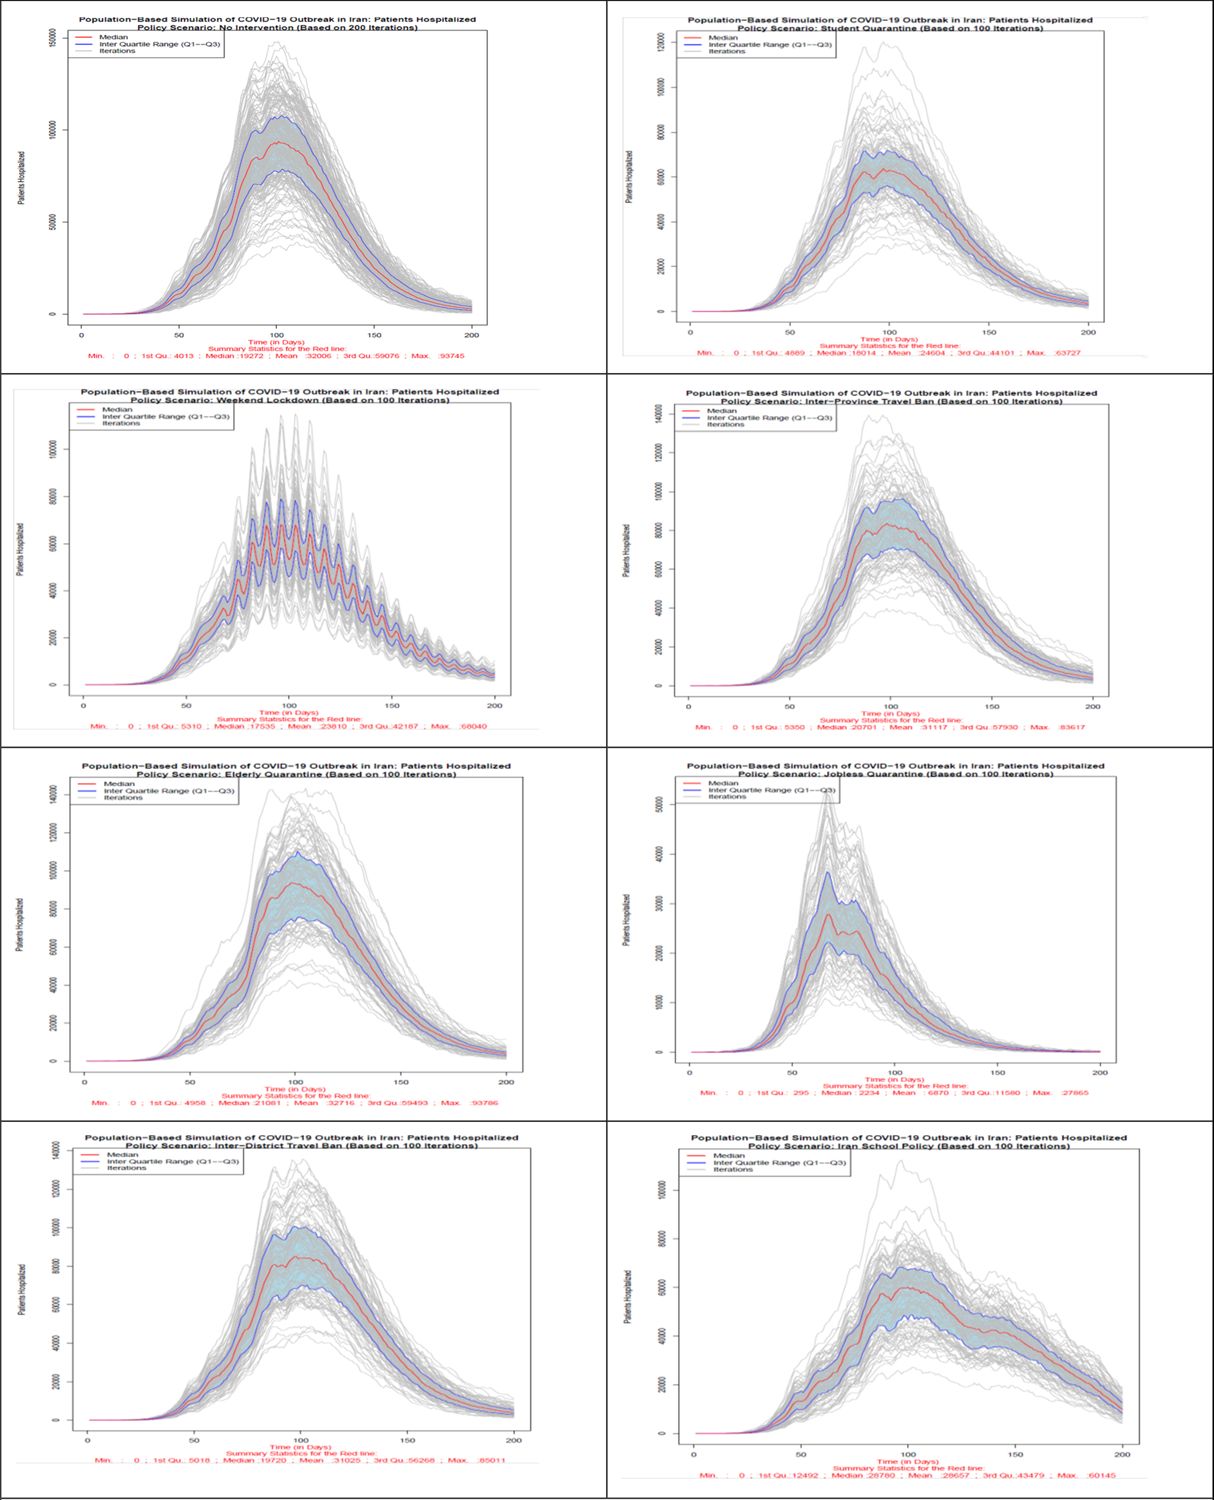
Comparison of the number of patients hospitalized in different policy scenarios: Population-based simulation based on 100 iterations. Source: The authors’ own calculations based on national census data of 2016 conducted by the Statistical Center of Iran.
Figure 4
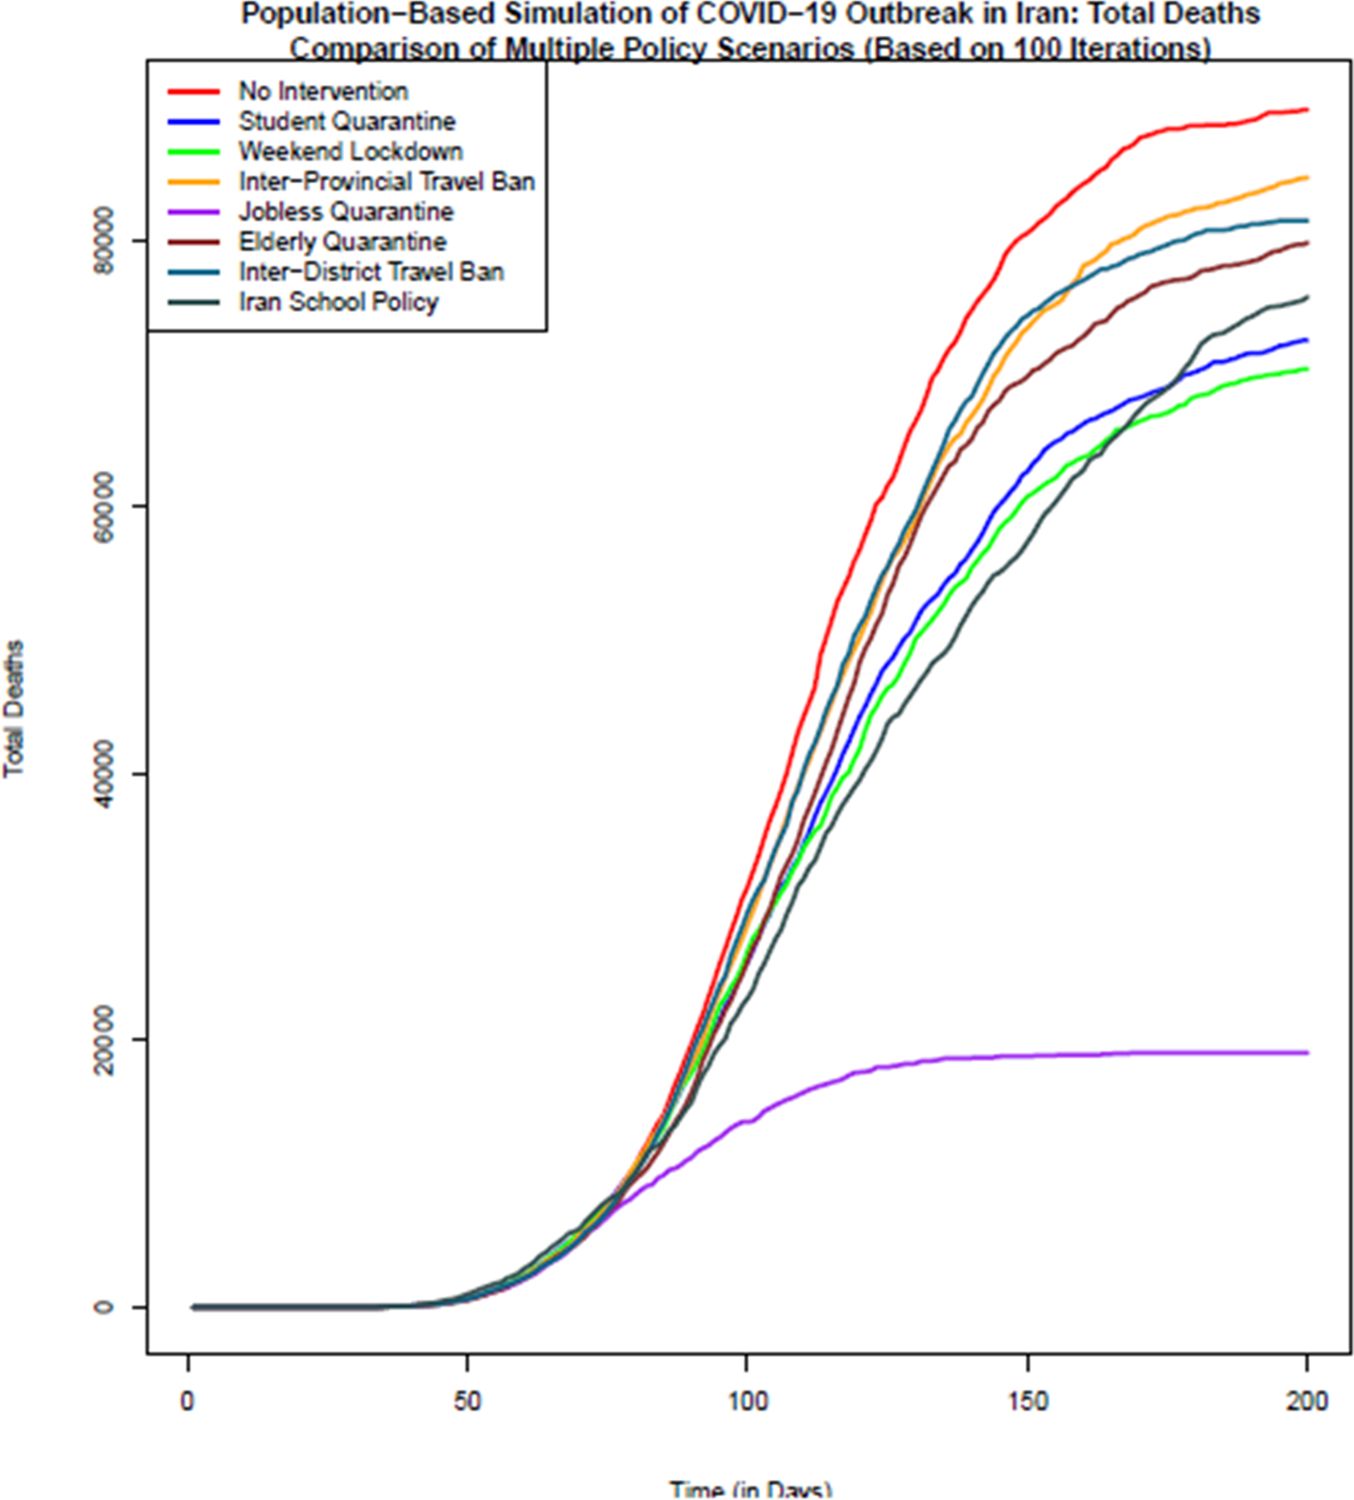
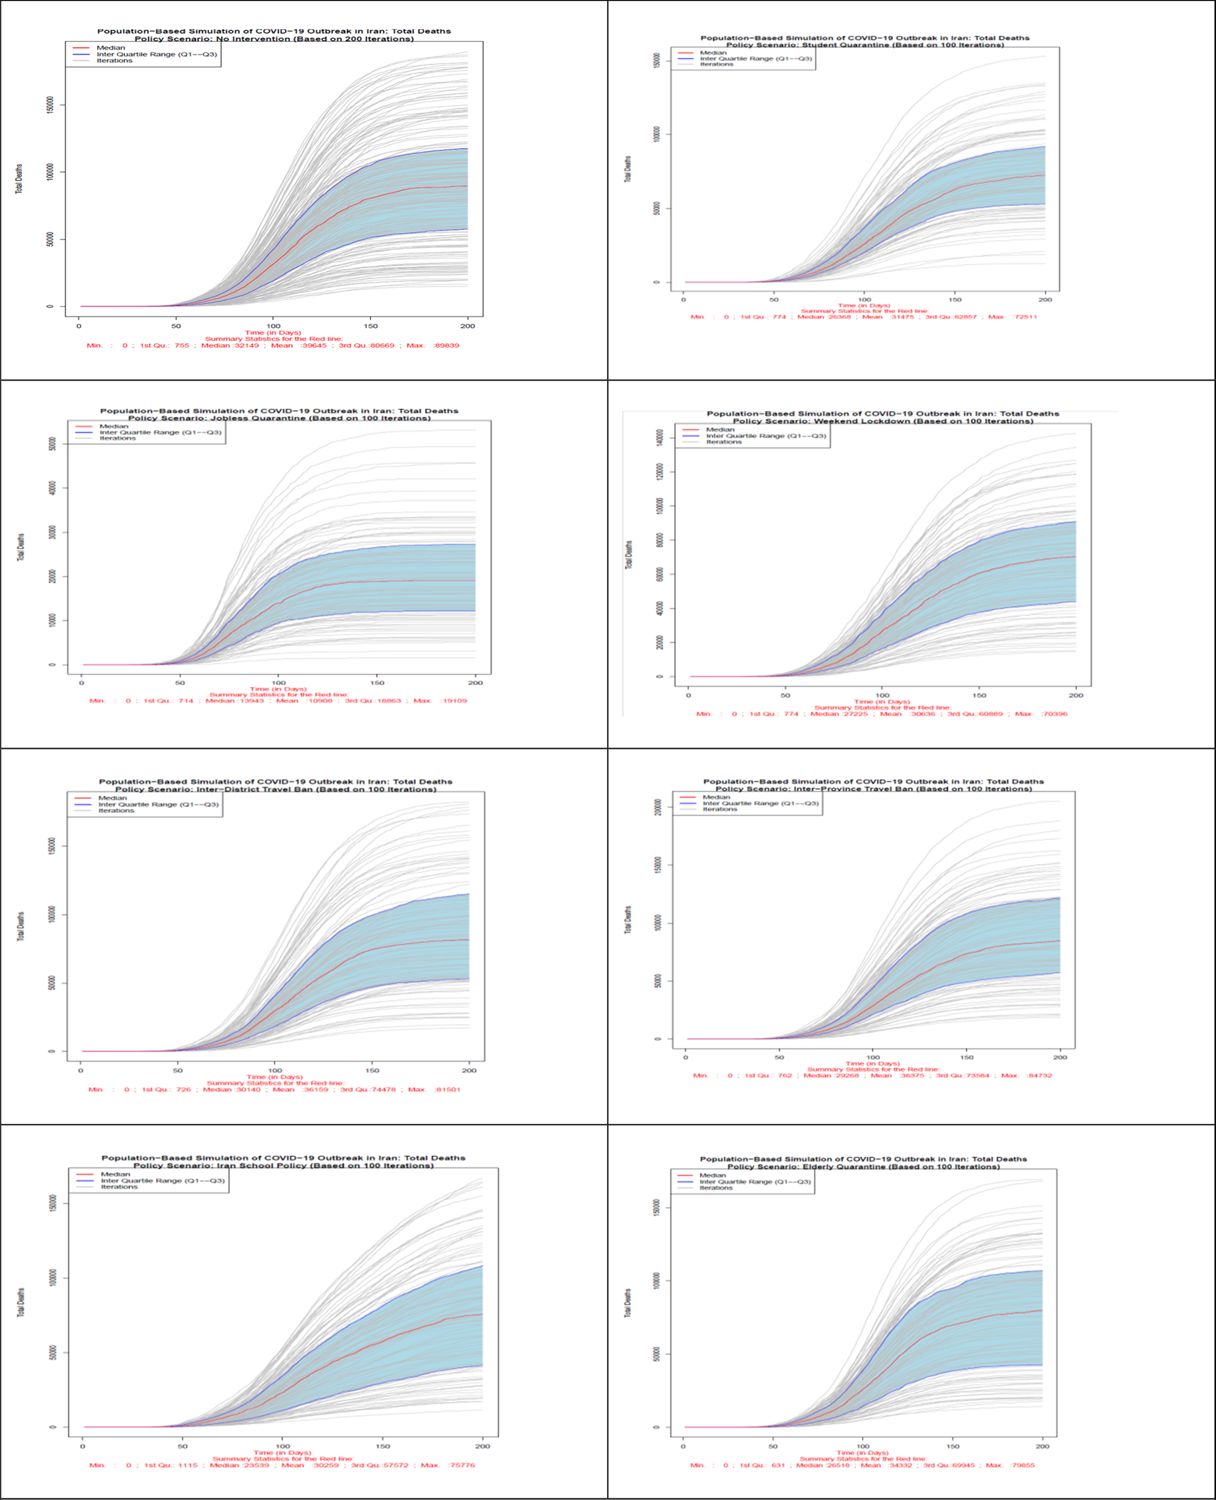
Comparison of the total number of death in different policy scenarios: Population-based simulation based on 100 iterations. Source: The authors’ own calculations based on national census data of 2016 conducted by the Statistical Center of Iran.
Figure 5
Number of population at risk in all 8 scenarios. Source: The authors’ own calculations based on national census data of 2016 conducted by the Statistical Center of Iran.
Figure 6
Number of hospitalized patients in all 8 scenarios. Source: The authors’ own calculations based on national census data of 2016 conducted by the Statistical Center of Iran.
Figure 7
Number of total death in all 8 scenarios. Source: The authors’ own calculations based on national census data of 2016 conducted by the Statistical Center of Iran.
Tables
Table 1
Modeling the COVID-19 outbreak in Iran: parameters, definitions, and values
| Model parameter | Definition | Value | References |
|---|---|---|---|
| Suscep | Susceptible population to disease at any time | 78,921,893 individuals1 Sample size:1,579,435 | SCI (2016b)SCI (2016b) |
| Expose | Exposed population to COVID-19 virus at any time | With a probability of 105 individuals per a million population in three districts of Qom (136 people), Tehran (917 people), and Rasht (100 people) on the first day | -- |
| Infect | Infected population by COVID-19 virus at any time | Based on mechanism of model (zero individual on day zero) | -- |
| Isolate | Isolated population after infection who were not hospitalized | zero individual on time zero (T0) | -- |
| Recover | Recovered population | zero individual on T0 | -- |
| Hospice | Hospitalized patients | zero individual on T0 | -- |
| Death | deceased population | zero individual on T0 | -- |
| hospice | discharged patients (at home or in a special residence that is under care and follow-up) | zero individual on T0 | -- |
| N | Total population | 78921893 individuals who are scattered throughout the country in 429 districtsSample size:1579435 | SCI (2016b) |
| C | Number of daily contacts of healthy individual per day | The mean number of daily contacts proposed by Iran’s Taskforce3 experts with a normal distribution and standard deviation of 2 (min 2 & max 50) is used to assign the daily effective contact numbers. To take into account population density of districts, number of contacts at each district is also set to have a positive correlation coefficient with district population density. The correlation is assumed to have a normal distribution with mean of 0.4 and standard deviation of 0.1 ranging from 0.15 to 0.55. | -- |
| B | Probability of transmission in case of encountering healthy individual with infected individual | Using the formula applied by the Epidemiology Committee of Iran’s Taskforce:B = (((Sin (2 × 3.14 × (Time +110) / 365)) + 1) ×((0.045 – 0.02) / 2)) +0.02 | Haghdoost et al., 2009&WanWan et al. (2020) et al., 2020 |
| SE | The number of individuals from the susceptive group who are added to the exposed group daily. | B×c(Infect/N)Infect/N at the district and household levels is calculated and the higher probability is used. | -- |
| EI | The number of individuals from exposed group who are added to infected group daily | All exposed people will become ill in D1 days. | -- |
| D1 | Duration of time until an exposed individual becomes infected | Randomly determined for each individual with normal distribution and with mean of 5.334 days and a standard deviation of 0.445 and a minimum of 2 and a maximum of 9 days. N~(5.33,0.445,2,9) | You et al., 2020 |
| IIS | The number of individuals who are isolated daily | Each infected individual may be isolated randomly with a normal distribution and with a mean probability IS.RATE, standard deviation of 0.05, minimum of 0, and maximum of 1. | -- |
| D7 | Duration of time until an infected individual becomes isolated | Randomly determined for each individual with a normal distribution, mean of 3 days, standard deviation of 0.5, and a minimum of 1 day.N~(3,0.5,1,-) | Expert Opinion |
| IS.RATE | rate of infected individuals who become isolated | Randomly determined for each iteration with a normal distribution and mean of 20%, a standard deviation of 5%, a minimum of 5%, and a maximum of 50%. N~(20,5,5,50) | -- |
| D8 | Duration of time until an isolated individual becomes recovered | Randomly determined for each person with normal distribution and mean of 7.91 days, standard deviation of 0.5, and a minimum of 3 days.N~(7.91,0.5,3,-) | You et alYou et al. (2020)., 2020 |
| IR | The number of infected individuals(without hospitalization and isolation) who recover daily | Each individual may be randomly recover daily with a probability calculated by subtracting sum of probabilities of isolation, hospitalization, and death of the individual from 1 | -- |
| IR.RATE | Rate of infected individuals(without hospitalization and isolation) who recover | Calculated by subtracting sum of probabilities of isolation, hospitalization, and death of the individual from 1 | -- |
| D9 | Duration of time until an infected individual(without hospitalization and isolation) recovers | Randomly determined for each individual with a normal distribution and an average of 10.91 days, standard deviation of 0.5, and a minimum of 6 days.N~(10.91,0.5,6) | -- |
| IH | Number of infected individuals who are hospitalized daily. | The daily number of hospitalized patients is, first, determined by multiplying the IH.Rate with the number of infected people. For each individual, then, the probability of hospitalization is estimated based on the age-sex distribution of hospitalized patients (See table 2). | -- |
| IH.Rate | Rate of infected individuals who are hospitalized daily. | Randomly determined for each iteration with a normal distribution and mean of 5%, a standard deviation of 1%, a minimum of 2%, and a maximum of 15%.N~(0.05,0.01,0.02,0.15) | -- |
| D2 | Duration of time until an infected individual becomes hospitalized | Randomly assigned for each individual with a normal distribution and an average of 2 days and a standard deviation of 0.5 and a minimum of 1 day. N~(2,0.5,1) | Expert Opinion |
| GENERAL | Number of hospitalized individuals who are admitted to general wards (non-ICU). | Hospit × 0.9 | -- |
| ICU | Number of hospitalized individuals who are admitted to ICUs | Hospit × 0.10 | -- |
| HT | Probability of hospital discharge | This probability for each individual is determined randomly with a normal distribution, an average of HT.Rate, standard deviation of 0.01 and a minimum of 0 and maximum 1 (100%).N~(HT.Rate,0.01,0,1) | -- |
| HT.Rate | Rate of hospital discharge | Randomly determined for each iteration with a normal distribution, mean of 90%, standard deviation of 1%, minimum of 80%, and maximum of 99%.N~(0.9,0.01,0.8,0.99) | National Data and Expert Opinion |
| D6 | Duration of time until hospital discharge | Randomly determined for each individual with a normal distribution and an average of 5 days, standard deviation of 0.5, and a minimum of 1 day. N~(5,0.5,1) | -- |
| HR | The number of individuals who recover daily after discharge | 1- TD.Rate | -- |
| D4 | Duration of time between discharge and recovery | Randomly determined for each individual with a normal distribution and an average of 7 days and a standard deviation of 0.5 and a minimum of 3 days.N~(7,0.5,3) | National Data and Expert Opinion |
| HD | The Number of individuals who die daily in hospital | The daily number of hospital deaths is, first, determined by multiplying the HD.Rate with the number of hospitalized patients. For each individual, then, the probability of death is estimated based on the age-sex distribution of deaths (See table 2). | -- |
| HD.Rate | Hospital deaths rate | 1- HT.Rate | -- |
| D5 | Duration of time between hospitalization and death | Randomly determined for each individual with a normal distribution and an average of 5 days, standard deviation of 0.5, and a minimum of 0.N~(5,0.5,0) | -- |
| ID | Number of infected individuals who die daily (without hospitalization) | The daily number of deaths is, first, determined by multiplying the ID.Rate with the number of infected patients. For each individual, then, the probability of death is estimated based on the age-sex distribution of deaths (See table 2). | -- |
| ID. Rate | Rate of death for infected individuals without hospitalization | Randomly determined for each iteration with a normal distribution and mean of 2 per thousand, a standard deviation of 5 in tens of thousands, a minimum of 1 per hundred thousand, and maximum 5 per thousand.N~(0.002,0.0005,0.00001,0.005) | -- |
| D10 | Duration of time until infected individual die without hospitalization. | Randomly determined for each individual with a normal distribution and an average of 11 days, standard deviation of 0.5, and a minimum of 4 days.N~(11,0.5,4) | justify with expert opinion&Haghdoost et al., 2009 |
| TD | Number of individuals who die daily after discharge from hospital | The daily number of deaths is, first, determined by multiplying the TD.Rate with the number of discharged patients. For each individual, then, the probability of death is estimated based on the age-sex distribution of deaths (See table 2). | -- |
| TD.Rate | Rate of death for individuals who die after discharge | Randomly for each iteration:N~(0.005,0.001,0.0001,0.01) | National Data and Expert Opinion |
| D11 | Duration of time until infected individual dies after discharge from hospital. | Randomly for each individual:N~(7,0.5,1) | -- |
| Population Movement | Population movement | 2016 Census inter-district migration Matrix: based on this matrix, individuals randomly change their place of residence (probability of daily movement of approximately 8% of the population) | -- |
| Urban/Rural | NA | the place of residence can be used in policy scenarios | -- |
| Population Density | Population density | Obtained by dividing the population of each district by its area and is used to determine the number of daily contacts | -- |
| Household | Household | Individuals in each district are nested in households. The household size shows the number of members and is used to calculate the probability of an infection at the household level | -- |
| District | District | The country's population lives in 429 districts. The probability of infection is calculated at the district level, as well | -- |
| Age & Sex | Age and sex | Individual characteristics of members of the society that are used to estimate the probabilities of hospitalization and death | -- |
| SES | NA | Indicates the level of welfare of the household. Can be used in policy scenarios. | -- |
| Occupation | NA | Indicates a person's occupational status. Can be used in policy scenarios | -- |
| Education | NA | Indicates a person's level of education. can be used in policy scenarios | -- |
Table 2
The proportion of hospitalized COVID-19 patients and deaths by age and sex at TUMS
| Age group | Hospitalization | Deaths | ||
|---|---|---|---|---|
| Female | Male | Female | Male | |
| 0 | 0.001192 | 0.001523 | 0 | 0 |
| 1-9 | 0.001937 | 0.002475 | 0 | 0 |
| 10-19 | 0.006754 | 0.008631 | 0.00356 | 0.00561 |
| 20-29 | 0.035259 | 0.045058 | 0.00356 | 0.00561 |
| 30-39 | 0.081592 | 0.104267 | 0.01305 | 0.02059 |
| 40-40 | 0.084373 | 0.107821 | 0.02551 | 0.04024 |
| 50-59 | 0.079954 | 0.102173 | 0.05577 | 0.08796 |
| 60-69 | 0.073249 | 0.093606 | 0.08958 | 0.1413 |
| 70-79 | 0.04539 | 0.058004 | 0.10857 | 0.17125 |
| 80-89 | 0.025973 | 0.03319 | 0.07594 | 0.11978 |
| 90 | 0.003327 | 0.004252 | 0.01246 | 0.01965 |
-
Calculated from epidemiological report of COVID-19 patients of the Tehran University of Medical Sciences Hospitals, April 2020.
Data and code availability
Please contact the authors for information on data and code availability.
Download links
A two-part list of links to download the article, or parts of the article, in various formats.