The LOTTE System of Tax Microsimulation Models
- Research Department, Statistics Norway, Norway
- Statistics Norway and Norwegian Fiscal Studies, the Department of Economics, Norway
Figures
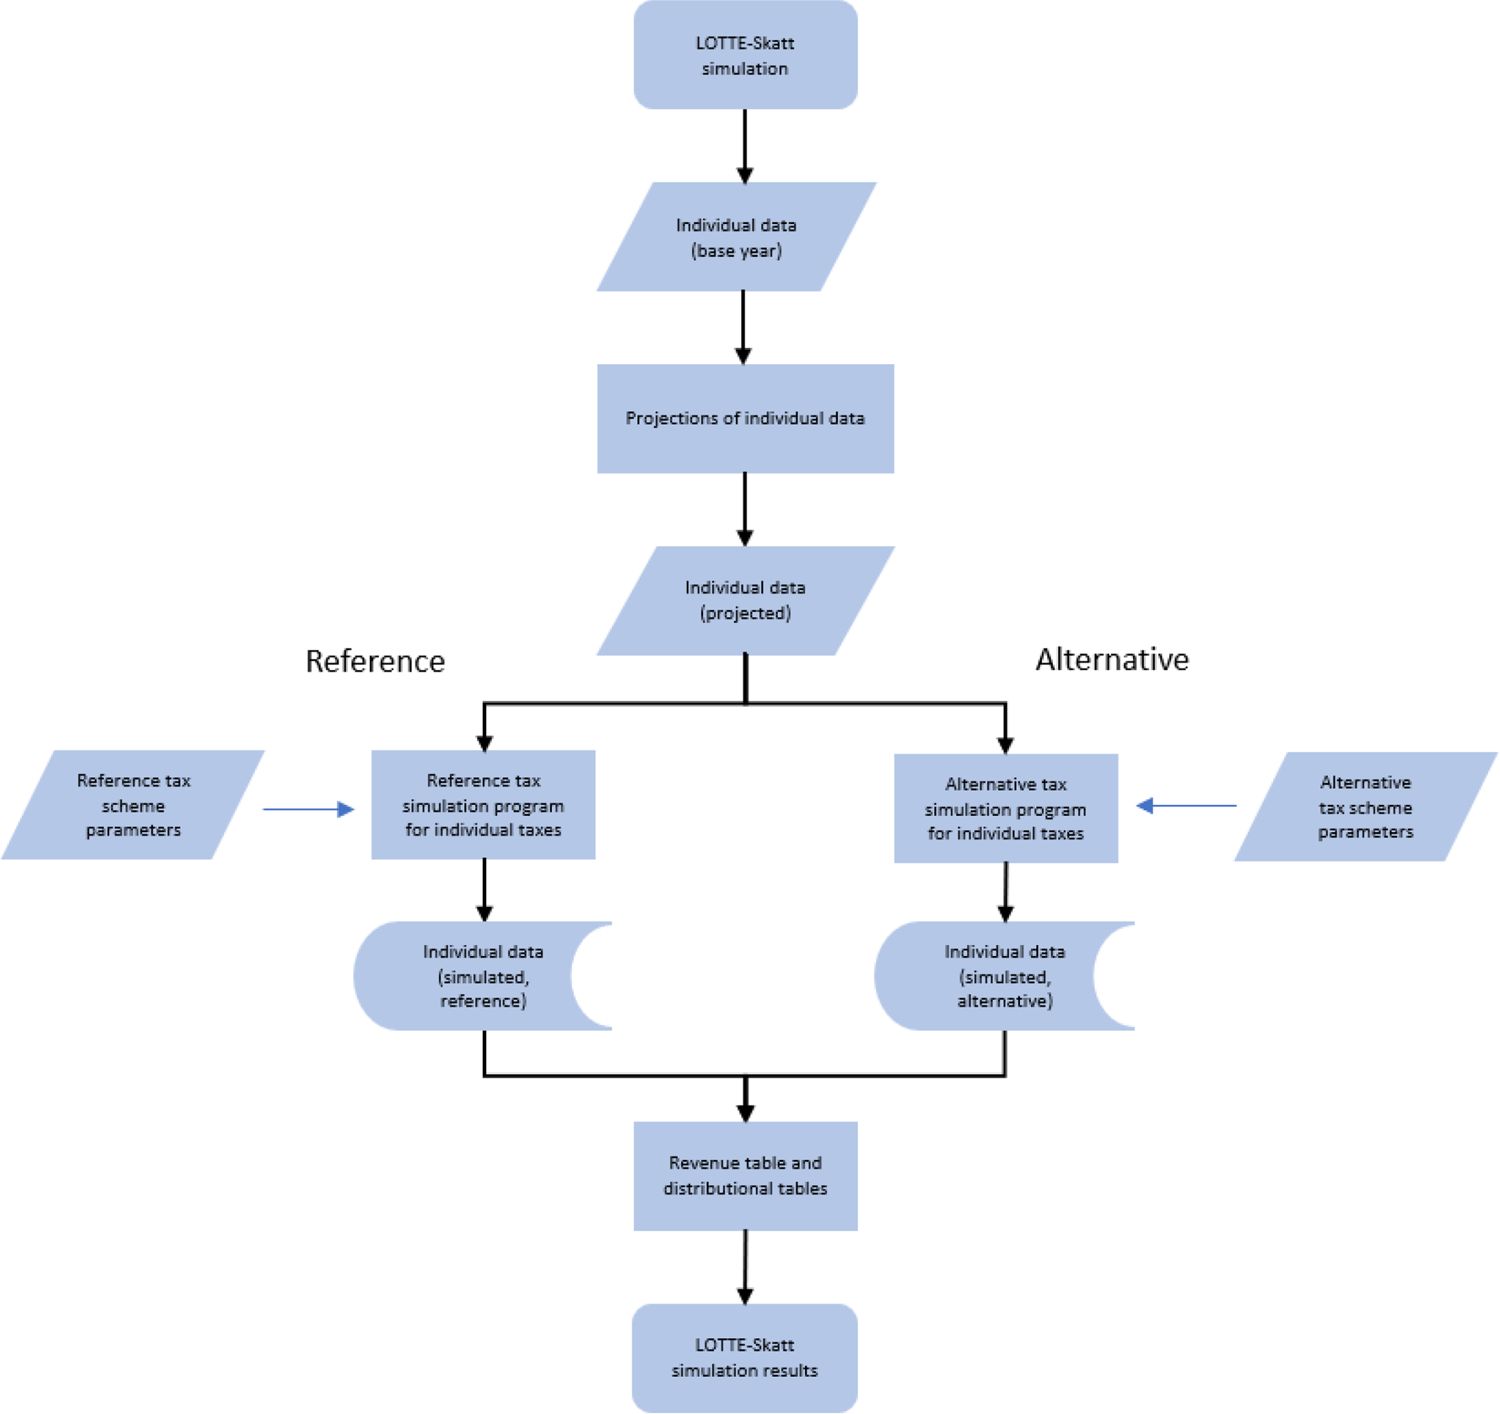
Overall structure of a LOTTE-Skatt tax-benefit model simulation

Simulated average increase in the tax burden across pre-tax income in deciles. 1 percentage point increase in tax on ordinary income in 2023. In thousands of NOK
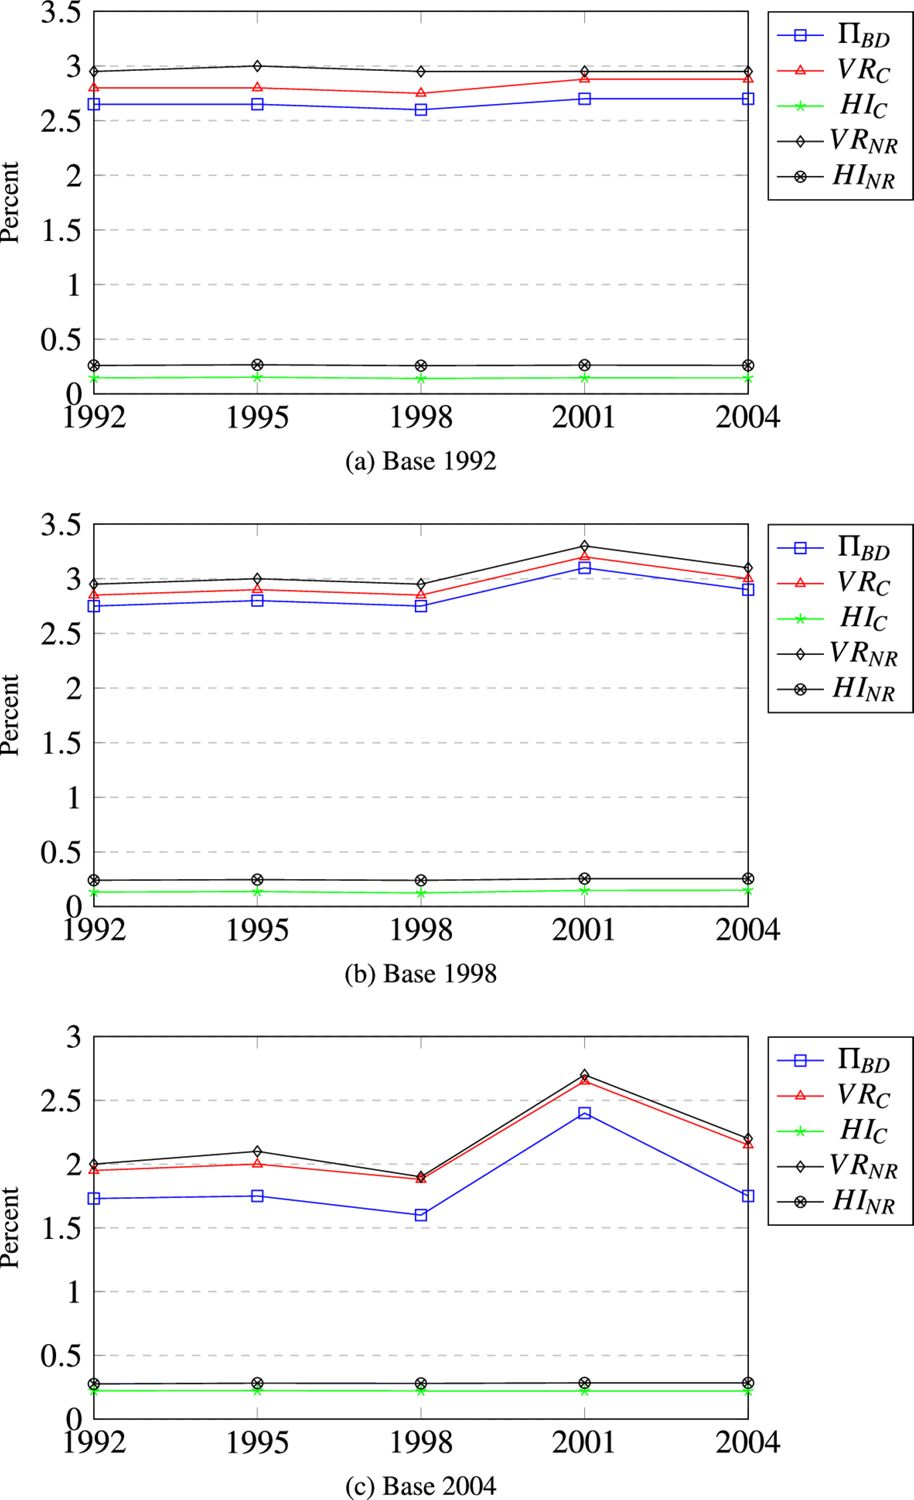
Estimates of tax redistributional effects 1992–2004, based on the fixed-income approach for income bases 1992, 1998, and 2004
Tables
Simulated revenue effects of a 1 percentage point increase in tax on ordinary income in 2023. In millions of NOK
| Alternative | Reference | Difference | |
|---|---|---|---|
| Income tax, municipal level | 237,079 | 220,840 | 16,238 |
| Income tax, state level | 136,401 | 136,401 | 0 |
| Social insurance tax | 178,102 | 178,102 | 0 |
| Bracket tax | 100,732 | 100,732 | 0 |
| Wealth tax, municipal level | 20,248 | 20,248 | 0 |
| Wealth tax, state level | 9,731 | 9,731 | 0 |
| - Tax red., housing savings scheme for young taxpayers | 580 | 580 | 0 |
| - Tax red., pensioners | 13,171 | 13,110 | 61 |
| - Tax red. in the north (North-Troms and Finnmark) | 1,133 | 1,119 | 14 |
| Total taxes | 667,409 | 651,246 | 16,163 |
| - Cash-for-care | 1,377 | 1,377 | 0 |
| - Child benefit | 22,171 | 22,171 | 0 |
| - Additional child benefit (small children, single parents) | 44 | 44 | 0 |
| Total | 643,817 | 627,654 | 16,163 |
-
Notes: Standard output revenue table from a LOTTE-Skatt simulation. Simulation alternative compared to a 2023 reference using 2020 data (10% sample) projected to 2023.
Simulated output from LOTTE-Skatt compared to output from the administrative registers based on income tax returns, 2021. In million NOK and percent
| LOTTE-Skatt | Tax reg. | Diff. in % | |
|---|---|---|---|
| Income tax, municipal level | 254,589 | 254,199 | 0.15 |
| Income tax, state level | 122,580 | 122,382 | 0.16 |
| Social insurance tax | 165,319 | 164,829 | 0.30 |
| Bracket tax | 81,829 | 81,772 | 0.07 |
| Wealth tax, municipal level | 14,989 | 14,911 | 0.52 |
| Wealth tax, state level | 3,212 | 3,199 | 0.40 |
| - Tax reduction, housing savings scheme for young taxpayers | 1,003 | 0,966 | 3.84 |
| - Tax reduction, pensioners | 14,213 | 14,229 | -0.11 |
| - Tax reduction in the north (North-Troms and Finnmark) | 1,069 | 1,068 | 0.10 |
| Total | 626,233 | 625,029 | 0.19 |
-
Notes: Both the simulated output from LOTTE-Skatt and the output from administrative tax registers are based on the population of all residents in 2021.
Simulated tax revenue effects of introducing a fifth tax bracket. Millions of NOK
| Total tax revenue | Diff. to benchmark | |
|---|---|---|
| Benchmark: 2023 tax rules without a 5th bracket | 578,134 | - |
| 2023 tax rules: | ||
| Direct (non-behavioral) effect | 578,402 | 268 |
| Intensive margin behavioral effect | -106 | |
| Extensive margin behavioral effect | -6 | |
| Direct and behavioral effects | 578,290 | 156 |
| Behavioral counteracting effect ratio | 0.42 |
-
Notes: Simulations generated by the Norwegian tax-benefit model LOTTE-Skatt, data for 2020 projected to 2023. Behavioral effects are taken into account with an ETI estimate of 0.2 at the intensive margin and 0.1 at the extensive margin. Source: Jia et al. (2023).
Simulated labor supply elasticities with respect to the wage rate for individuals, singles and in couples, 2014
| Female | Male | Female | Male | |
|---|---|---|---|---|
| Own wage | Own wage | Cross wage | Cross wage | |
| Individuals in couple | ||||
| Participation (ext. margin) | 0.135 | - | -0.048 | - |
| Hours cond. on working (int. margin) | 0.197 | 0.095 | -0.043 | -0.009 |
| Total elasticity | 0.332 | 0.095 | -0.091 | -0.009 |
| Single individuals | ||||
| Participation (ext. margin) | 0.012 | - | ||
| Hours cond. on working (int. margin) | 0.057 | 0.009 | ||
| Total elasticity | 0.069 | 0.009 |
-
Notes: The elasticities reflect the simulated percentage change (average across individuals) in the probability of participation (extensive margin) and working hours conditional on working (intensive margin) when the hourly wage rate is increased by one percent for all wage earners. Note that due to high male participation rates, we do not estimate extensive margin responses for males.
Estimates of self-financing ratios for a number of changes in rates, thresholds, allowances, and deductions, 2023. Percent
| Tax change | Self-financing ratio, pct |
|---|---|
| Reduced rate bracket tax, bracket 3 | 10 |
| Increased threshold bracket tax, bracket 3 | 9 |
| Reduced rate ordinary income | 6 |
| Reduced rate social insurance tax | 5 |
| Reduced rate bracket tax, bracket 2 | 4 |
| Increased threshold bracket tax, bracket 2 | 2 |
| Increased threshold for maximum deduction in minimum standard deduction | 1 |
| Reduced rate bracket tax, bracket 1 | 0 |
| Increased threshold bracket tax, bracket 1 | 0 |
| Increased personal allowance | 0 |
| Increased rate minimum standard deduction | -16 |
-
Notes: For a tax decrease, the self-financing ratio is the ratio between the effect on revenue due to labor supply adjustments and the initial static (or mechanical) revenue effect estimate (standard tax-benefit model calculation). Source: Finansdepartementet (2023).
Average weekly hours of work, pre- and post-reform, derived from a simulation employing a labor supply model. Standard errors in parentheses
| Pre-reform working hours | Post-reform working hours | Difference, % | |
| Single females | 35.20 (0.321) | 35.27 (0.322) | 0.18 |
| Single males | 38.95 (0.039) | 38.97 (0.040) | 0.04 |
| Females in couple | 32.13 (0.068) | 32.25 (0.068) | 0.36 |
| Males in couple | 38.60 (0.013) | 38.64 (0.014) | 0.11 |
-
Notes: Standard errors are obtained by non-parametric bootstrapping, 30 repetitions. Source: Thoresen and Vattø (2015).
Comparison of net-of-tax rate elasticity estimates obtained from labor supply model simulations and the ETI approach for working hours and earned income. Standard errors in parentheses
| Discrete choice labor supply simulations, working hours | Panel data information | ||
|---|---|---|---|
| Working hours | Earned income | ||
| Single females | 0.018 (0.0005) | 0.032 (0.0037) | 0.020 (0.0051) |
| Single males | 0.062 (0.0027) | 0.023 (0.0055) | 0.039 (0.0054) |
| Females in couple | 0.026 (0.0001) | 0.051 (0.0046) | 0.031 (0.0045) |
| Males in couple | 0.015 (0.0005) | 0.016 (0.0059) | 0.053 (0.0034) |
| Weighted average | 0.026 (0.0012) | 0.028 (0.0053) | 0.041 (0.0043) |
-
Notes: The weighted averages are calculated by accounting for the number of observations in each group. Standard errors are obtained by using the delta method. Source: Thoresen and Vattø (2015).
Consumption expenditure of different household types, five commodities (NOK in 2023)
| Household type | Food | Wine | Electricity | Clothes | Air travel |
|---|---|---|---|---|---|
| Singles | 31,436 | 3,515 | 15,665 | 12,798 | 3,439 |
| Couples | 57,335 | 7,771 | 24,551 | 34,294 | 9,564 |
| Couples with one child | 66,942 | 7,478 | 26,881 | 41,835 | 9,862 |
| Couples with two children | 78,713 | 7,671 | 30,003 | 50,763 | 10,084 |
| Couples, more than two children | 90,425 | 6,475 | 32,213 | 55,961 | 10,084 |
| Others | 66,045 | 6,755 | 26,101 | 36,970 | 8,966 |
| All households | 51,617 | 5,736 | 21,986 | 28,465 | 7,035 |
-
Notes: Average household expenditure for different household types and consumer goods in 2023, obtained by the model LOTTE-Konsum. Children defined as individuals less than 18 years of age.
Distribution of tax burden increase for five goods, tax burden increased by NOK 100 on average on each good
| Decile | Food | Wine | Electricity | Clothes | Air travel |
|---|---|---|---|---|---|
| 1 | 68 | 7 | 64 | 31 | 9 |
| 2 | 79 | 31 | 73 | 56 | 34 |
| 3 | 85 | 49 | 81 | 67 | 51 |
| 4 | 90 | 62 | 86 | 75 | 64 |
| 5 | 94 | 75 | 91 | 84 | 76 |
| 6 | 99 | 89 | 97 | 93 | 90 |
| 7 | 105 | 107 | 105 | 104 | 107 |
| 8 | 112 | 130 | 114 | 119 | 128 |
| 9 | 121 | 163 | 127 | 141 | 159 |
| 10 | 148 | 287 | 163 | 231 | 281 |
| All | 100 | 100 | 100 | 100 | 100 |
-
Notes: All individuals are ranked according to total household expenditure divided by the number of household members in 2023. Change in tax burden is measured as change in real expenditure per household member due to a price increase on a specific good, where real expenditure is defined as total household expenditure divided by a household-specific price index. We change the tax burden for each good by NOK 100 on average by the use of the model LOTTE-Konsum.
Summary of revenue-offsetting effects, tax cuts brought about by the Norwegian tax reform of 2006
| Labor supply responses | MPC | Personal income tax, labor supply | Direct effect, commodity tax | Commodity tax, labor supply | Payroll tax, labor supply | Overall offsetting effect |
|---|---|---|---|---|---|---|
| 0.5 | 0.27 | 0.09 | 0.04 | 0.09 | 0.48 | |
| Low response | 0.7 | 0.27 | 0.12 | 0.05 | 0.09 | 0.53 |
| 0.9 | 0.27 | 0.15 | 0.06 | 0.09 | 0.58 | |
| 0.5 | 0.34 | 0.09 | 0.05 | 0.12 | 0.59 | |
| Benchmark: | 0.7 | 0.34 | 0.12 | 0.06 | 0.12 | 0.64 |
| middle response | 0.9 | 0.34 | 0.15 | 0.08 | 0.12 | 0.70 |
| 0.5 | 0.39 | 0.09 | 0.05 | 0.13 | 0.65 | |
| High response | 0.7 | 0.39 | 0.12 | 0.07 | 0.13 | 0.70 |
| 0.9 | 0.39 | 0.15 | 0.09 | 0.13 | 0.76 |
-
Notes: Results are shown for three assumptions about labor supply effects (low, middle, and high) and for three assumptions about the marginal propensity to consume, MPC (0.5, 0.7, and 0.9). The overall offsetting revenue effect reflects contributions from labor supply alone, increased commodity taxation attributable to increased disposable income, and increased commodity and payroll tax due to labor supply adjustments. Source: Thoresen et al. (2010).
Data and code availability
The data referred to in this article are managed by Statistics Norway under the Norwegian Statistics Act. Transfer of personal data outside the country's borders is not allowed according to the Statistics Act. This means that any researcher or institution that wishes to apply for microdata will only be granted access to completely anonymous data. Due to the difficulty of anonymising data in such a small country as Norway, this will rarely be feasible. An alternative is to gain access to data through a Norwegian research institution. This requires that the participating members are pre-submitted to Statistics Norway and that the formal requirements are fulfilled.
We are currently recoding the model, also with the ambition to make the source code open.