The Effect of Earnings-Related Benefits on Financial Work Incentives
- Economic and Social Research Institute, Ireland
- Trinity College Dublin, Ireland
- Institute for Fiscal Studies, United Kingdom
Abstract
In most European Union countries, there is a link between the level of payment provided to those who have lost their job and the level of earnings in that job, at least for an initial period. While this provides valuable insurance to those who lose their job, a stronger link between unemployment benefits and previous earnings can exacerbate the moral hazard created by unemployment insurance. We examine strengthening this link for unemployment benefits in Ireland using SWITCH – a tax and welfare microsimulation model for Ireland – to simulate the financial work incentive impact of a proposed reform to current unemployment benefit policy. We find that implementing an earnings-related unemployment’s benefit leads to reduced short-term incentives to work for all those currently in employment, with the impact being greater for full-time employees.
1. Introduction
In most European Union (EU) countries, there is a link between the level of payment provided to those who have lost their job and the level of earnings in that job, at least for an initial period.1 Such a link has been shown to support individuals in smoothing shocks to their consumption from periods of unemployment,2 but can also (partially) crowd-out self-insurance.3 In addition, a stronger link between unemployment benefits and previous earnings can exacerbate the moral hazard created by unemployment insurance, by weakening the incentive to find or take up a new job.4
As a result, policy analysts and makers need to carefully consider the impact strengthening this link might have on financial work incentives. This paper examines this issue in the context of Ireland, one of the few EU countries not to currently operate a system of earnings related benefits but who has recently proposed introducing one for unemployment insurance.5, 6 We use data from the Survey of Incomes and Living Conditions (SILC) run on SWITCH – the tax and benefit microsimulation model of the Economic and Social Research Institute based on EUROMOD, detailed in Keane et al. (2023) – to estimate ex-ante how introducing a link between previous earnings and jobseekers’ benefit would impact the financial incentive to be in paid work.
We find that measures of net replacement rates – an individual’s out-of-work income as a percentage of their in-work income – increase by about 11 percentage points when the rate of the unemployment benefit is linked to previous earnings, while measures of participation tax rates – the proportion of earnings that are taken away in tax or lower benefit entitlements when an individual starts work – increase by about 27 percentage points. Full-time employees are estimated to see larger increases in these measures than part-time employees.
A key contribution of our paper is to show how microsimulation models can be used to inform policy proposals and debates around changes to social insurance benefits. In this respect, our paper contributes to a small existing literature examining ex ante effects of welfare reforms on financial work incentives, most notably Brewer et al. (2012) who examine the potential impact of the Universal Credit reform in Britain both on incomes and work incentives and Christl et al. (2017) who similarly examine a Austrian tax reform. We also contribute to a much larger literature exploring the ex-ante effects of welfare reforms on poverty and inequality (e.g. de Mahieu, 2021; Goderis and Vlekkev, 2023; Widerquist and Arndt, 2023). While our setting is Ireland, our findings and approach are of interest not only to policy analysts and makers in Ireland but also other countries like Greece which are also considering strengthening the link between benefits and previous earnings (Pissarides et al., 2023).
The remainder of this paper proceeds as follows. Section 2 outlines the Irish policy context. Section 3 describes our data and methodology while Section 4 presents our main results. Section 5 concludes.
2. Policy context
The Irish social welfare system, based largely on that inherited from Britain after independence, developed in an uneven, fragmented manner. The Department of Social Welfare was established in 1947, taking charge of a disparate system which covered unemployment and national health insurance (which was relatively unchanged from that introduced by Lloyd George’s system of national insurance in 1911), old-age pensions, children’s allowances, and ‘home assistance’ (which had its origins in the locally operated Poor Laws).7
Under the 1952 Social Welfare Act, unemployment and national health insurance were consolidated and expanded to male employees working in agriculture and private domestic service. The sickness and disablement benefits that constituted part of national health insurance were replaced with a new disability benefit. Contribution conditions were amended, breaking the link between the number of contributions paid and duration of benefit entitlement.
The 1973 Social Welfare (Pay-Related Benefit) Act introduced for the first time an earnings-related component to unemployment and disability benefit. Existing flat-rate payments were supplemented with an earnings-related component largely funded through additional earnings-related contributions above a certain level of earnings.
The move towards earnings-related contributions was cemented with the introduction of pay-related social insurance (PRSI) in 1979. The flat-rate contribution and the three per cent pay-related contribution were replaced by a system based entirely on earnings-related contributions. The new system was more progressive in its nature, with the percentage rate meaning that contributions would now automatically increase when the average level of earnings rose, which had not previously been the case with flat-rate payments. Standard rates for different ‘classes’ of workers were introduced and the previously existing differentials between men and women and between agricultural workers and other workers both eliminated. PRSI was partially extended to the self-employed in 1988, and to civil servants, members of An Garda Síochána, registered doctors and dentists in 1995.
Following a recommendation of the Commission on Social Welfare (1986), earnings-related benefits for unemployment, disability and maternity were phased out over the late 1980s and 1990s. While agreeing there was a case for such earnings-related benefits to ‘offer a short-term cushion to recipients to allow an adjustment to a lower level of income’, the Commission argued that this was better provided through an enhanced system of (means-tested) social assistance payments available to all, regardless of previous employment history.
Today, most newly unemployed individuals in Ireland are entitled to a payment called Jobseeker’s Benefit (JB), conditional on meeting criteria related to previous PRSI contributions. The weekly main rate in 2022 is €208, increased if the unemployed claimant has adult or child dependants. If the claimant was earning less than €300 per week when in work, a reduced rate of benefit is payable. The reduced rates range from €93.30 to €162.90 per week, depending on the claimant’s previous earnings.8 In 2019, 35,000 individuals received the JB with the annual spending amounting to €350 million.9
Those who do not qualify for or have exhausted their entitlement to JB can instead claim Jobseeker’s Allowance (JA). This is a means-tested benefit with a two-tier flat rate payment, one for individuals above 25 years old (€208 per week) and one for those 18 to 24 years old (€117.70 per week), which can be increased in case of dependants.10 The annual spending for the JA in 2019 was €1.6 billion for 124,000 recipients.11
European Commission (2002) shows that whereas most EU countries provide significant income replacement during the first months of unemployment (e.g. ranging from 55 per cent in Austria to 90 per cent in Denmark, with most countries having around 60 per cent), Ireland does not do so.12 In this sense, the structure of payments in Ireland remains closer to that of Britain than the continental European model, with a greater role for social assistance payments like JA than unemployment insurance payments like JB.
3. Methodological approach. Measuring financial work incentives
3.1. Methodology and data
We use SWITCH – the Economic and Social Research Institute tax and benefit microsimulation model for Ireland, described comprehensively in Keane et al. (2023) – to assess how each hypothetical reform scenario would affect estimates of financial work incentives faced by households. SWITCH allows us to calculate households’ social welfare entitlements, tax liabilities and net incomes, both in terms of their actual circumstances as well as a set of hypothetical scenarios, with different employment statuses captured in the differences between our hypothetical scenarios and the baseline policy environment. Although SWITCH uses the EUROMOD platform and data from the Survey on Income and Living Conditions (SILC), this is supplemented with linked administrative data and reweighted to better represent the income distribution and welfare receipt of the reference year population (Keane et al. 2023). One main difference with EUROMOD, is that SWITCH has information on current income.13
We run SWITCH (v4.6) on data from the 2019 SILC, uprating monetary variables to 2022 levels using outturn and forecast earnings, output and price growth. The 2019 SILC wave includes information for 4,183 households and 10,698 individuals in Ireland.14 The scale, depth and diversity of this survey allows it to provide an overall picture of the impact of the policy changes on Irish households (see Appendix A).
Our main sample of interest for this analysis in terms of financial work incentives are individuals who are currently in paid work.15 We focus on this groups as concerns about moral hazards are more acute for those in (low-paid) work than those not currently in paid work. Additionally, the data on previous earnings for those not currently in paid work are an estimate based on their age, educational attainment, gender and disability status (Sutherland and Figari, 2013), while SWITCH currently does not have the capacity to model financial work incentives for this group. However, we do use this information to estimate the cost of our reform (assuming no behavioural response) and its impact on poverty and inequality.
We take as our baseline policy environment the tax and benefit system in place at the beginning of 2022, which includes current Jobseeker’s Benefit (JB) policy. We ignore the temporary COVID-19 related measures such as the Pandemic Unemployment Payment (PUP) and the Employment Wage Subsidy Scheme. We calculate a range of financial work incentive measures for this baseline system and compare them to those from two other systems, with both containing a reformed JB policy. In this analysis, financial work incentives act as a measure of welfare maintenance during the transition from employment to unemployment.
3.2. The financial incentive to be in paid work
There are two main measures of the incentive to be in paid work typically used in the literature (e.g. Adam et al., 2011; Callan et al. 2016; Jara et al. 2020). The net replacement rate (NRR) gives an individual’s out-of-work income as a percentage of their in-work income, and is defined as:
For example, an individual whose net weekly out-of-work income was €200 and whose net in-work income was €450 would have an NRR of 44 per cent.
The participation tax rate (PTR) gives the proportion of earnings that are taken away in tax or lower benefit entitlements when an individual starts work, that is:
For our example individual with weekly gross earnings of €568, this gives a PTR of 56 per cent.
For both the NRR and the PTR, lower numbers indicate stronger financial incentives to work and higher numbers indicate weaker financial incentives to work.16
Net income means that at the household level after benefits have been added and taxes deducted. We examine the impact of each reform on financial work incentives by calculating the measures under current versus the reformed policy for those currently in paid work only. As outlined above, this involves computing their net income when in paid work (their current observed state) as well as in the counterfactual where they are not in paid work and have gross earnings set to zero. In all cases, partners’ behaviour is held constant when calculating an individual’s financial work incentive so as to capture the work incentive for an individual of being in paid work (rather than both members of a couple).
Both these measures attempt to capture the incentive to work or not, but they are conceptually different. Broadly speaking, the NRR measures the absolute strength of financial incentives to work whereas the PTR measures the effect of the tax and benefit system on work incentives.
To better understand this, consider: a) an equal cash gain in each of in-work and out-of-work incomes; and b) an increase in the hourly wage. An increase in income of a constant euro amount at all hours (including zero) does not change the PTR but increases the NRR – that is, the PTR would suggest no change in incentives, but the NRR would suggest that they have grown weaker. At a given level of hours of work, an increase in the gross hourly wage will strengthen work incentives according to the NRR but will have ambiguous effects according to the PTR.
From the above example, it is clear that the NRR measure of financial work incentives captures the effect not only of the tax and welfare system but also earnings power. By contrast, the PTR is driven largely by how the tax and benefit system, rather than potential wages, affects the financial incentive to work. In other words, while the NRR can conflate the incentives created by taxes, welfare payments and earnings power, the PTR distinguishes – to a greater extent – between whether a reduced reward to work is caused by higher taxes and benefits or lower wages. Both are of interest, and because of this difference in what the two measures are describing, the empirical analysis that follows will use both.
4. Results
4.1. Scenarios
In this section, we assess potential reforms that would strengthen the link between the current system of Jobseeker’s Benefit (JB) and earnings.
Each of our potential reforms has an earnings-related component, linking benefit entitlement to a recipient’s previous earnings. This contrasts with the predominantly flat rate payments made under the current system. We identify which households would benefit most from strengthening this connection between earnings and JB payments and the fiscal cost this would entail. We consider four reform scenarios in total, though we only present a detailed discussion for the most relevant one – results relating to the others can be found in Appendix B.
The impact of the reforms is best illustrated through changes in the replacement rate (NRR): individuals’ net income when out of work as a share of that when in paid work. This gives an indication of both how well an individual would be able to maintain their consumption were they to suffer an unemployment shock, as well as the overall strength of their financial incentive to work. We also present estimates of participation tax rates, another key measure of financial work incentives. Additionally, we present how these changes affect households of different rank in the income distribution.
We investigate the impact of introducing set rates of previous earnings for the benefit’s main rate, linking to previous earnings, and of imposing a maximum cap on the weekly benefit payment, on NRRs, PTRs and additional spending.17 A 60 per cent rate of previous earnings is adopted, based on the comparative analysis of what applies to other EU countries (European Commission, 2002). For the payment caps, we explore the impact of three different options:
being equal to the PUP rates (see Table A1 for more information about the rates);
imposing the same rule that Government legislated for the new sick pay, namely the cap being based on the mean daily earnings (€110);18 and
setting a goal for the additional spending on the benefit (at €400 million), satisfied through the maximum caps imposed, set at 43 per cent of average daily earnings.
Additionally, we employ a scenario in which the maximum cap is set equal to the PUP rates, but the rate of previous earnings is set to 70 per cent. Under all of our assumptions we do not make any change in the duration of the benefit, as we want to measure the net impact of moving from a flat rate benefit to one that is linked with previous earnings.
Under the existing framework, a person must be unemployed 4 out of 7 days in order to qualify for JB, with 70% of current recipients in SWITCH being fully unemployed. The current proposal for linking JB with previous earnings proposes for part-time workers to either continue under the existing regime or moving to a new proposed working age payment model (Department of Social Protection, 2022). For the purpose of our analysis though, we present results for part-time employees as well.
Table B1 gives details for each of the scenarios examined. Linking the main rate of the JB to previous earnings seems to have a similar effect on the NRRs and PTRs in the scenarios examined. Introducing different caps on the payment seems to change the pattern between the scenarios examined as, in effect, a different spending limit is imposed in each case.
Under the main Reform Scenario (or Scenario 1), we keep the rate of previous earnings at 60 per cent and impose a maximum cap based on PUP rates. In Appendix B, we present the analysis for all four scenarios.
4.2. Results from hypothetical reforms
4.2.1. Income inequality, poverty and additional fiscal cost
Firstly, we examine the cost and impact of the reform on measures of income inequality and poverty. Table 1 shows how income inequality and poverty vary in the baseline and reform scenarios, assuming no adjustments in labour supply or other behavioural responses to the JB reform. Income inequality remains almost constant. Nonetheless, income poverty experiences a small decrease in the reform scenario, decreasing by 0.06 pp for the whole population, with the decrease being greater for children and the working age adults (0.09 pp and 0.07 pp decrease respectively).
Income inequality, poverty and additional spending required.
| Baseline | Reform Scenario | Difference | |
|---|---|---|---|
| Gini | 0.2782 | 0.2773 | -0.001 pp |
| Poverty – Whole population | 13.63% | 13.57% | -0.06 pp |
| Poverty – Working age adult population | 13.31% | 13.24% | -0.07 pp |
| Elderly poverty* | 12.20% | 12.18% | -0.02 pp |
| Children poverty | 15.77% | 15.68% | -0.09 pp |
| Fiscal cost | €348 million | €626 million | €278 milion |
-
Note: Authors calculations using the SWITCH v4.6 tax-benefit system for 2019 linked to SILC 2019. Assessment units are defined as being at risk of poverty (poor) if their equivalised disposable income is below the poverty line. The poverty line is defined as 60% of the median equivalised disposable income of the baseline scenario. The CSO equivalence scale is used, which attributes a weight of 1 to the head of the unit, a weight of 0.66 to every person above the age of 13 and a weight of 0.33 to every child aged 0-13. Table B5 in the Appendix provides the income inequality and poverty rates for each of the 4 scenarios.
-
*
Changes in the elderly poverty rate are due to a small number of observations and thus should be read with caution.
The limited impact of the reform on these statistics may be explained by the small number of individuals in receipt of a JB payment.19 In periods of a recession, with increased unemployment, the impact of the reform is likely to be greater. The additional spending for such reform is estimated at €278 million per annum.
4.2.2. Replacement Rate and Participation Tax Rate changes
This section presents our results relating to measures of financial work incentives under the baseline and reform scenario. These measures show both the increased protection against unemployment the reforms may provide, as well as perverse work incentive effects associated with their implementation. Throughout the analysis in this part, our sample consists of those who are currently in paid work.
Table 2 shows that median RRs and PTRs will rise substantially under the reform, from 67% to 77% and from 45% to 64% respectively. The Table also shows that the share of individuals with NRR and PTR greater than 70 per cent – capturing the percentage of the population that has low incentive to work – will also rise, from 43% to 78% and from 1% to 28% respectively.20
Work incentives.
| Scenario | Reform | Median NRR (%) | Share with NRR > 70% (%) | Median PTR (%) | Share with PTR > 70% (%) |
|---|---|---|---|---|---|
| Baseline | Baseline | 67 | 43 | 45 | 1 |
| 1 | Reform scenario | 78 | 71 | 64 | 28 |
-
Source: Authors’ estimates using the SWITCH model and data from the 2019 SILC. Results for the 4 scenarios can be found in Table B4 at the Appendix.
Callan et al. (2016) examine NRRs and PTRs in Ireland and the UK using microsimulation models, for the 2015 tax and benefit systems. The median NRRs they find are lower (50 per cent for Ireland and 53 per cent for the UK), but the median PTRs are similar with our baseline (36 per cent and 52 per cent for Ireland and the UK respectively). Jara et al. (2020) use EUROMOD to estimate PTRs for the EU countries, using the 2017 tax and benefit systems. The (short-term) median PTRs they find range from 30 per cent (Malta) to 88 per cent (Luxembourg), with their estimate for Ireland similar to ours.
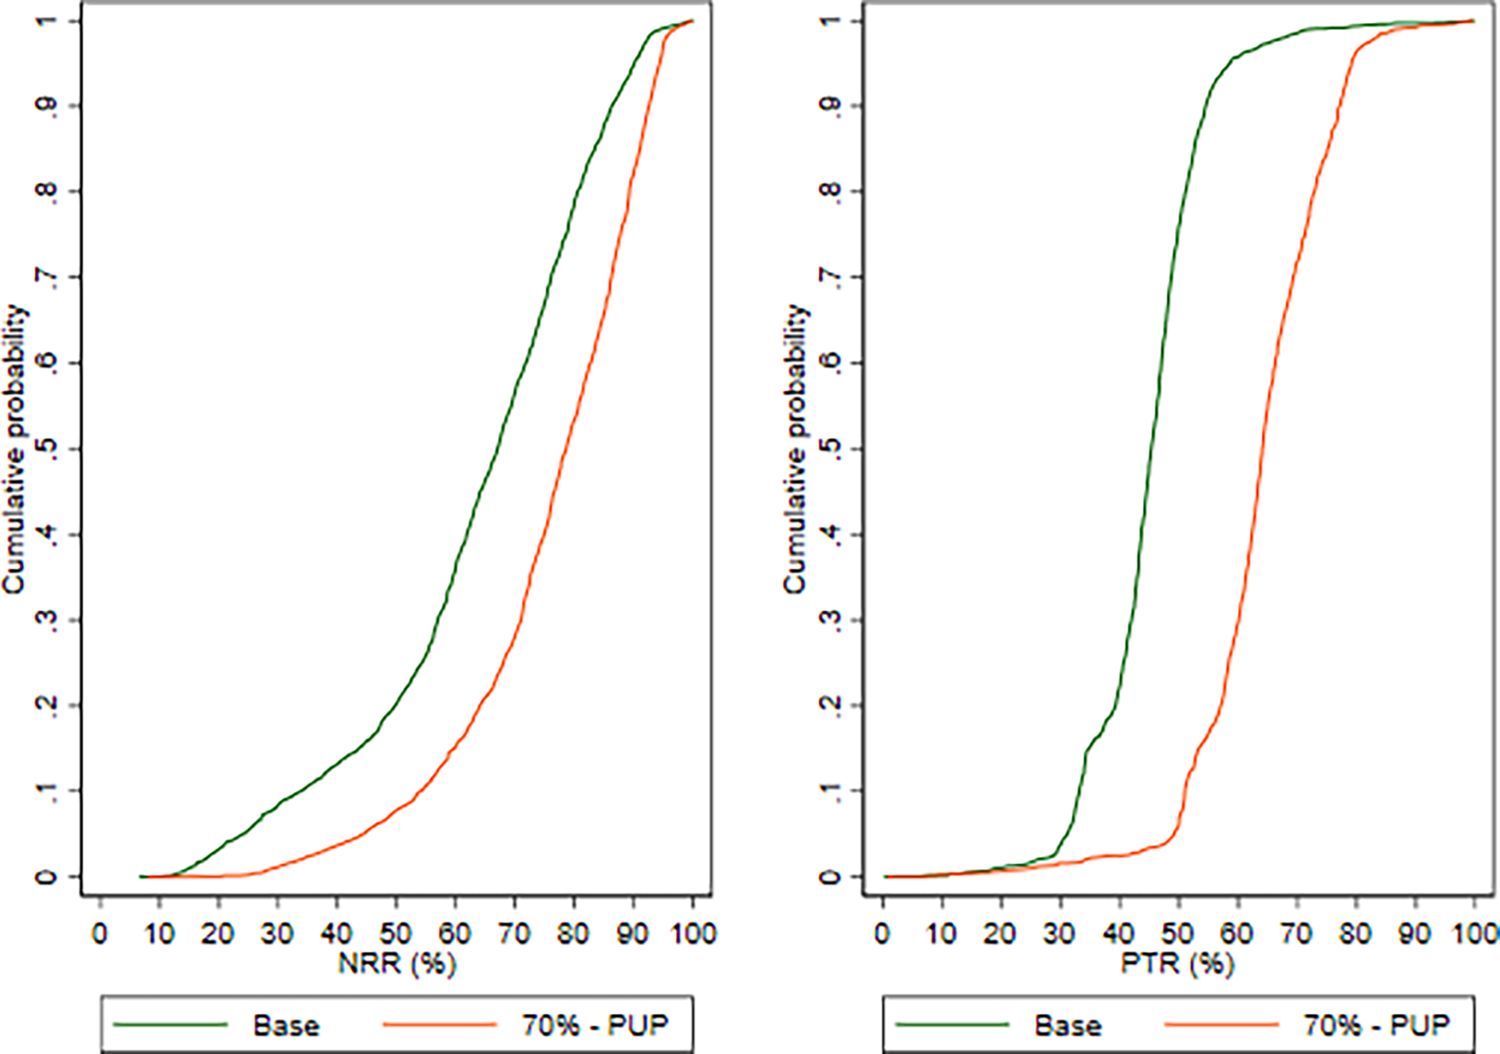
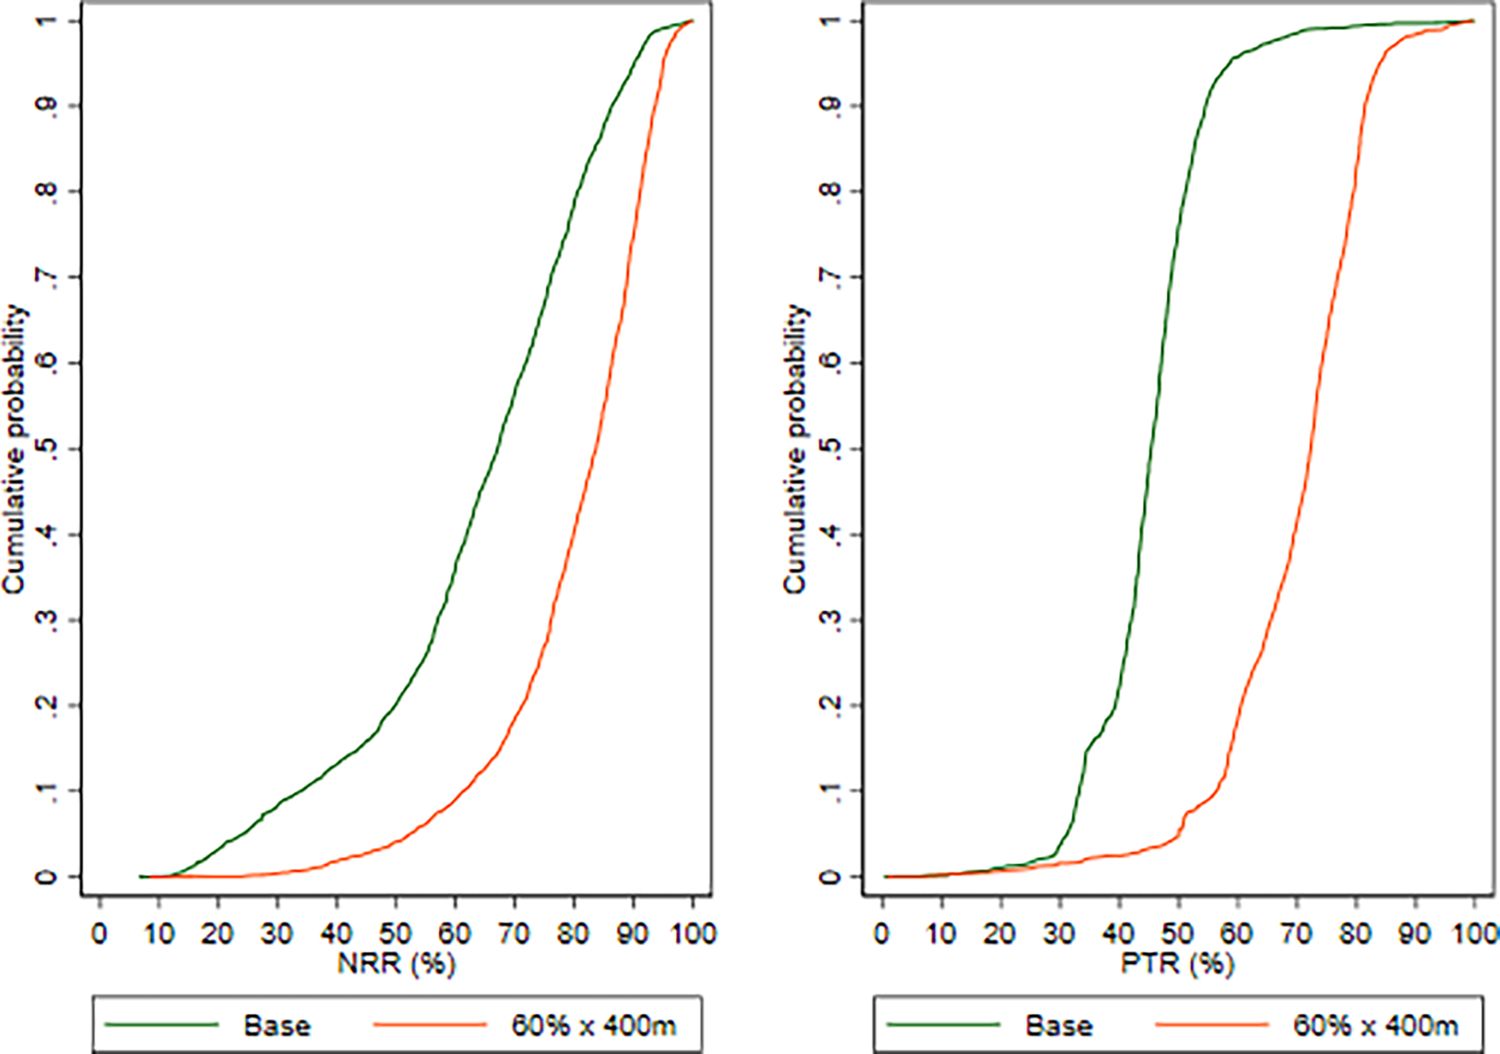
Under the Reform Scenario, we set JB payments equal to 60 per cent of a recipient’s previous income, with maximum caps imposed following the PUP rates.21 Figure 1 plots the cumulative distribution of NRRs and PTRs for individuals under the Baseline (current policy) and Reform Scenario. The left panel depicts the cumulative distribution of NRRs, with the right panel showing the same for PTRs. An increased NRR means that in the event of an individual losing their job, their JB payment will replace a greater proportion of their previous in-work income. This can be seen as both providing a higher level of support in the event of unemployment as well as a weaker financial incentive to be in paid work. Under the reform, the NRRs increase substantially from a median of 67 per cent to a median of 78 per cent.
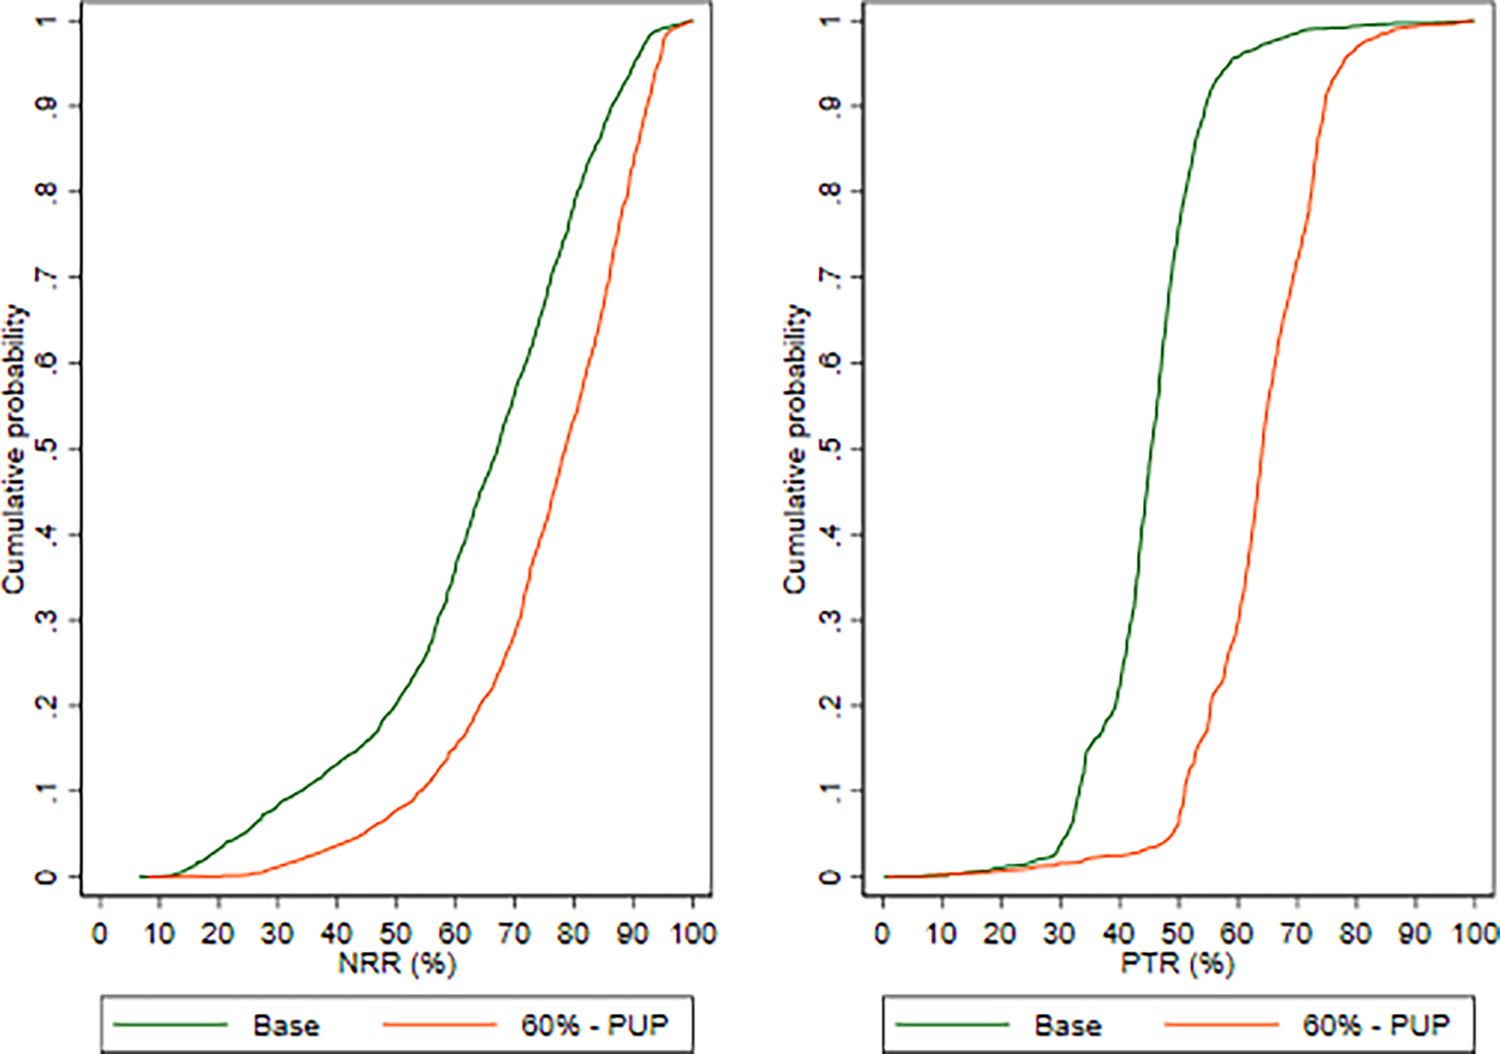
Cumulative distributions NRRs and PTRs, Baseline and Reform Scenario.
Most of the increase in NRRs occurs at the lower end of the cumulative distribution, among those with the lowest NRR values in the baseline. There is a group of individuals in the highest income quintile who have very low NRRs in the baseline. These individuals usually have high in-work earnings and current JB policy would only replace a small share of this, hence the low NRR. This subgroup of high earners benefits to a large extent under the reform, where JB payments are linked to earnings. This is reflected in the considerable outward shift that takes place at the bottom of the cumulative distribution. However, there is also an increase in the share of individuals with NRRs in excess of 70 per cent: up from 43 per cent to 71 per cent. This suggests that the reform has considerably weakened work incentives and leaves the majority of the population with a very low incentive to work.
Such an impression is reinforced by the impact of the reform on PTRs. Around 2 per cent of the sample maintain a PTR below 30 per cent under the reform, almost identical to the baseline. However, substantial increases are observed in the third percentile and beyond, particularly between the 30th and 70th percentiles. The median PTR increases from 45 per cent in the baseline to 64 per cent in the reform. The proportion of the sample with a PTR greater than 70 per cent increases from 1 per cent in the baseline to 28 per cent in the reform (Table 2).
Our hypothetical reform has the effect of increasing the NRRs and PTRs as compared to the baseline of current JB policy. This means that in the event of a job loss, many households would be better equipped to sustain their previous consumption patterns. The cumulative distributions for both the NRRs and PTRs show that much of the increase in their values accrues towards the bottom and middle of the distributions, with the NRRs showing a greater increase at the bottom. This indicates that those currently with the least protection from unemployment benefit to a large extent.
Reform scenarios that have a maximum cap to mean earnings (and thus a higher maximum cap) produce the most dramatic shift in the cumulative distributions of NRRs and PTRs and achieve the highest median values for these measures (Table B4). These more generous reform scenarios, providing the greatest income protection for households during unemployment shocks. However, increasing this cushioning effect against unemployment leads to a drastic reduction in the incentive to work. Social protection benefits, work incentive effects as well as the fiscal cost must be weighed up concurrently when trying to identify an optimal system.
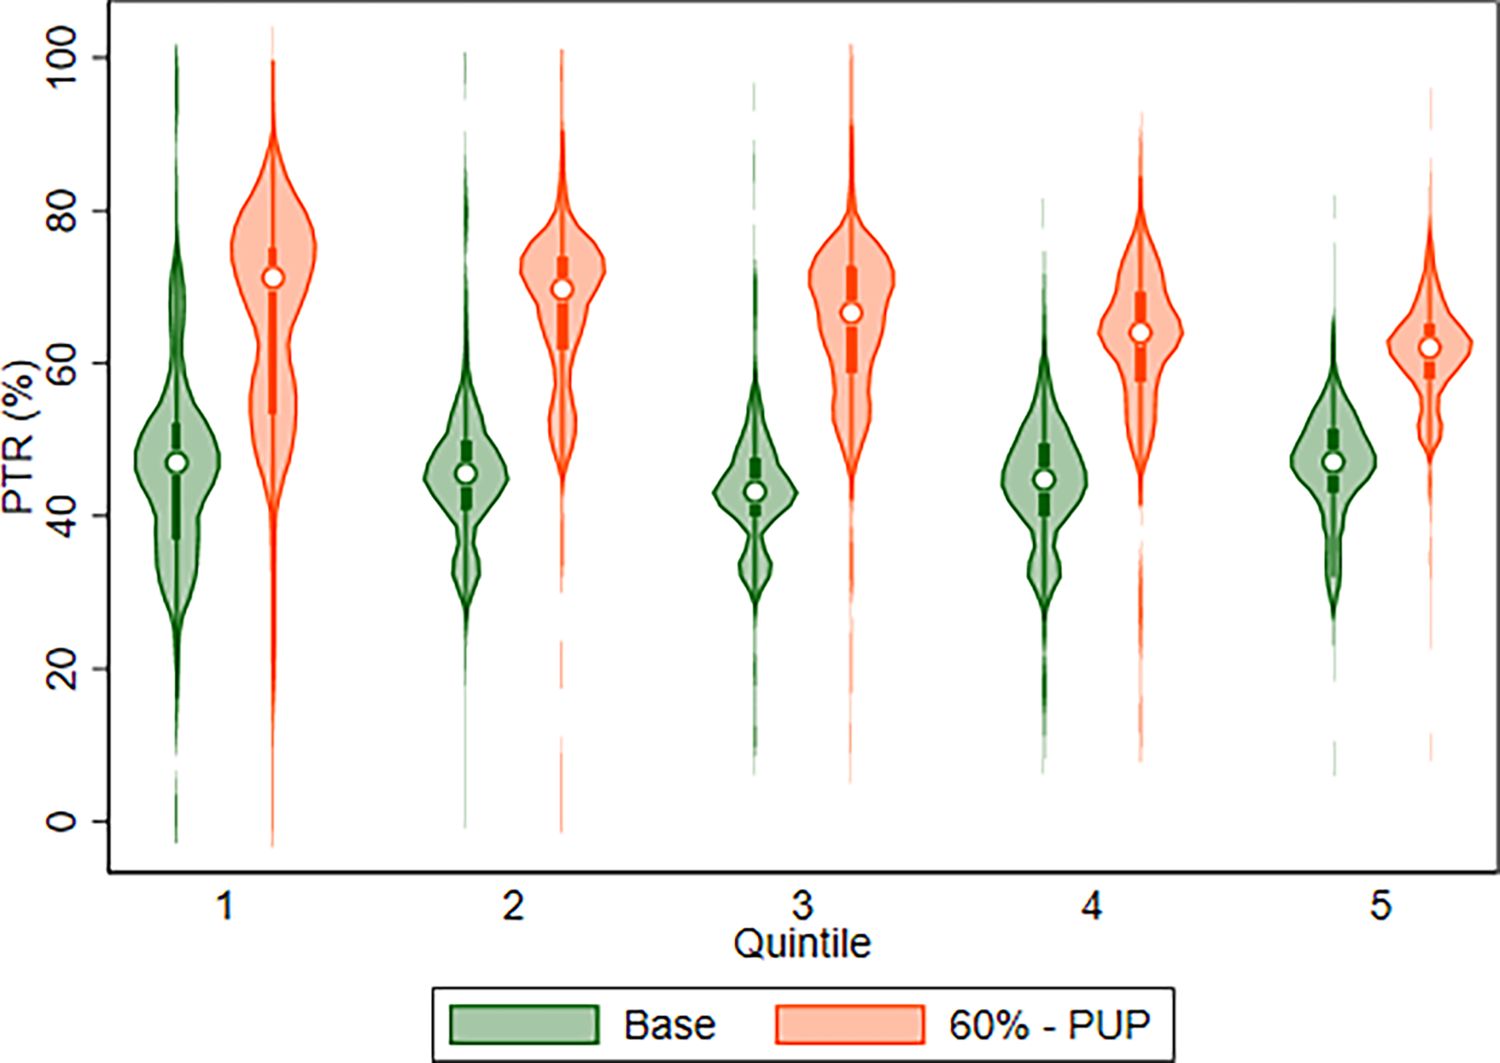
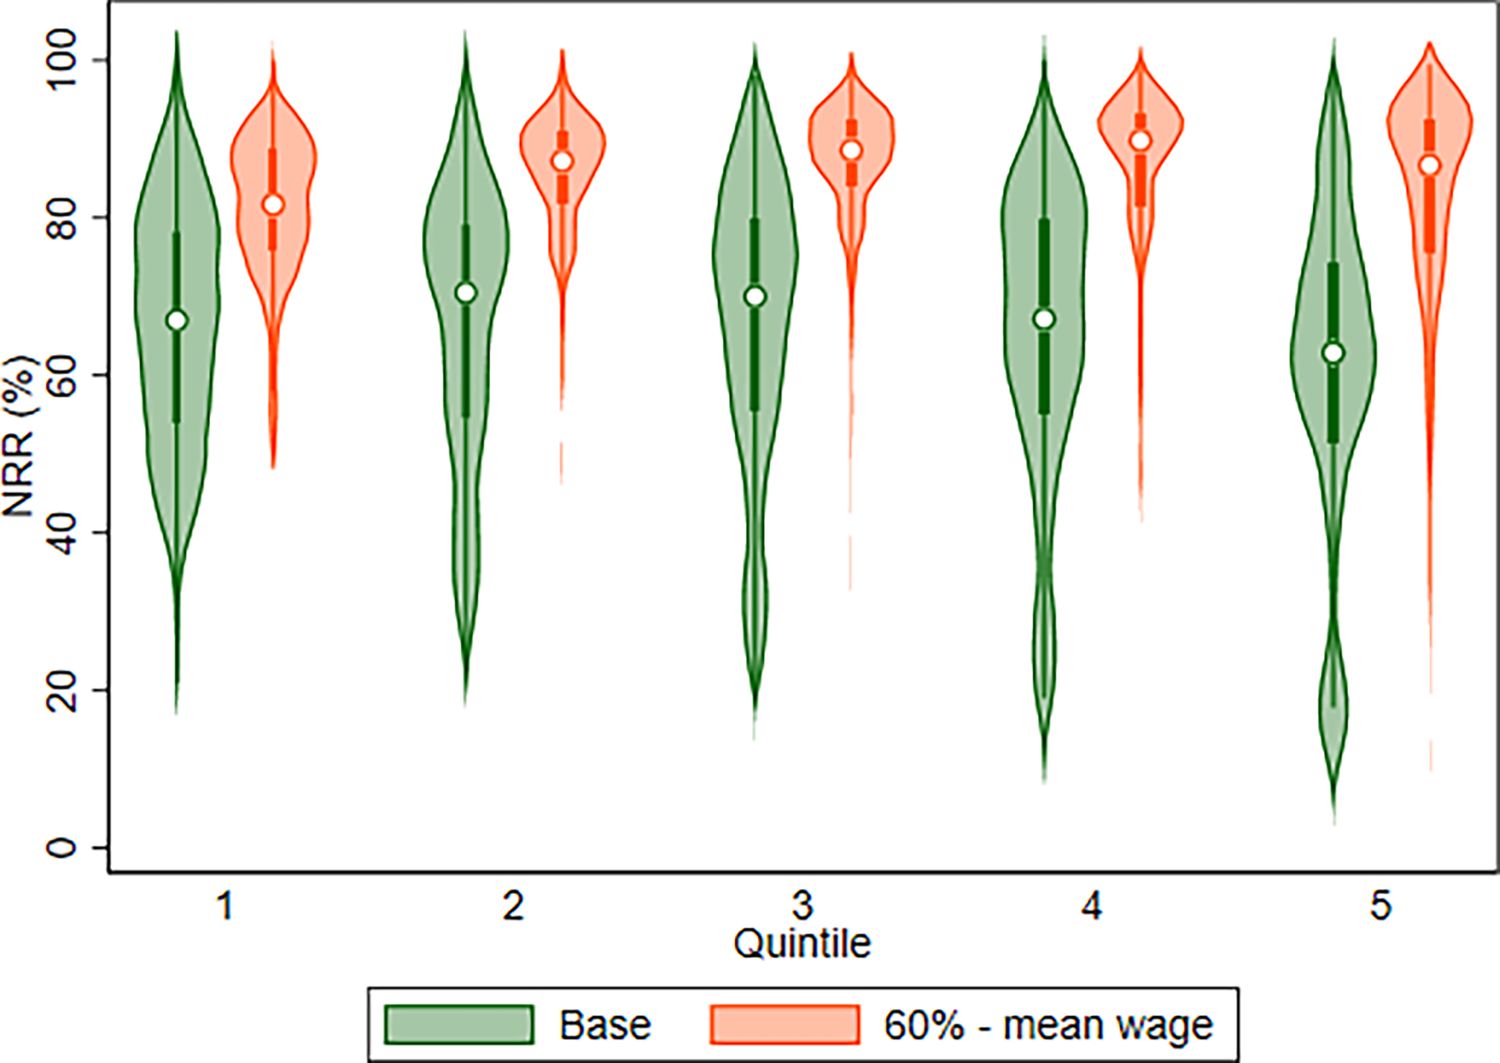
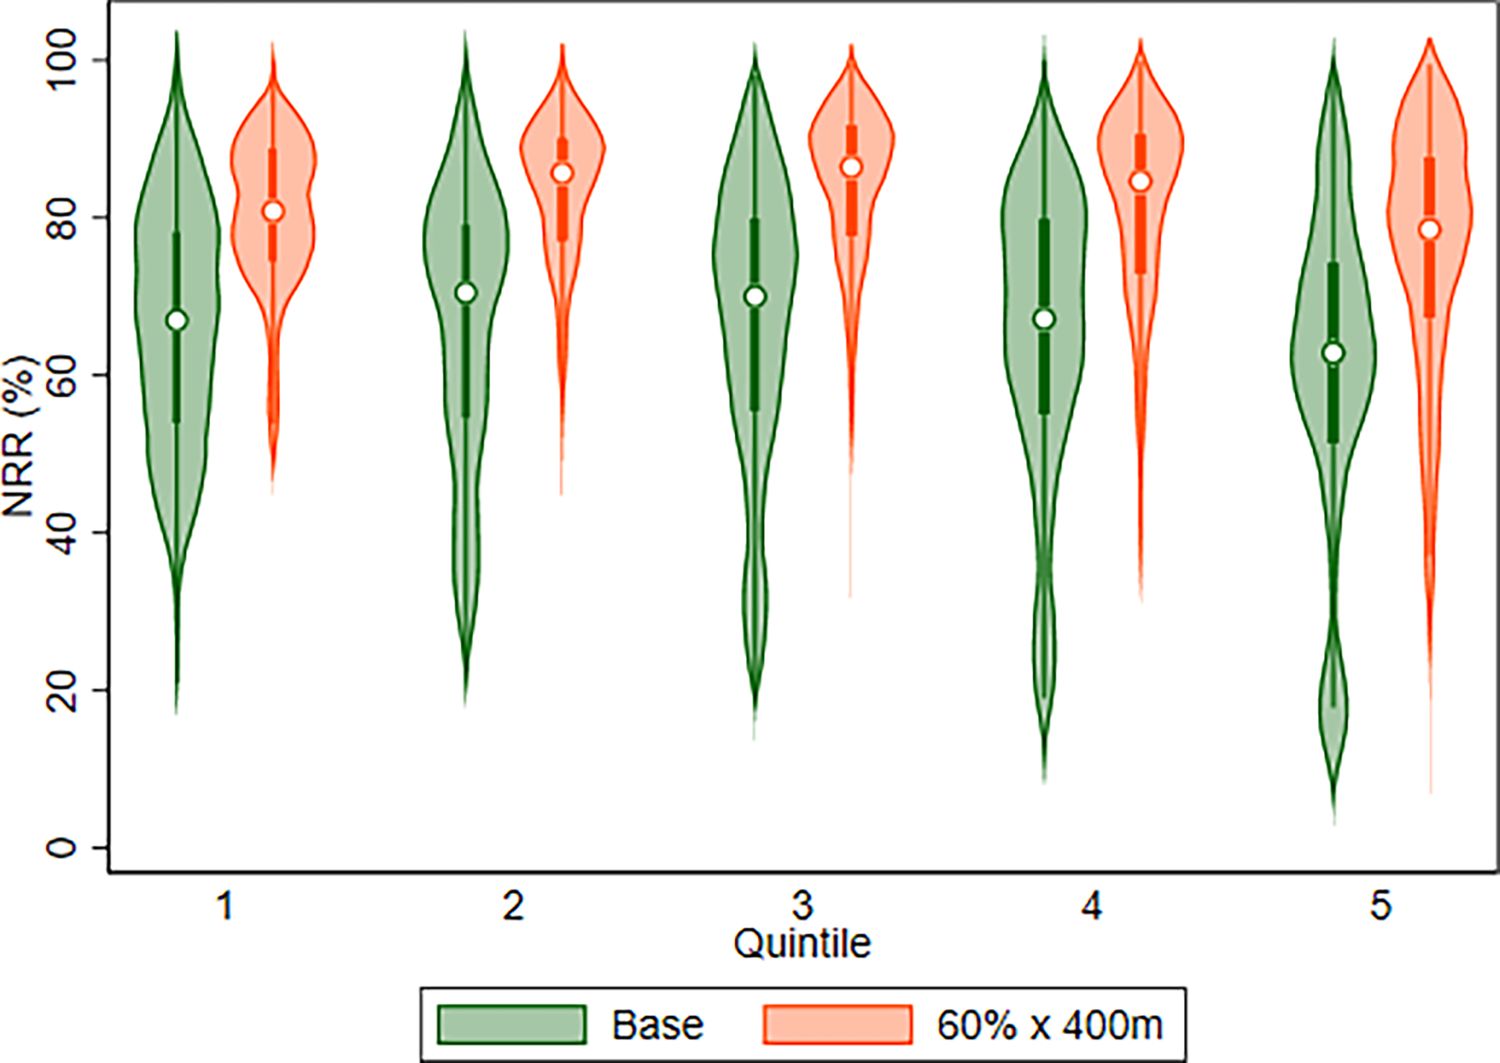
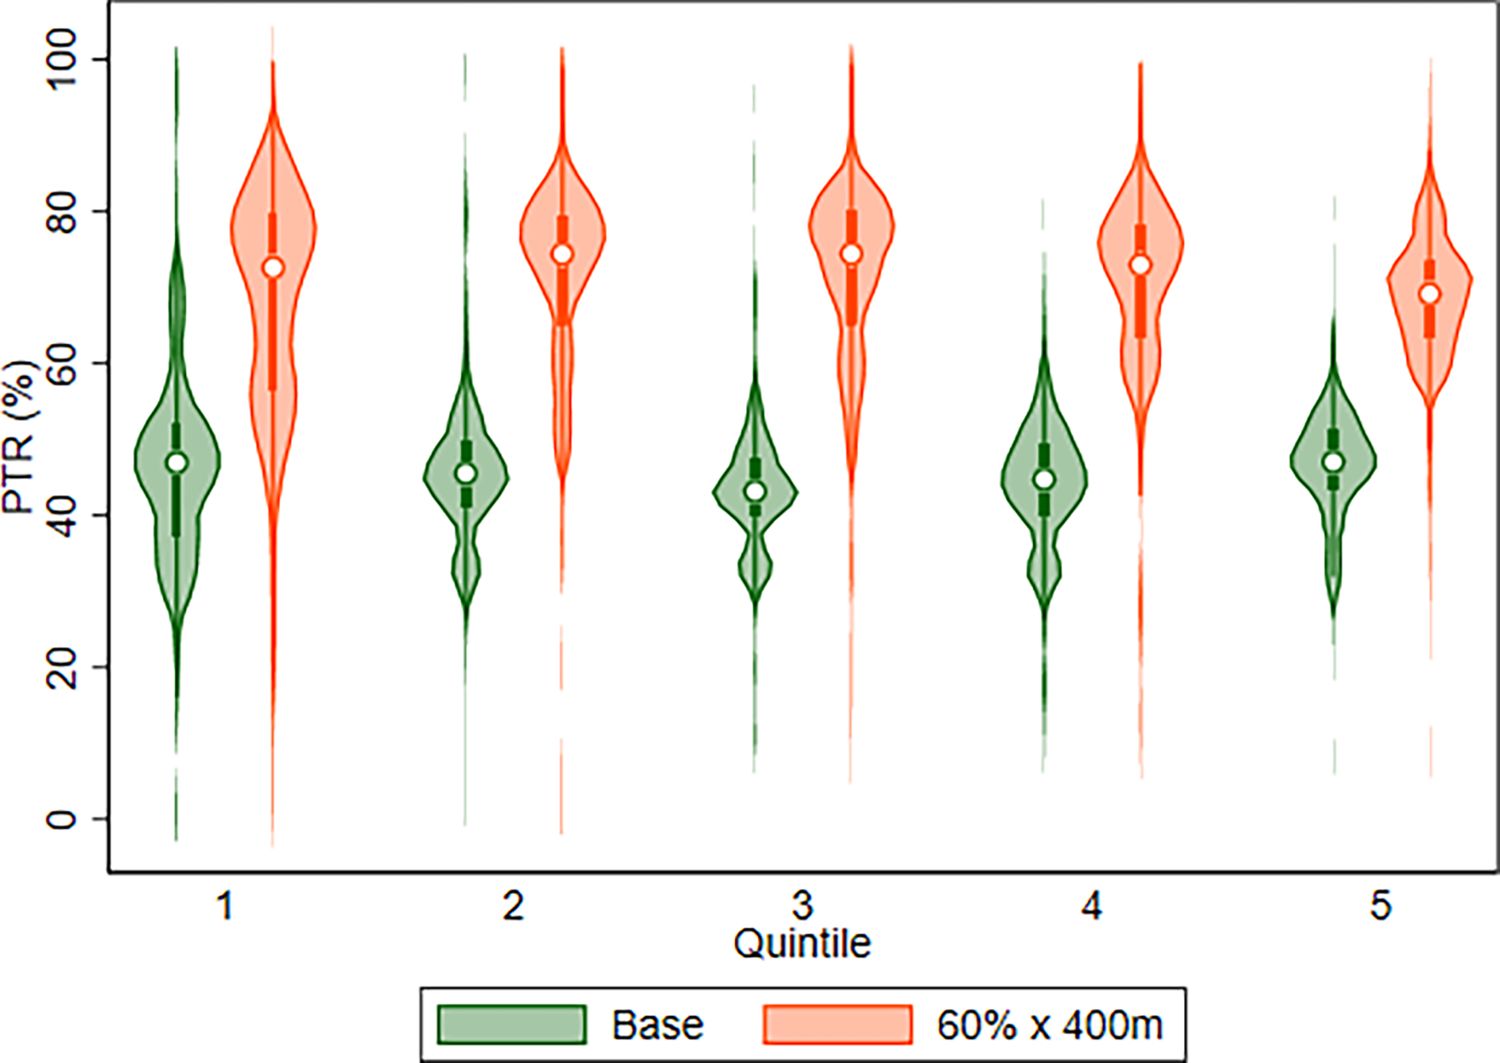
We proceed by presenting results broken down by equivalised household disposable income. Including income as a factor allows us to observe who in the population would gain most from the potential reforms. Figure 2 and Figure 3 use violin plots to display the NRRs and PTRs respectively under the baseline scenario versus the reform. Violin plots combine elements of a box plot and a kernel density plot. Similar to a box plot, they show values for the median, 25th percentile, 75th percentile and adjacent values. In addition, they display the distribution density of a variable. In our plots below, the white circle indicates the median value, the thick central bar represents the interquartile range, the thinner central bar represents the range of adjacent values and the curvy outside bars represent the distribution density.22 Group 1 represents the poorest fifth of individuals who are currently in paid work, with Group 5 representing the richest fifth. Median values for NRRs and PTRs by quintile are also presented in Tables 3 and 5 respectively.
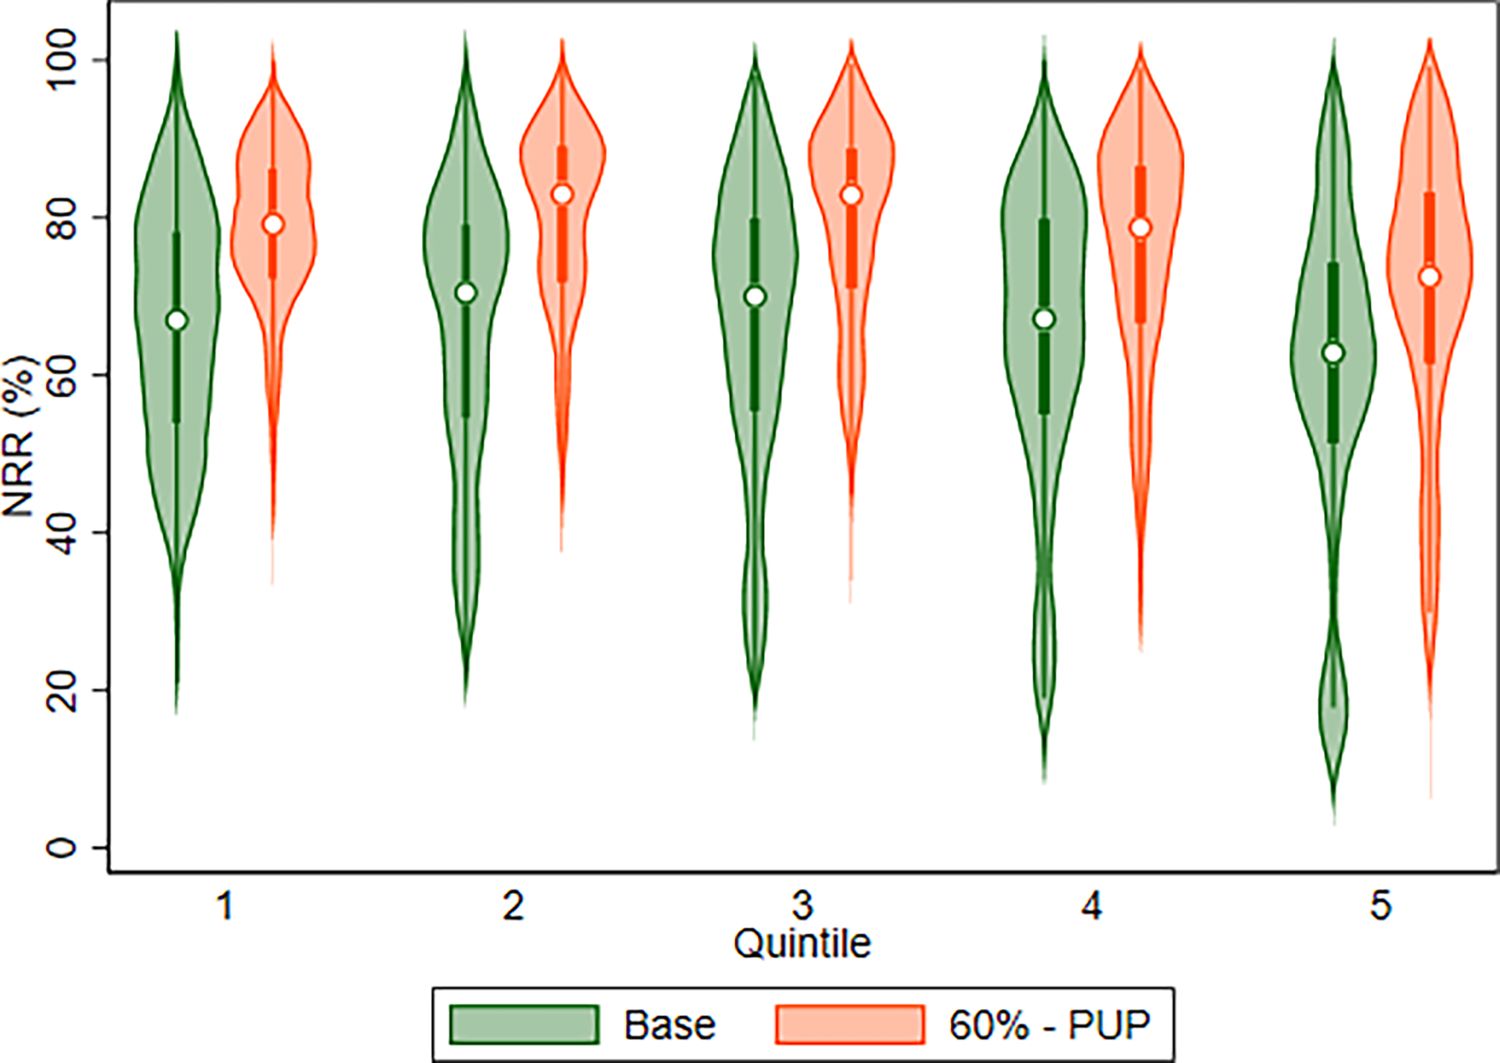
Net Replacement rate, Baseline and Reform Scenario.

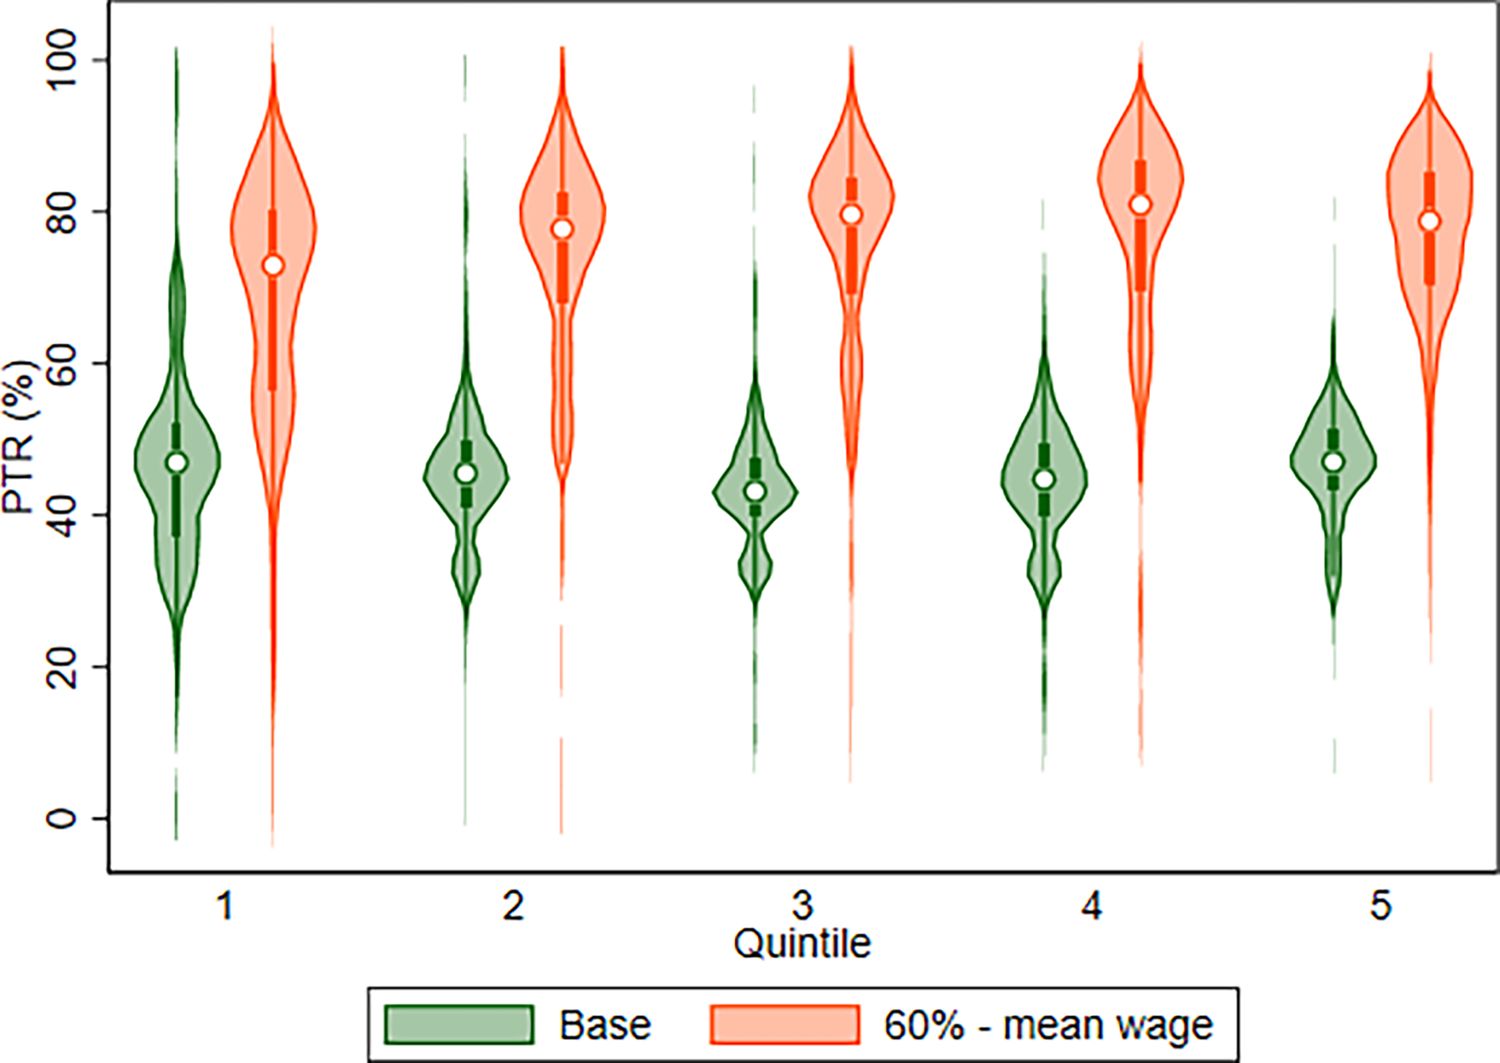
Participation Tax Rate by quintile, Baseline and Reform Scenario.
Median Replacement Rate.
| Income quintile | Baseline (%) | Reform (%) | pp change |
|---|---|---|---|
| Poorest | 67 | 79 | 12 |
| 2 | 71 | 83 | 12 |
| 3 | 70 | 83 | 13 |
| 4 | 67 | 79 | 12 |
| Richest | 63 | 73 | 10 |
-
Source: Authors’ calculations using SWITCH and data from the 2019 SILC. Table B6 at the Appendix presents the Median RR for the rest of the reforms.
Median Participation Tax Rate.
| Income quintile | Baseline (%) | Reform (%) | pp change |
|---|---|---|---|
| Poorest | 47 | 71 | 24 |
| 2 | 46 | 70 | 24 |
| 3 | 43 | 67 | 24 |
| 4 | 45 | 64 | 19 |
| Richest | 47 | 62 | 15 |
-
Source: Authors’ calculations using SWITCH and data from the 2019 SILC. Table B7 at the Appendix presents the median PTR for the rest of the reform.
Figure 2 and Figure 3 display the violin plots for Reform Scenario compared to the Baseline. Figure 2 depicts the NRR values and Figure 3 shows the PTR values. The median NRR values in the baseline are quite high across all quintiles, ranging from a low of 63 percent in the richest quintile to a high of 71 per cent in the second quintile, which indicates that many households are well insulated from unemployment shocks under the current system. The median NRRs increase under the reform across all quintiles, showing the increased unemployment protection it provides. The share of these gains is distributed quite evenly across all quintiles, with the richest quintile benefitting least, but only by a small margin. The median NRR increases from 67 per cent to 79 per cent for households in the first quintile and the same increases from 63 percent to 73 per cent in the richest quintile. This increased protection under the reform comes with the cost of reducing the incentive to work in each quintile, again to roughly similar levels. Results for PTRs by decile follow a somewhat similar pattern (Figure 3), although greater increases occur in the poorer quintiles. The median PTR increases for those in the poorest quintile from 47 per cent to 71 per cent and for those in the richest quintile from 47 per cent to 62 per cent.
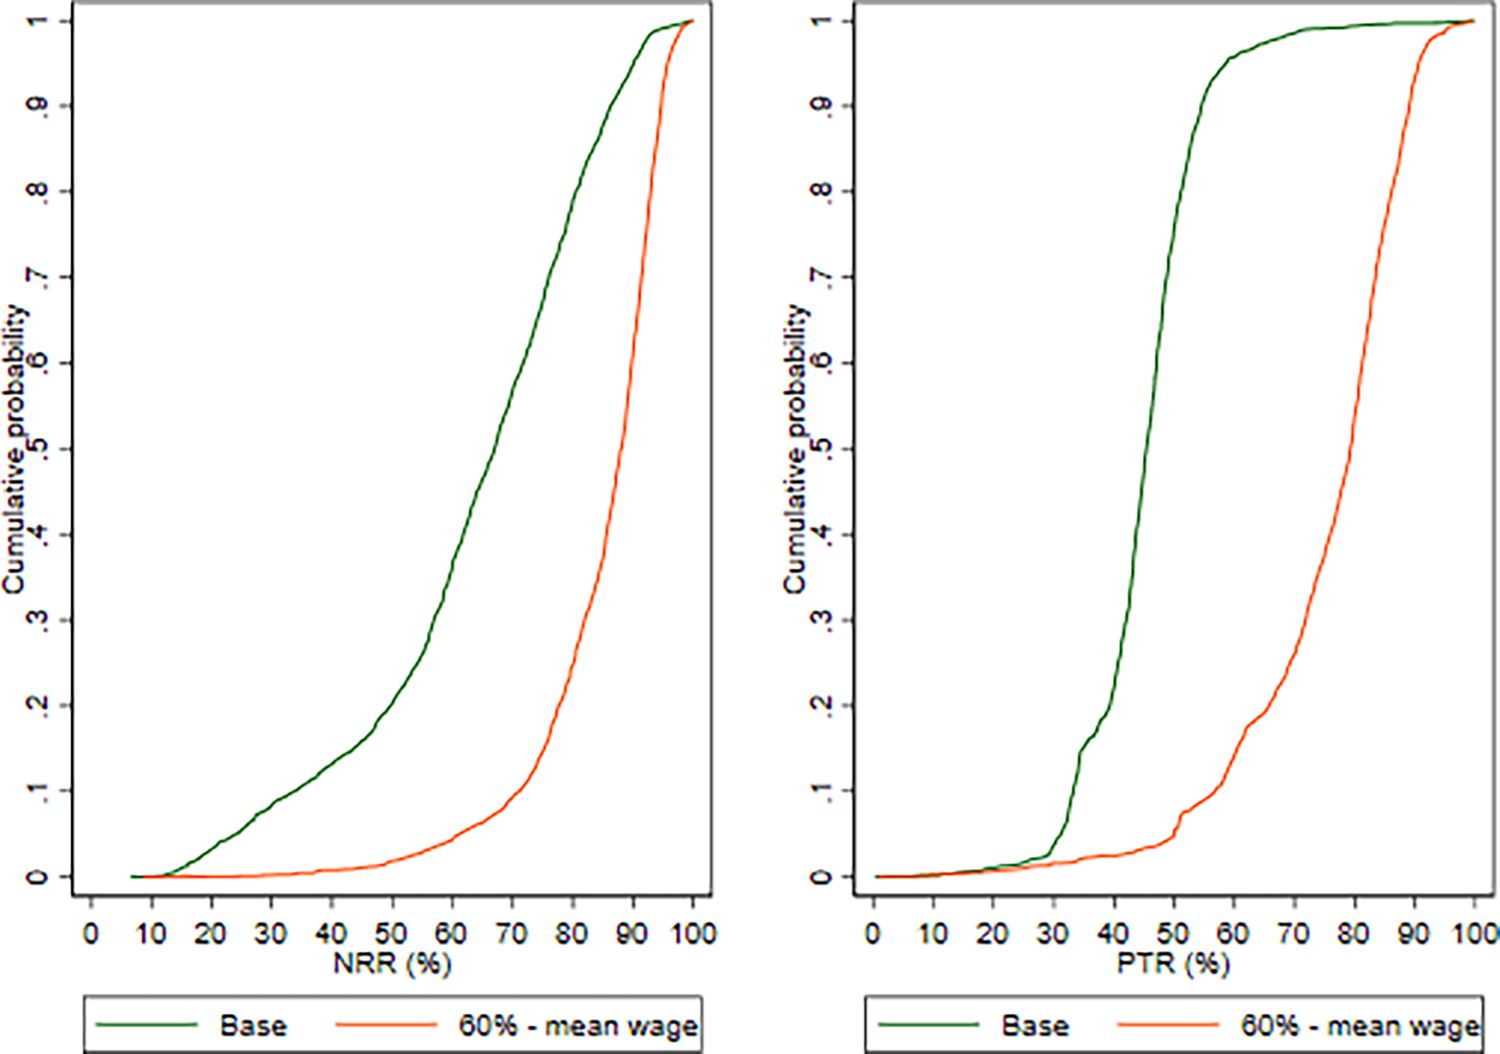
Comparing reforms with a maximum cap set at the PUP rates to reforms where the caps are set based on the median earnings, provides interested results (see Figure B5 and Figure B6). A disproportionate number of households in the richer quintiles reached the maximum cap for their out-of-work income under reforms that use the PUP caps. These households can now augment their out-of-work income, up to the level of the new higher cap. Many lower-income households also increase their out-of-work income, but not to the same extent as individuals from richer quintiles. Hence, richer quintiles benefit by a disproportionate amount under this reform.
Across all quintiles, the median NRRs increase under both reform scenarios (Table 3). This means that in the event of an unemployment shock, an individual’s JB payment would equate to a higher share of their employment income compared to the current JB policy. This would ensure smoother income and consumption patterns across the job status transition, leading to increased welfare in unemployment compared to current policy. Under Reforms that use the PUP rate as a maximum cap (main reform and reform 3), the share of these gains is distributed quite evenly across all quintiles, with the richest quintile benefitting least, but only by a small margin.23 Under Reforms that use the median earnings as a maximum cap (reform 2), the richer quintiles observe the greatest reduction in the incentive to work, as well as the greatest increase in unemployment protection. High-earning individuals end up with the lowest absolute incentive to work. This indicates that lower maximum caps not only reduce the additional fiscal spending required but distribute the gains from the reform in a more equitable manner.
Table 4 displays the share of individuals in each quintile with an NRR greater than 70 per cent.24 Under Reform Scenario, the poorest households experience by far the greatest percentage point increase in the share of individuals with an NRR greater than 70 per cent, increasing from 45 per cent to 84 per cent. This highlights the very significant effect of cushioning the negative income shock of unemployment. In contrast, under Reform 3 which uses a maximum cap set at the median earnings, the biggest increase in this share is for individuals in the richest quintile, with the two poorest quintiles having the smallest increase in the share. The absolute values of the shares demand careful consideration, as they highlight a low incentive to work, particularly for those in the lowest four quintiles. The vast majority in these quintiles face an NRR greater than 70 per cent. Additionally, we examine those with NRR greater than 70 per cent separately for part-time and full-time employees. We find that the share of individuals with NRRs greater than 70 per cent is higher for part-time employees in the baseline. Possibly for this reason, part-time employees face a lower increase in this share after the reform. Full-time employees seem to benefit more from the reform.
Share of individuals with Net Replacement Rate greater than 70 per cent
| All employees | Part-time employees | Full-time employees | |||||||
|---|---|---|---|---|---|---|---|---|---|
| Income quintile | Baseline (%) | Reform (%) | pp change | Baseline (%) | Reform (%) | pp change | Baseline (%) | Reform (%) | pp change |
| Poorest | 45 | 84 | 39 | 62 | 90 | 28 | 33 | 80 | 47 |
| 2 | 52 | 80 | 28 | 87 | 95 | 8 | 37 | 75 | 38 |
| 3 | 50 | 76 | 26 | 86 | 95 | 9 | 35 | 71 | 36 |
| 4 | 44 | 70 | 26 | 71 | 85 | 14 | 40 | 69 | 29 |
| Richest | 32 | 60 | 28 | 85 | 92 | 7 | 29 | 58 | 29 |
-
Source: Authors’ calculations using SWITCH and data from the 2019 Survey on Income and Living Conditions (SILC). The number of individuals in each quintile, split by part-time and full-time employees, and the average wage by quintile can be found in Table B2 and Table B3 at the Appendix respectively.
Like the NRRs, the median PTR values increase across all quintiles (Table 5). Under Reform Scenario, the lowest three quintiles absorb a greater share of the gains, with the median PTR values increasing by lower absolute amounts in the fourth and fifth quintiles. The median PTR in the first quintile increases from 47 per cent to 71 per cent, with the same metric in the fifth quintile growing from 47 per cent to 62 per cent. The incentive to work is reduced across all quintiles, with the greatest reduction occurring in the poorer quintiles. Under Reforms that use as a maximum cap the median earnings though (Reform 2), the greatest increase in median values occurs in the third and fourth quintiles.25 Similar to what we see for the NRRs, this indicates that most of the gains of the reform can be attributed to the richer quintiles. Again, the incentive to work is greatly diminished, most noticeably in the richer quintiles.
Examining the share of individuals with PTRs greater than 70 per cent by quintile, the greatest increases occur in the lowest two quintiles, with each successive increase diminishing. In the first quintile, the share increases from 6 per cent to 53 per cent (Table 6). The absolute values of the PTRs are lower than their NRR counterparts but remain high and, as such, they should not be ignored. Part-time employees have a slightly higher share of employees with PTR greater than 70 per cent. In contrast though with what we found with NRRs, this share increases more than the share for full-time employees under the reform scenario.
Share of individuals with Participation Tax Rate greater than 70 per cent.
| All employees | Part-time employees | Full-time employees | |||||||
|---|---|---|---|---|---|---|---|---|---|
| Income quintile | Baseline (%) | Reform (%) | pp change | Baseline (%) | Reform (%) | pp change | Baseline (%) | Reform (%) | pp change |
| Poorest | 6 | 53 | 47 | 12 | 50 | 38 | 4 | 58 | 54 |
| 2 | 3 | 50 | 47 | 11 | 62 | 51 | 4 | 50 | 46 |
| 3 | 2 | 38 | 36 | 5 | 57 | 52 | 2 | 35 | 33 |
| 4 | 0.6 | 21 | 20.4 | 1 | 40 | 39 | 1 | 21 | 20 |
| Richest | 0.2 | 9 | 8.8 | 2 | 40 | 38 | 0.2 | 8 | 7.8 |
-
Source: Authors’ calculations using SWITCH and data from the 2019 SILC.
Although high NRRs and PTRs may mean that individuals face low financial work incentives, many people still choose to work in such situations. Indeed, research has shown that a vast majority of those with NRRs close to 100 per cent in Ireland are actually in paid work (Savage et al., 2015). A number of reasons could explain this. For example, young individuals could have weak financial work incentives at the beginning of their career but remain in employment as they expect their situation to change in the future (Keane et al., 2021). In addition, individuals could take up paid work even where there is a weak financial incentive to do so because they fear otherwise being subject to some form of sanction or disqualification from social welfare payments, with previous research finding that such measures increase re-employment rates for jobseekers (e.g. Abbring et al., 2005). Lastly, non-financial factors, such as social interaction or status linked with a particular job, could encourage individuals to stay in employment even when the financial incentive to do so is weak (e.g., Kosfeld et al., 2017; Rosso et al., 2010).
5. Conclusions
This paper considers the impact of strengthening the link between previous earnings and unemployment insurance on financial work incentives. It examines this issue in the context of Ireland, one of the few EU countries to not currently operate a system of earnings related benefits. It found that replacement rates increase by about 11 percentage points when we link the rate of the unemployment benefit with previous earnings, while measures of participation tax rates increase by about 27 percentage points. Income inequality and poverty seem to not be really impacted by the reform, likely due to the current low unemployment rate, whereas the additional annual spending required is 278 million.
Another notable finding is that higher maximum payment caps would lead to large increase in replacement rates for high earners and full-time employees, groups that research suggests are more likely to have accumulated savings that can be drawn on to sustain higher levels of consumption through economic shocks (e.g. Lydon and McIndoe-Calder, 2021). This highlights the trade-off between insurance and incentives that linking unemployment benefits to previous earnings involves, and that governments must ultimately attempt to balance. One way of doing so is by applying time-limits to the duration of benefits (Pavoni and Violante, 2007; Pavoni et al., 2013). Indeed, such an approach is already applied in Ireland with the duration of jobseekers’ benefit limited to a period of 9 months for most claimants, down from 12 before the financial crisis.26 As well as helping balance the trade-off between insurance and incentives, more tightly time-limiting the level of jobseeker’s benefit or setting a replacement rate that declines stepwise with the duration of jobseeker's benefit, increase the importance of considering interactions between jobseeker’s benefit and (means-tested) social assistance payments like the jobseeker's assistance. How to best design these payments in combination is a question on which there is not a clear consensus, with the heterogeneity in welfare effects across groups, emphasised by Haan and Prowse (2024), worthy of further study in both Irish and international contexts.
Lastly, although not the focus of our paper, an important consideration of any welfare reform is how it will be funded. The Irish Government has suggested it will pay for the increased generosity of jobseeker's benefit by increasing rates of social security contributions, particularly that paid by employers (Government of Ireland, 2020).27 While the initial short-run incidence of increases in employer contributions would likely be on the employers, international evidence suggests much of the increase is likely to be passed on over time to workers through lower wages or employment and to consumers through increased prices (Gruber, 1997; Anderson and Meyer, 1997; Anderson and Meyer, 2000).28
While we do not consider the combined impact of such a reform here given our approach is a static one (and so we assume the economic incidence of employer contribution increases is on employers), considering the implications of relaxing this assumption would be a fruitful exercise for future research and policymakers alike. So too would further study of the behavioural effects of this reform, which given our static approach we have also not addressed. This could include its effects on consumption behaviour – perhaps using de-identified bank account data like Ganong and Noel (2019) – as well as unemployment duration given a stated rationale for the reform is to help individuals better smooth shocks to employment.
Footnotes
1.
See the MISSOC comparative tables (https://www.missoc.org/missoc-database/comparative-tables/).
2.
Gruber (1994), for example, find that a 10 percentage points increase in the unemployment insurance replacement rate in the United States could lead to a 2.7 per cent lower fall in consumption during the spell of unemployment, while Ganong and Noel (2019) find even larger consumption-smoothing gains from extending the duration of unemployment insurance.
3.
See, for example, Cullen and Gruber (2000) who examine the extent to which unemployment insurance crowds out spousal labour supply, or Guler and Taskin (2013) who find higher unemployment insurance is associated with a large decline in home production. Lydon and McIndoe-Calder (2021) also highlight the potential for such crowding out for higher-earners who accumulated large amounts of savings during the COVID-19 pandemic.
4.
The moral hazard arises because by replacing a higher level of in-work income, earnings-related unemployment benefit weakens the financial incentive to find or take up a new job. See, for example, Layard et al. (1994), Nickell (1998), Krueger and Meyer (2002), and Haan and Prowse (2020).
5.
Such an approach to financing this increased generosity has also been suggested by ICTU (2021) and MacFlynn, 2021, among others, who point to the comparatively low share of revenues raised here in social security contributions. OECD revenue statistics show that such revenues account for less than 17 per cent of total taxation in Ireland, whereas in most EU countries they exceed 25 per cent, see https://www.compareyourcountry.org/tax-revenues.
6.
7.
Evidence on the nature of long-run PRSI incidence in Ireland itself is limited. To the best of our knowledge, Hughes (1985) is the last to have examined this issue, though Hargaden and Roantree (2019) and Hargaden (2020) both examine the incidence of PRSI in the shorter run.
8.
The unemployment benefit in Ireland, the countries unemployment insurance payment, is called "jobseekers' benefit". Both terms (unemployment and jobseekers' benefit) might be used in the text in the same context.
9.
Home assistance was replaced by a scheme called Supplementary Welfare Allowance in 1975. Removing stigma associated with home assistance payments was the main motivation given for this reform, with Frank Cluskey – then Parliamentary Secretary to the Minister for Social Welfare – describing home assistance payments as the legal embodiment of ‘harsh and unfeeling attitudes’ which had no place in the society of 20th century Ireland (Dáil Reports, 1975).
10.
For further information. See https://www.gov.ie/en/service/1221b0-jobseekers-benefit/.
11.
The 2019 SISWS file is available here: https://www.gov.ie/en/publication/02f594-annual-sws-statistical-information-report/.
12.
Jobseekers' assistance is Ireland's unemployment assistance benefit. For further information, see https://www.gov.ie/en/service/1306dc-jobseekers-allowance/.
13.
The 2019 SISWS file is available here: https://www.gov.ie/en/publication/02f594-annual-sws-statistical-information-report/.
14.
Differences in unemployment benefit schemes not only relate to the way the main rate is calculated but also to duration of the benefit, the eligibility criteria and the existence or not of increased rates for dependants.
15.
For more information see Keane et al. (2023).
16.
17.
While self-employed individuals are eligible for jobseeker’s benefit, we exclude them from our analysis as they will not be affected by the move towards an earnings-related system under the current policy discussion in Ireland.
18.
A PTR of 0 per cent would indicate that an individual did not have to pay any tax on their earnings and did not lose any benefit entitlement when they started work, whereas a RR of 0 per cent would indicate that an individual would not receive any income if they did not work. A PTR or RR of 100 per cent would indicate that all of an individual’s earnings would be taken from them in tax or lower benefit entitlements if they worked, so they would be no better off working than not.
19.
In all the scenarios examined, we keep the existing additional rates for dependants (increased qualified adult and increased qualified child). In the changes examined, however, we set an additional cap to the payments, making sure that the total JB payment is not higher than the individual’s previous earnings.
20.
For more details on the mean daily earnings, see https://www.gov.ie/en/press-release/fee76-tanaiste-announces-details-of-statutory-sick-pay-scheme/.
21.
About 40,000 individuals are simulated to be in receipt of a JB payment, with the Irish unemployment rate being at 4.4% in 2022.
22.
Previous research for Ireland and the UK has used the share of those with replacement rates above 70 per cent as an indicator of potential distortions to labour market decisions (Adam and Browne, 2010; Callan et al., 2016). Adam and Browne (2010) show that in the UK 60% of those with replacement rates higher than 70 per cent are out of employment.
23.
For the rest of the reforms, the relevant analyses can be found at Figures B1–B12 in Appendix B.
24.
The upper and lower adjacent values are defined as 1.5 times the interquartile range. Values outside the upper and lower adjacent values are considered outliers.
25.
Table B6 at the Appendix presents the Median RR for the rest of the reforms.
26.
27.
Table B7 at the Appendix presents the median PTR for the rest of the reform.
28.
Appendix A
About SWITCH
The results presented in this paper are derived from SWITCH, the ESRI’s direct tax and benefit microsimulation model. SWITCH simulates the direct tax liabilities and social welfare entitlements of the Irish population using the nationally representative Survey of Income and Living Conditions (SILC). SILC is an annual household survey conducted by the CSO that collects detailed information on individuals’ incomes, along with detailed demographic information. The data have also been reweighted to match 2019’s official statistics about employment, unemployment and the gender-age profile of the population – as reported by the CSO – as well as a forecasted version of the 2019 income distribution for employees and the self-employed. In the reweighting process, existing targets set by the CSO for the SILC weights about the household composition and the regional distribution of the population were also kept. We uprate these quantities to 2022, then use SWITCH to simulate the net change in household disposable income for each of the reforms examined in the paper.
Our estimates assume that households’ behaviour remains unchanged in response to a change in relative prices of goods/services and labour/leisure. This means the results are best interpreted as showing the initial ‘first round’ effects of the reforms considered. For more information about SWITCH, see Keane et al. (2023).
Weekly Pandemic Unemployment Payment rates.
| Previous weekly income (Y) | Weekly PUP payment |
|---|---|
| Y < €150 | €150 |
| €150 ≤ Y < €220 | €203 |
| €220 ≤ Y < €300 | €250 |
| €300 ≤ Y < €400 | €300 |
| Y ≥ €400 | €350 |
-
Source: Rates from October 2020, see https://www.gov.ie/en/publication/0b0fc-covid-19-pandemic-unemployment-payment-rates/#rates-from-7-september-2021.
Appendix B
Unemployment Benefit Reforms.
| No. | Reform |
|---|---|
| 1 | 60% of previous earnings – maximum caps based on PUP rates |
| 2 | 60% of previous earnings – maximum cap set at 60% of mean daily earnings |
| 3 | 70% of previous earnings – maximum caps based on PUP rates |
| 4 | 60% of previous earnings – maximum cap set at 43% of mean daily earnings |
Number of employees by household quintile and employment type.
| Income quintile | All employees | Part-time employees | Full-time emploees |
|---|---|---|---|
| Poorest | 180,267 | 80,714 | 99,552 |
| 2 | 338,642 | 100,951 | 237,691 |
| 3 | 459,839 | 123,837 | 336,001 |
| 4 | 503,762 | 64,397 | 439,365 |
| Richest | 578,028 | 35,171 | 542,857 |
-
Source: Authors’ calculations using SWITCH and data from the 2019 SILC.
Average monthly wage by quintile (€).
| Income quintile | All employees | Part-time employees | Full-time emploees |
|---|---|---|---|
| Poorest | 1,994 | 1,269 | 2,581 |
| 2 | 2,562 | 1,419 | 3,047 |
| 3 | 2,973 | 1,611 | 3,476 |
| 4 | 4,076 | 2,269 | 4,341 |
| Richest | 5,753 | 3,369 | 5,972 |
-
Source: Authors’ calculations using SWITCH and data from the 2019 SILC.
Work incentives and additional spending required.
| No | Reform | Median NRR (%) | Share with NRR > 70% (%) | Median PTR (%) | Share with PTR > 70% (%) | Additional spending (€) |
|---|---|---|---|---|---|---|
| Baseline | Baseline | 67 | 43 | 45 | 1 | n/a |
| 1 | Reform scenario | 78 | 71 | 64 | 28 | 278m |
| 2 | RR: 60% Cap: 60% mean earnings | 88 | 91 | 79 | 74 | 588m |
| 3 | RR: 70% Cap: PUP | 79 | 72 | 64 | 28 | 285m |
| 4 | RR: 60% Cap: 43% mean earnings | 84 | 81 | 72 | 59 | 399m |
-
Source: Authors’ calculations using SWITCH and data from the 2019 SILC.
Income inequality and poverty.
| Gini | Poverty – Whole population | Poverty – Working age adult population | Elderly poverty* | Children poverty | |
|---|---|---|---|---|---|
| Baseline 2022 | 0.278 | 13.63% | 13.31% | 12.20% | 15.77% |
| Reform 1 | 0.277 | 13.57% | 13.24% | 12.18% | 15.68% |
| Reform 2 | 0.277 | 13.39% | 13.04% | 11.85% | 15.35% |
| Reform 3 | 0.277 | 13.57% | 13.24% | 12.18% | 15.68% |
| Reform 4 | 0.277 | 13.42% | 13.08% | 11.85% | 15.41% |
-
Source: Authors’ calculations using SWITCH and data from the 2019 SILC.
-
*
Changes in the elderly poverty rates are driven by a small number of observations and thus should be read with caution.
Median Replacement Rate, Reform 2-4.
| Income quintile | Baseline (%) | Reform 2 | Reform 3 | Reform 4 | |||
|---|---|---|---|---|---|---|---|
| NRR (%) | pp change | NRR (%) | pp change | NRR (%) | pp change | ||
| Poorest | 67 | 82 | 15 | 80 | 13 | 81 | 14 |
| 2 | 71 | 88 | 17 | 84 | 13 | 86 | 15 |
| 3 | 70 | 89 | 19 | 84 | 14 | 86 | 17 |
| 4 | 67 | 90 | 23 | 79 | 12 | 84 | 18 |
| Richest | 63 | 87 | 24 | 73 | 10 | 78 | 16 |
-
Source: Authors’ calculations using SWITCH and data from the 2019 SILC.
Participation Tax Rate, Reform 2-4.
| Income quintile | Baseline (%) | Reform 2 | Reform 3 | Reform 4 | |||
|---|---|---|---|---|---|---|---|
| PTR (%) | pp change | PTR (%) | pp change | PTR (%) | pp change | ||
| Poorest | 47 | 73 | 26 | 72 | 25 | 73 | 26 |
| 2 | 46 | 78 | 32 | 71 | 25 | 76 | 30 |
| 3 | 43 | 80 | 37 | 67 | 24 | 75 | 32 |
| 4 | 45 | 81 | 36 | 64 | 19 | 73 | 28 |
| Richest | 47 | 79 | 32 | 62 | 15 | 69 | 22 |
-
Source: Authors’ calculations using SWITCH and data from the 2019 SILC.

Reform 1 baseline versus 60% of previous earnings with maximum caps based on PUP rates

Net Replacemet Rates, Reform 1 baseline versus 60% of previous earnings with maximum caps based on PUP rates
Participation Tax Rates, Reform 1 baseline versus 60% of previous earnings with maximum caps based on PUP rates
Reform 2: baseline versus 60% of previous earnings with maximum cap set at 60% of mean wage
Net Replacement Rates, Reform 2: baseline versus 60% of previous earnings with maximum cap set at 60% of mean wage.
Participation Tax Rates, Reform 2: baseline versus 60% of previous earnings with maximum cap set at 60% of mean wage.
Reform 3: baseline versus 70% of previous earnings with maximum caps based on PUP rates.

Net Replacement Rates, Reform 3: baseline versus 70% of previous earnings with maximum caps based on PUP rates.
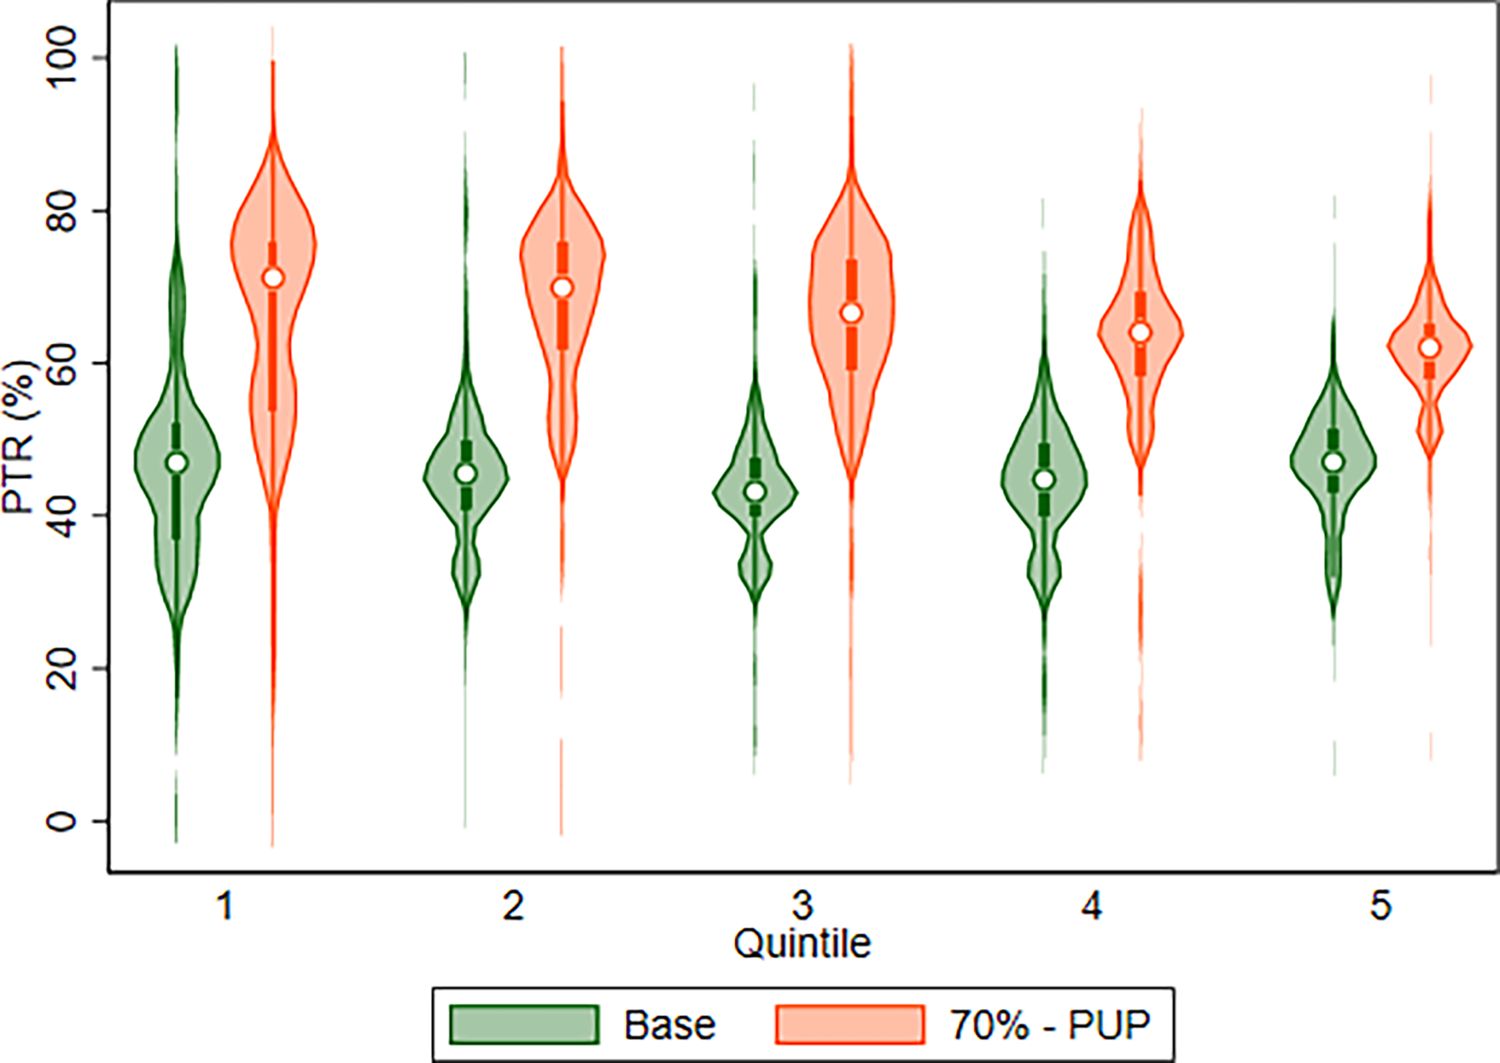
Participation Tax Rates, Reform 3: baseline versus 70% of previous earnings with maximum caps based on PUP rates.
Reform 4: baseline versus 60% of previous earnings with maximum cap set at 43% of mean earnings (to give cost of c. €400m).
Net replacement rates, Reform 4: baseline versus 60% of previous earnings with maximum cap set at 43% of mean earnings (to give cost of c. €400m).
Participation tax rates, Reform 4: baseline versus 60% of previous earnings with maximum cap set at 43% of mean earnings (to give cost of c. €400m).
References
-
1
The Effect of Unemployment Insurance Sanctions on the Transition Rate from Unemployment to EmploymentThe Economic Journal 115:602–630.https://doi.org/10.1111/j.1468-0297.2005.01011.x
- 2
- 3
-
4
The effects of firm specific taxes and government mandates with an application to the U.S. unemployment insurance programJournal of Public Economics 65:119–145.https://doi.org/10.1016/S0047-2727(96)01624-6
-
5
The effects of the unemployment insurance payroll tax on wages, employment, claims and denialsJournal of Public Economics 78:81–106.https://doi.org/10.1016/S0047-2727(99)00112-7
-
6
Universal credit: a preliminary analysis of its impact on incomes and work incentives*Fiscal Studies 33:39–71.https://doi.org/10.1111/j.1475-5890.2012.00152.x
-
7
Budget PerspectivesFinancial incentives to work: Comparing Ireland and the UK, Budget Perspectives, 2017, Economic and Social Research Institute, Dublin.
-
8
A Tax-Benefit Model for Austria (AUTAX): Work Incentives and Distributional Effects of the 2016 Tax ReformInternational Journal of Microsimulation 10:144–176.https://doi.org/10.34196/ijm.00160
- 9
-
10
Does unemployment insurance crowd out spousal labor supply?Journal of Labor Economics 18:546–572.https://doi.org/10.1086/209969
- 11
-
12
In-work benefits in belgium: effects on labour supply and welfareInternational Journal of Microsimulation 14:43–72.https://doi.org/10.34196/IJM.00229
- 13
- 14
-
15
Consumer spending during unemployment: positive and normative implicationsAmerican Economic Review 109:2383–2424.https://doi.org/10.1257/aer.20170537
-
16
Tax and benefit policies to reduce poverty in the netherlands: a microsimulation analysisInternational Journal of Microsimulation 16:108–133.https://doi.org/10.34196/IJM.00277
- 17
-
18
The Consumption Smoothing Benefits of Unemployment Insurance, Working Paper No.4750National Bureau of Economic Research.
-
19
The incidence of payroll taxation: evidence from chileJournal of Labor Economics 15:S72–S101.https://doi.org/10.1086/209877
-
20
Does unemployment insurance crowd out home production?European Economic Review 62:1–16.https://doi.org/10.1016/j.euroecorev.2013.04.006
- 21
-
22
The Heterogeneous Effects of Social Assistance and Unemployment Insurance: Evidence from a Life Cycle Model of Family Labor Supply and SavingsAmerican Economic Journal 16:127–181.https://doi.org/10.1257/mac.20200217
- 23
-
24
Taxpayer responses in good times and badJournal of Economic Behavior & Organization 176:653–690.https://doi.org/10.1016/j.jebo.2020.05.003
-
25
Research Series No. 120, Economic and Social Research Institute, DublinResearch Series No. 120, Economic and Social Research Institute, Dublin.
- 26
-
27
Work incentives at the extensive and intensive margin in europe: the role of taxes, benefits and population characteristicsSocial Indicators Research 152:705–778.https://doi.org/10.1007/s11205-020-02462-0
-
28
Economic and Social Research Institute, DublinEconomic and Social Research Institute, Dublin.
-
29
SWITCH: A Tax-Benefit Model for Ireland Linked to Survey and Register DataInternational Journal of Microsimulation 16:55–68.https://doi.org/10.34196/IJM.00275
-
30
The effects of financial and recognition incentives across work contexts: The role of meaningEconomic Inquiry 55:237–247.https://doi.org/10.1111/ecin.12350
-
31
Handbook of Public Economics2327–2392, Labor supply effects of social insurance, Handbook of Public Economics, Vol, 4, p, 10.1016/S1573-4420(02)80012-X.
- 32
-
33
Central Bank of Ireland Economic Letter Series, 2021, no.4Central Bank of Ireland Economic Letter Series, 2021, no.4.
- 34
-
35
Unemployment: questions and some answersThe Economic Journal 108:802–816.https://doi.org/10.1111/1468-0297.00316
-
36
Optimal Welfare-to-Work ProgramsReview of Economic Studies 74:283–318.https://doi.org/10.1111/j.1467-937X.2007.00422.x
-
37
Search and Work in Optimal Welfare ProgramsNational Bureau of Economic Research, 10.3386/w18666.
- 38
-
39
On the meaning of work: A theoretical integration and reviewResearch in Organizational Behavior 30:91–127.https://doi.org/10.1016/j.riob.2010.09.001
-
40
A profile of financial incentives to work in IrelandJournal of the Statistical and Social Inquiry Society of Ireland, XLIV.
-
41
EUROMOD: the European Union tax-benefit microsimulation modelInternational Journal of Microsimulation 6:4–26.https://doi.org/10.34196/ijm.00075
-
42
The Cost of Basic Income in the United Kingdom: A Microsimulation AnalysisInternational Journal of Microsimulation 16:1–18.https://doi.org/10.34196/IJM.00286
Article and author information
Author details
Acknowledgements
Corresponding author: Theano Kakoulidou (Theano.Kakoulidou@esri.ie). We are grateful to the Central Statistics Office (CSO) for facilitating access to the Survey of Income and Living Conditions (SILC) Research Microdata File used to construct the database for the SWITCH tax-benefit model. This work was carried out with funding from the ESRI’s Tax, Welfare and Pensions Research Programme (supported by the Department of Public Expenditure and Reform, the Department of Social Protection, the Department of Health, the Department of Children and Youth Affairs and the Department of Finance), which is gratefully acknowledged. We would like to thank the anonymous reviewers for their comments and suggestions. All views, error and omissions remain the sole responsibility of the authors.
Publication history
- Version of Record published: December 31, 2024 (version 1)
Copyright
© 2024, Kakoulidou et al.
This article is distributed under the terms of the (Creative Commons Attribution License, which permits unrestricted use and redistribution provided that the original author and source are credited.