The Effect of Earnings-Related Benefits on Financial Work Incentives
- Economic and Social Research Institute, Ireland
- Trinity College Dublin, Ireland
- Institute for Fiscal Studies, United Kingdom
Figures
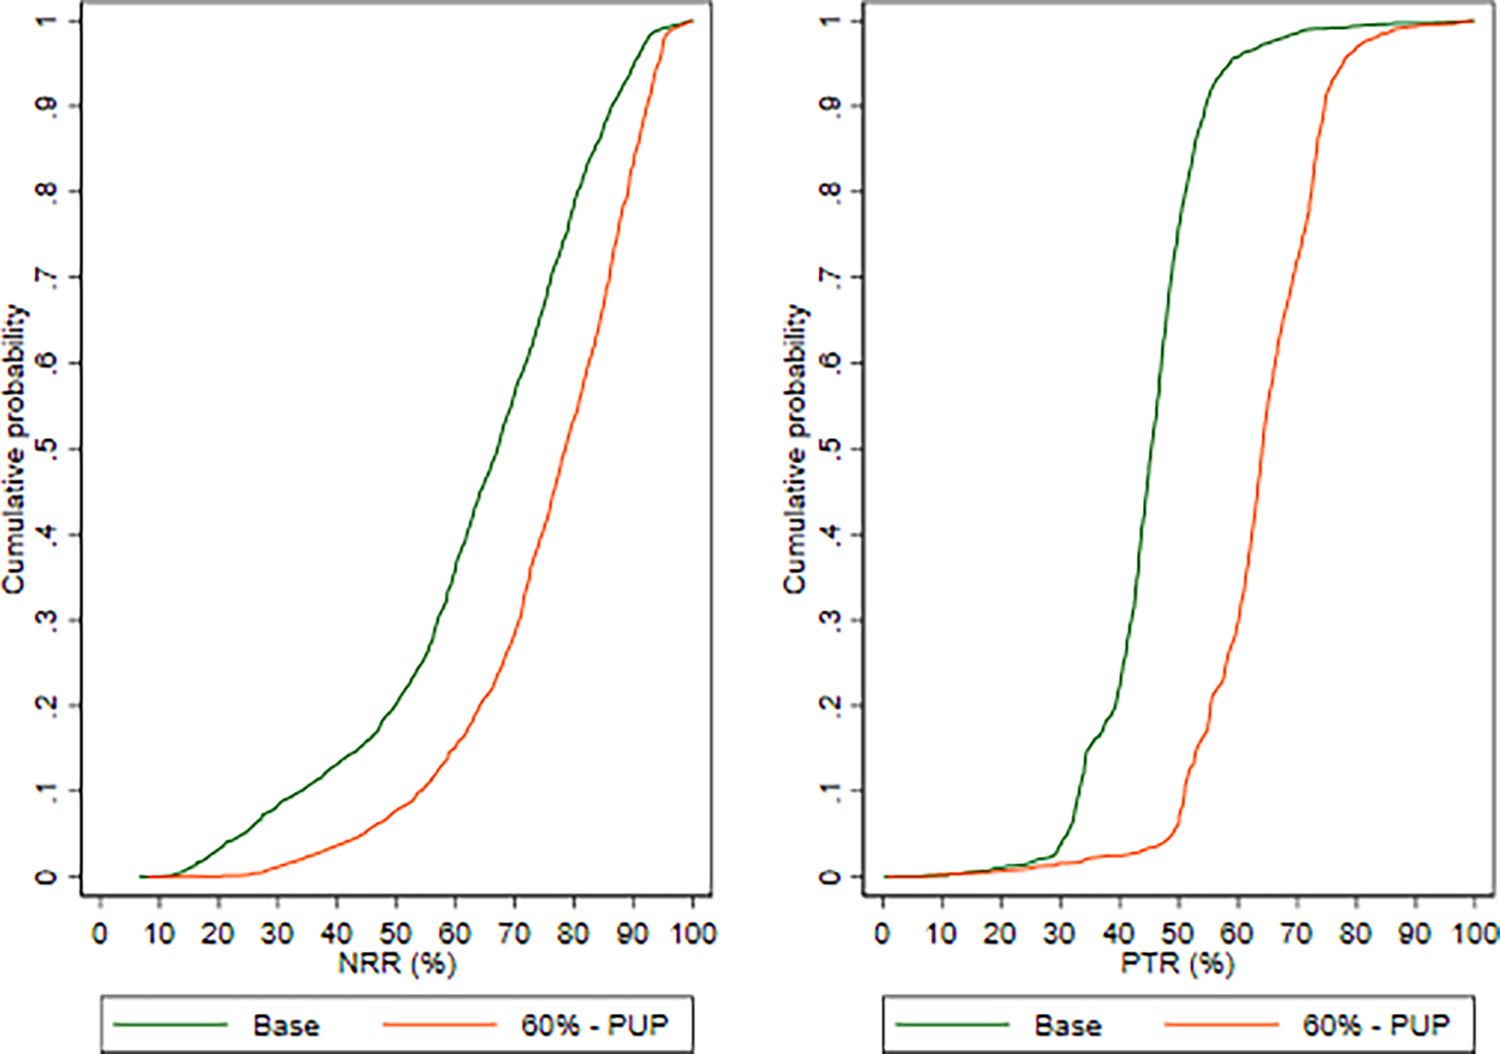
Cumulative distributions NRRs and PTRs, Baseline and Reform Scenario.
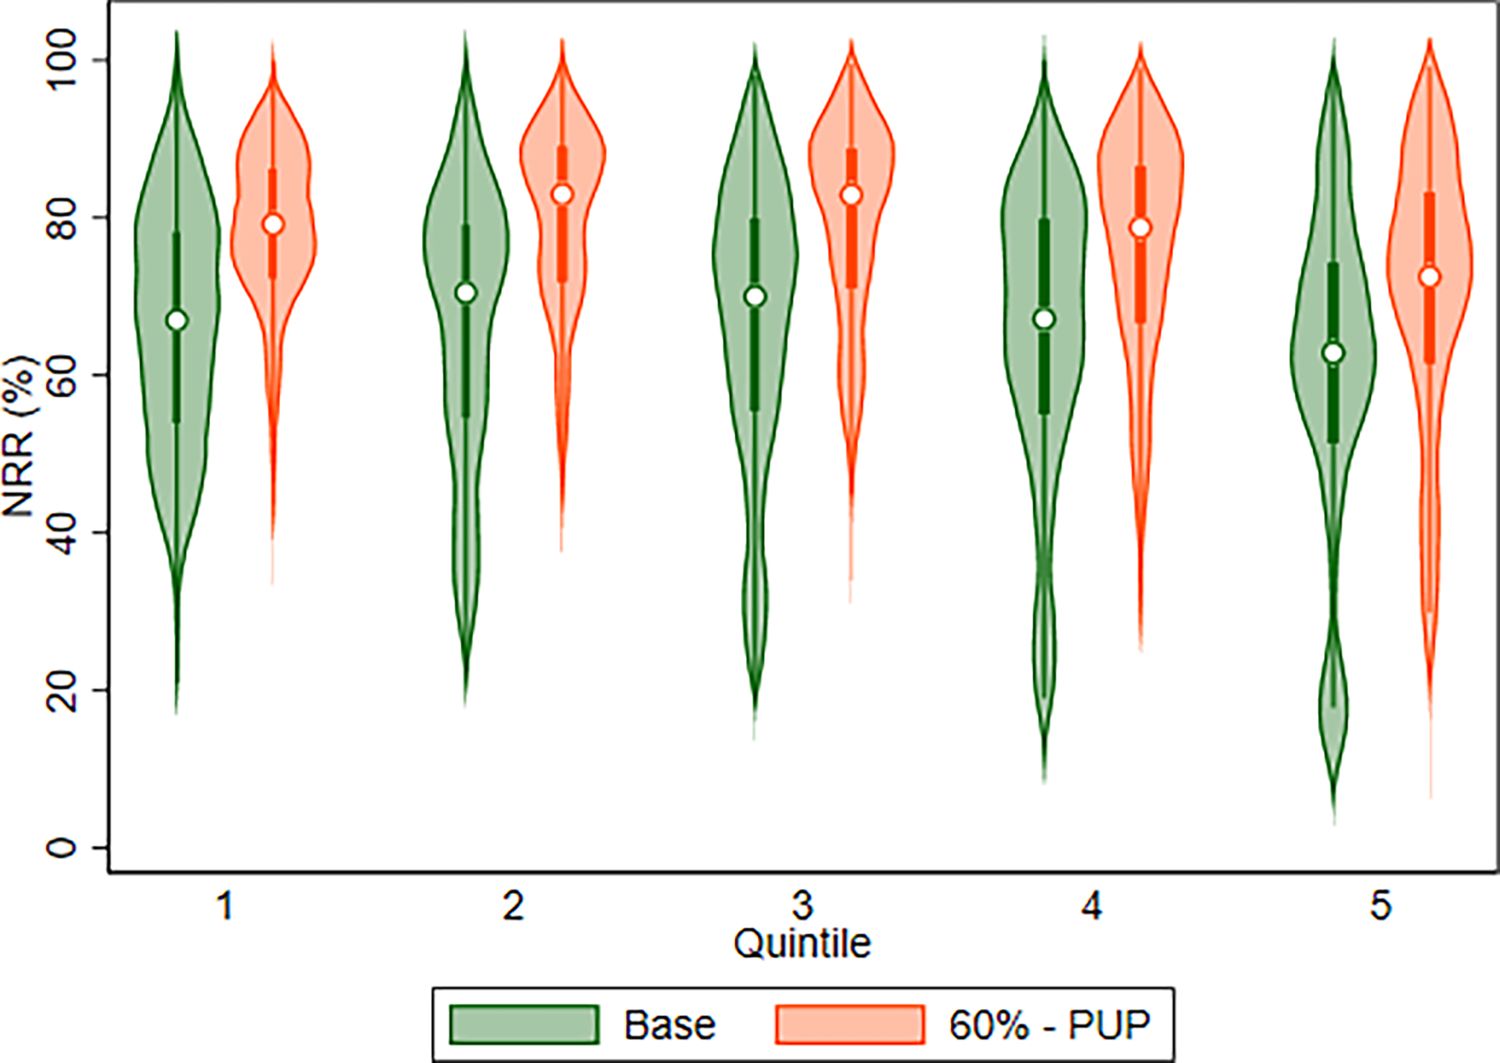
Net Replacement rate, Baseline and Reform Scenario.

Participation Tax Rate by quintile, Baseline and Reform Scenario.

Reform 1 baseline versus 60% of previous earnings with maximum caps based on PUP rates

Net Replacemet Rates, Reform 1 baseline versus 60% of previous earnings with maximum caps based on PUP rates
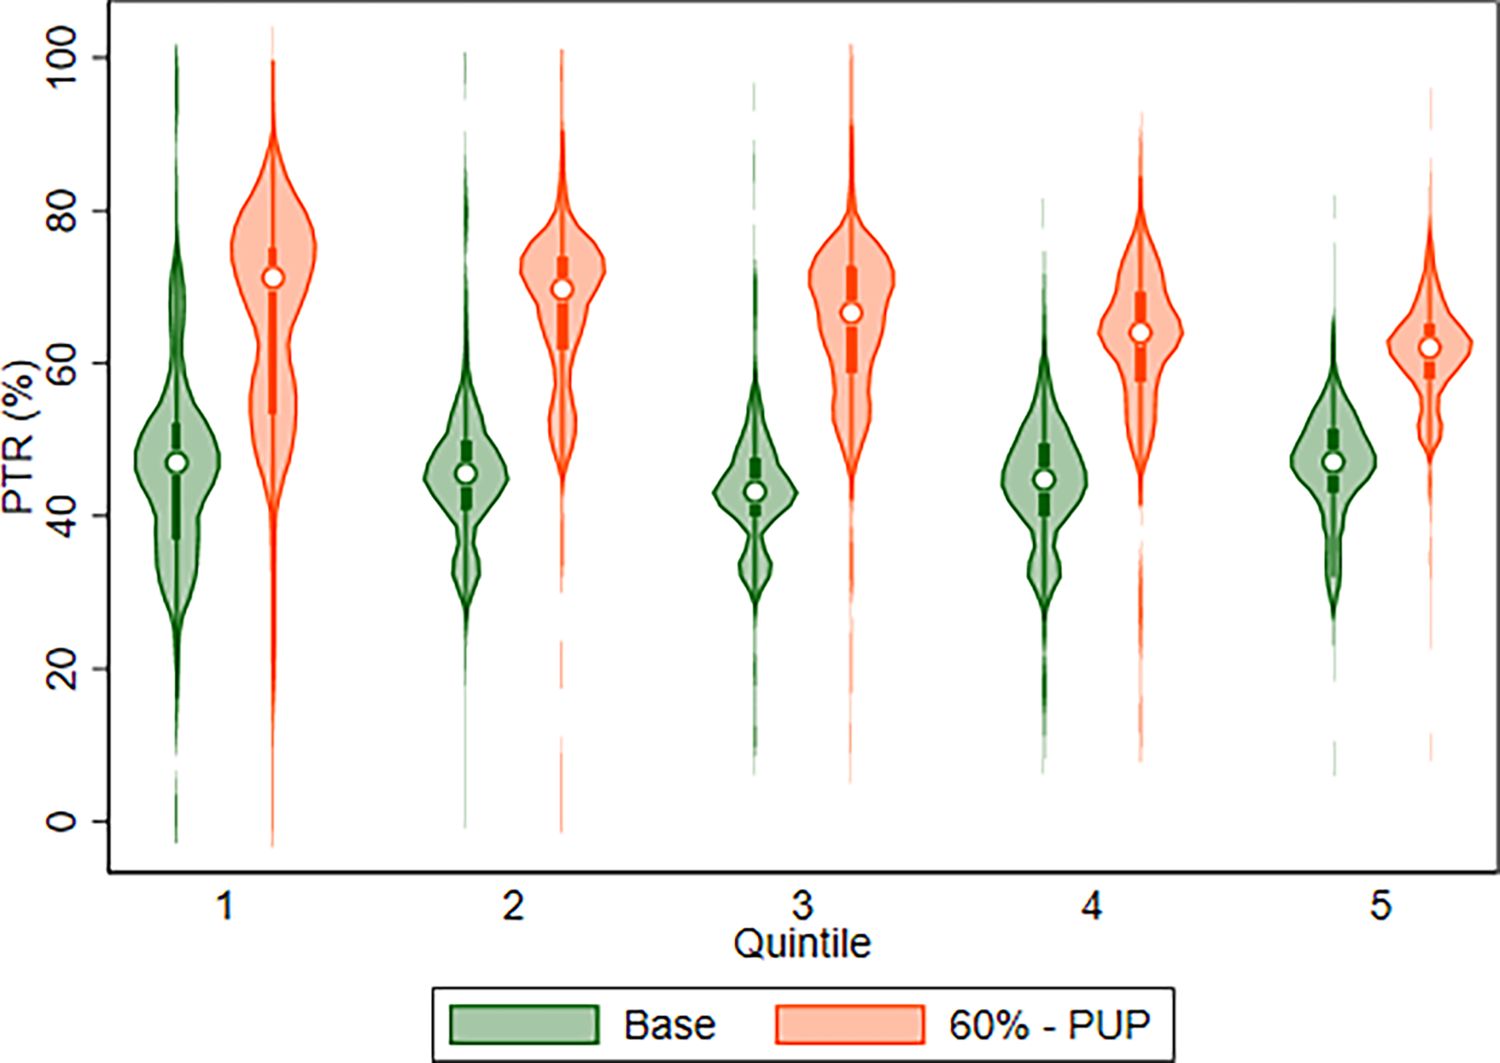
Participation Tax Rates, Reform 1 baseline versus 60% of previous earnings with maximum caps based on PUP rates
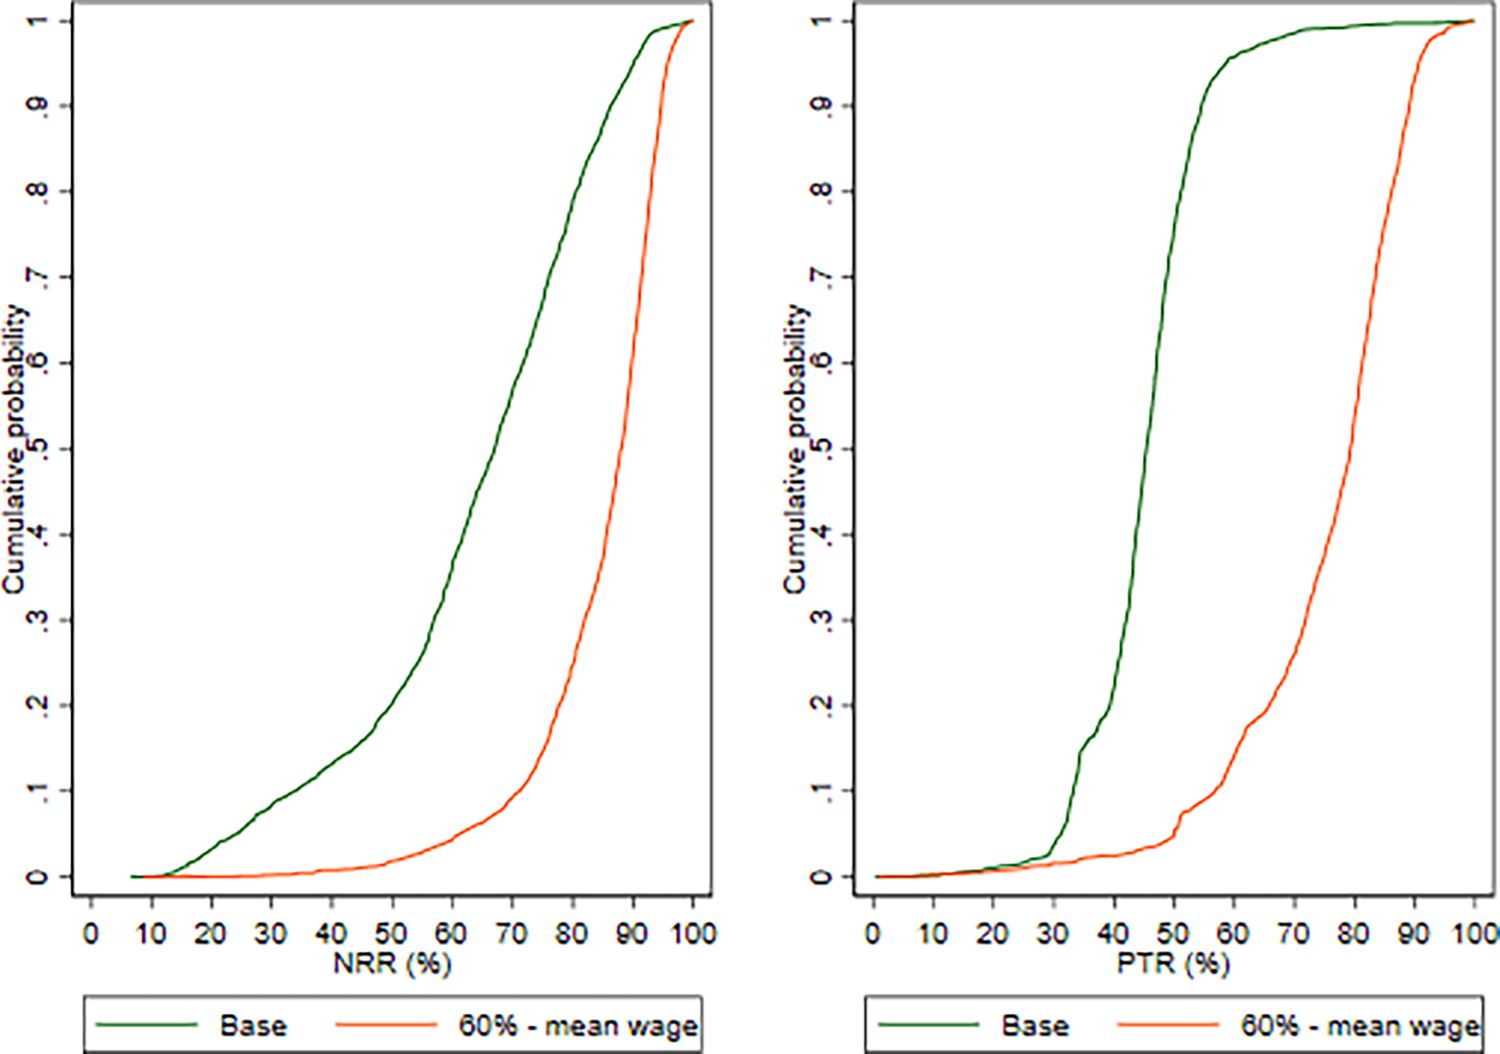
Reform 2: baseline versus 60% of previous earnings with maximum cap set at 60% of mean wage
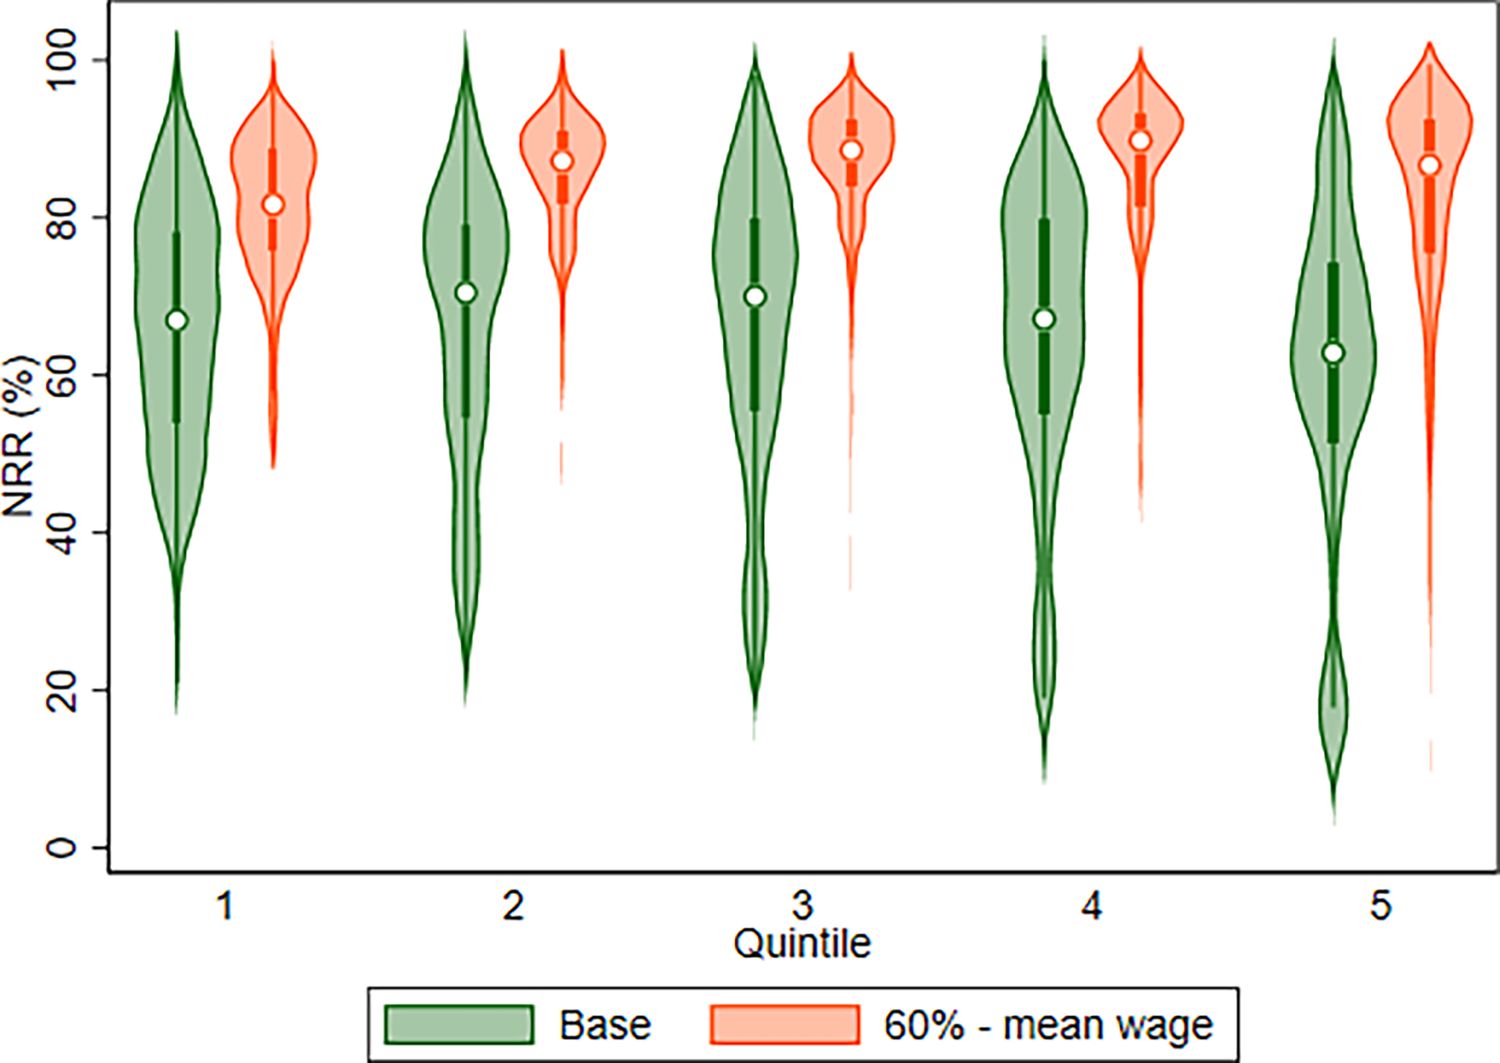
Net Replacement Rates, Reform 2: baseline versus 60% of previous earnings with maximum cap set at 60% of mean wage.
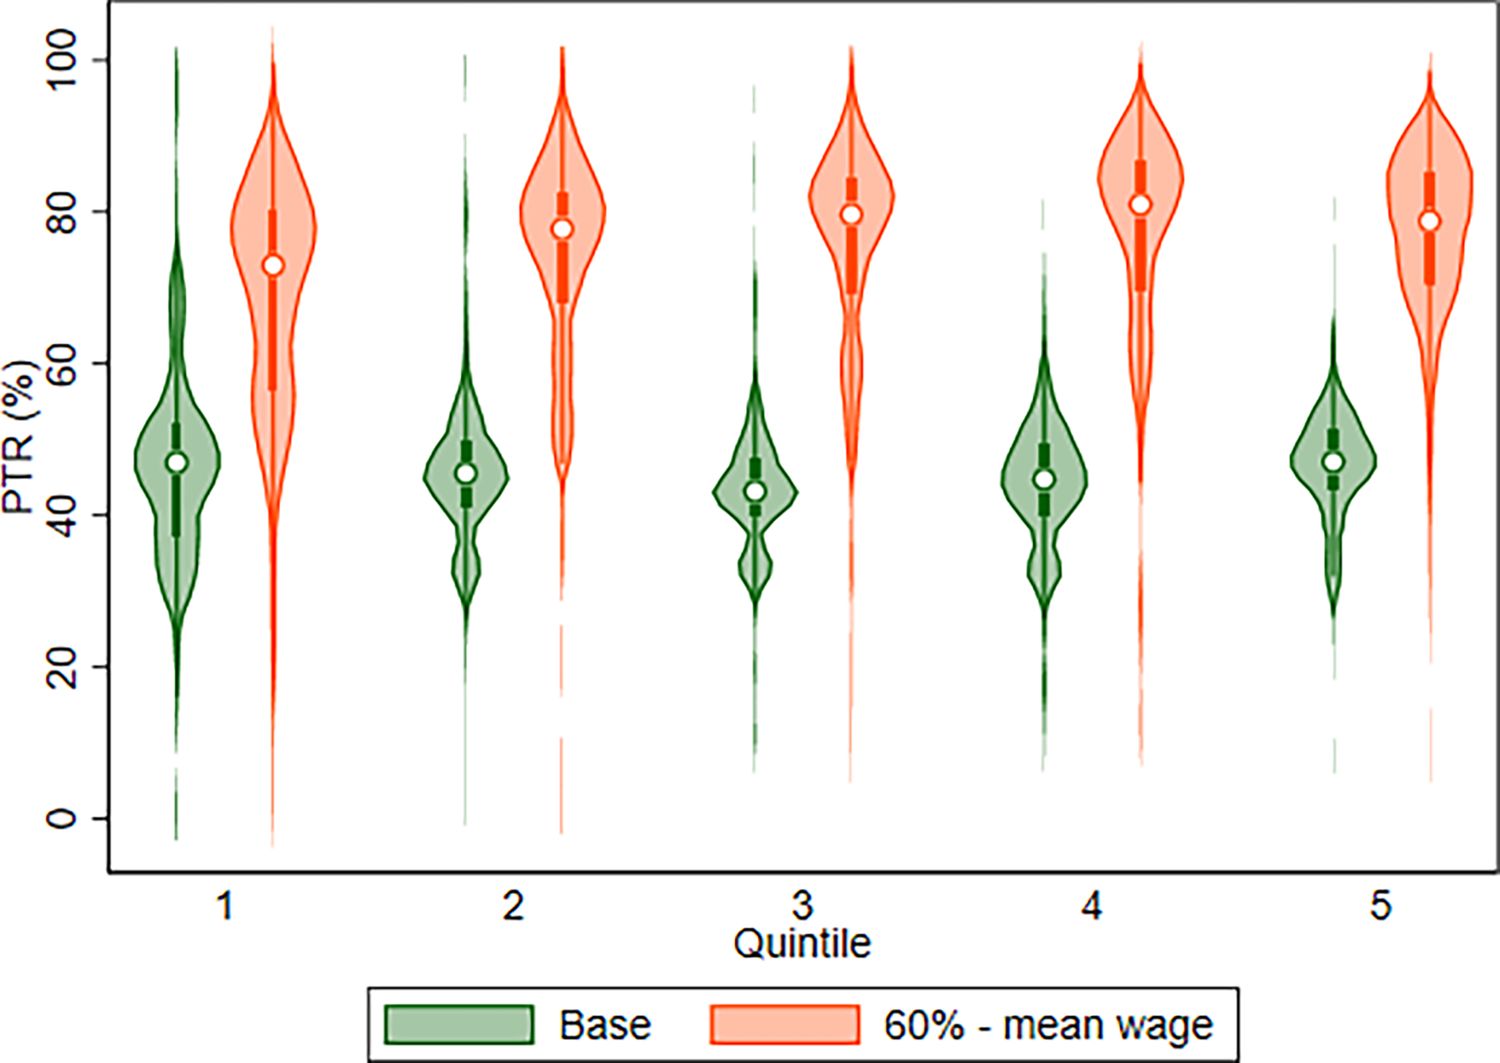
Participation Tax Rates, Reform 2: baseline versus 60% of previous earnings with maximum cap set at 60% of mean wage.
Reform 3: baseline versus 70% of previous earnings with maximum caps based on PUP rates.

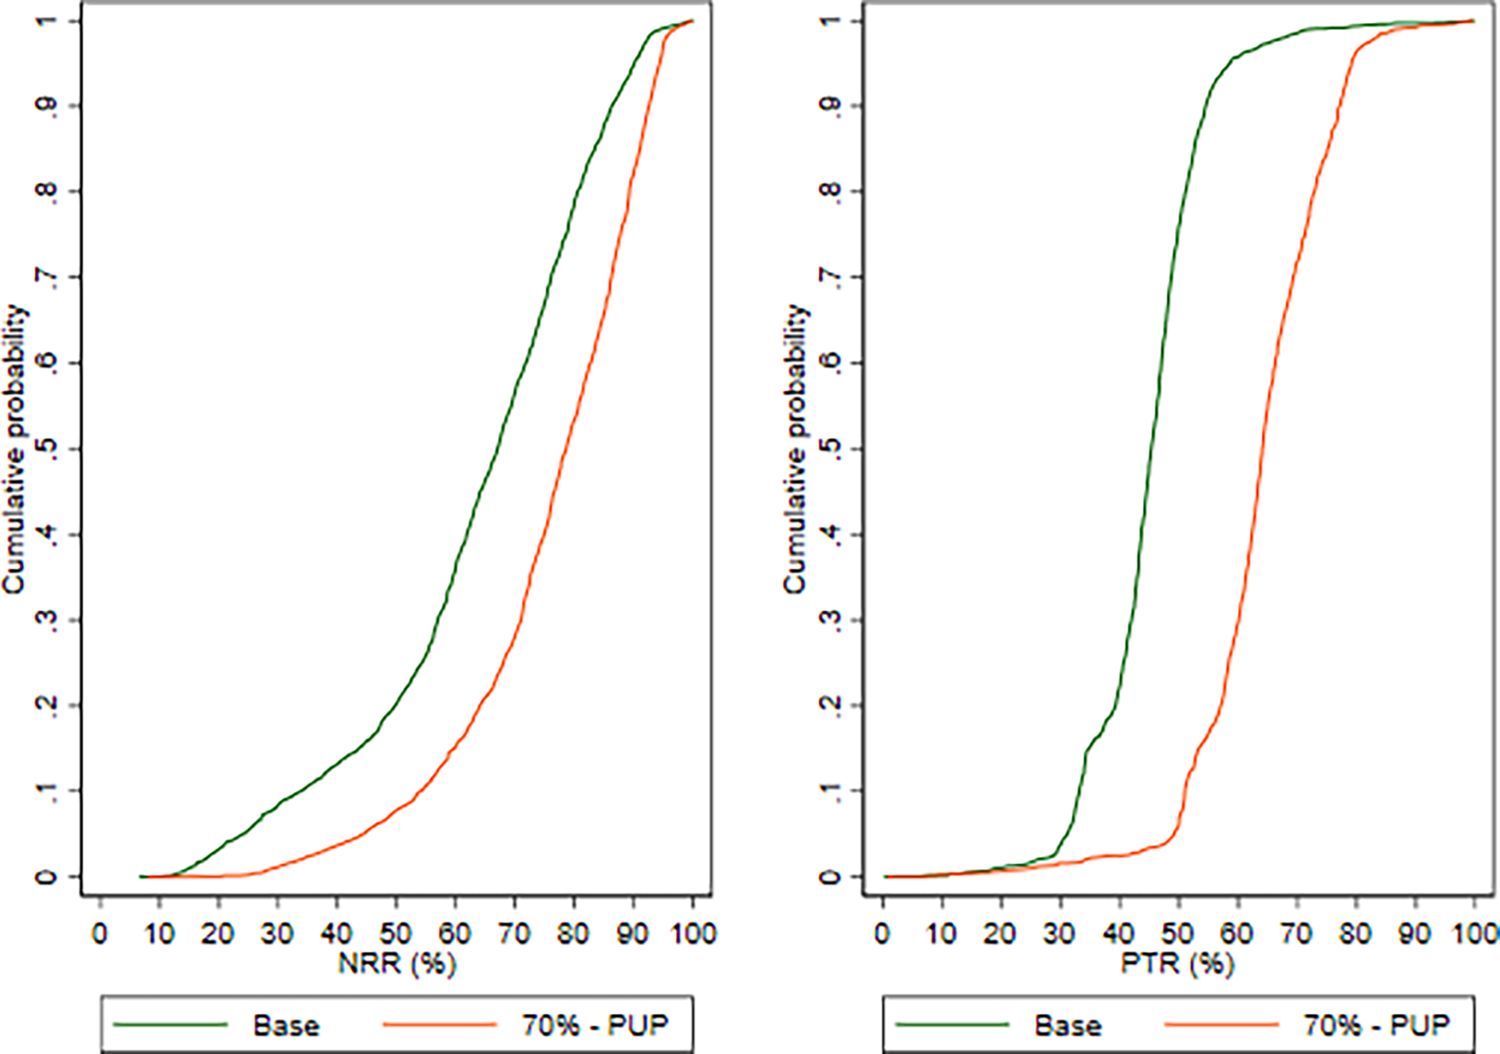
Net Replacement Rates, Reform 3: baseline versus 70% of previous earnings with maximum caps based on PUP rates.
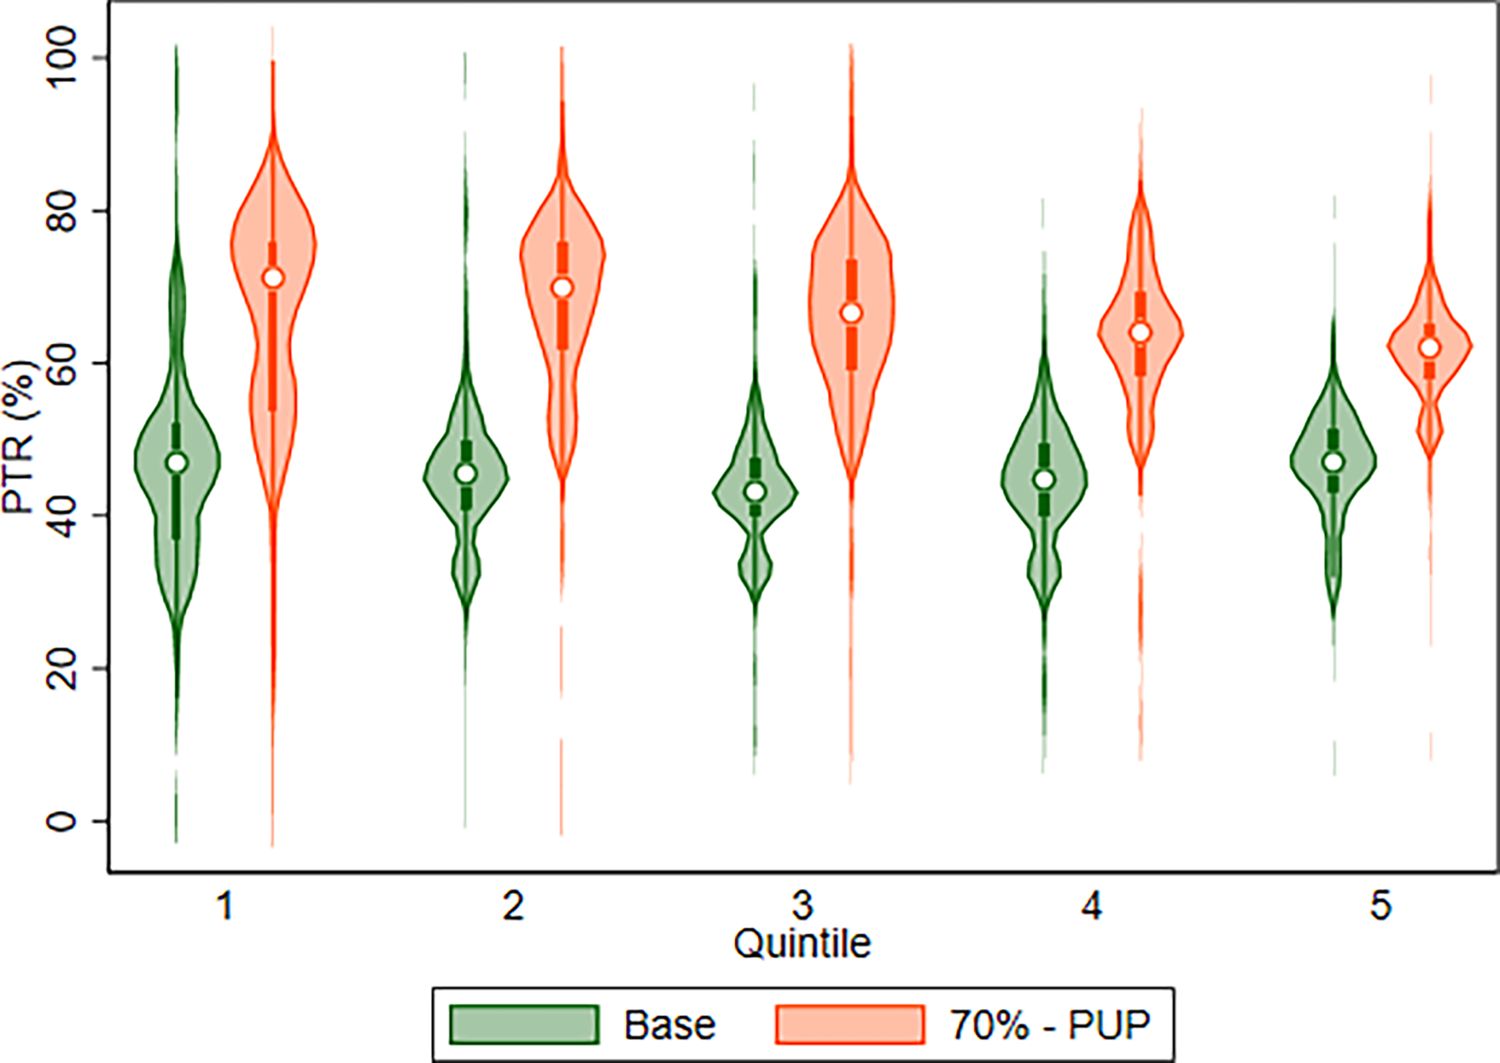
Participation Tax Rates, Reform 3: baseline versus 70% of previous earnings with maximum caps based on PUP rates.
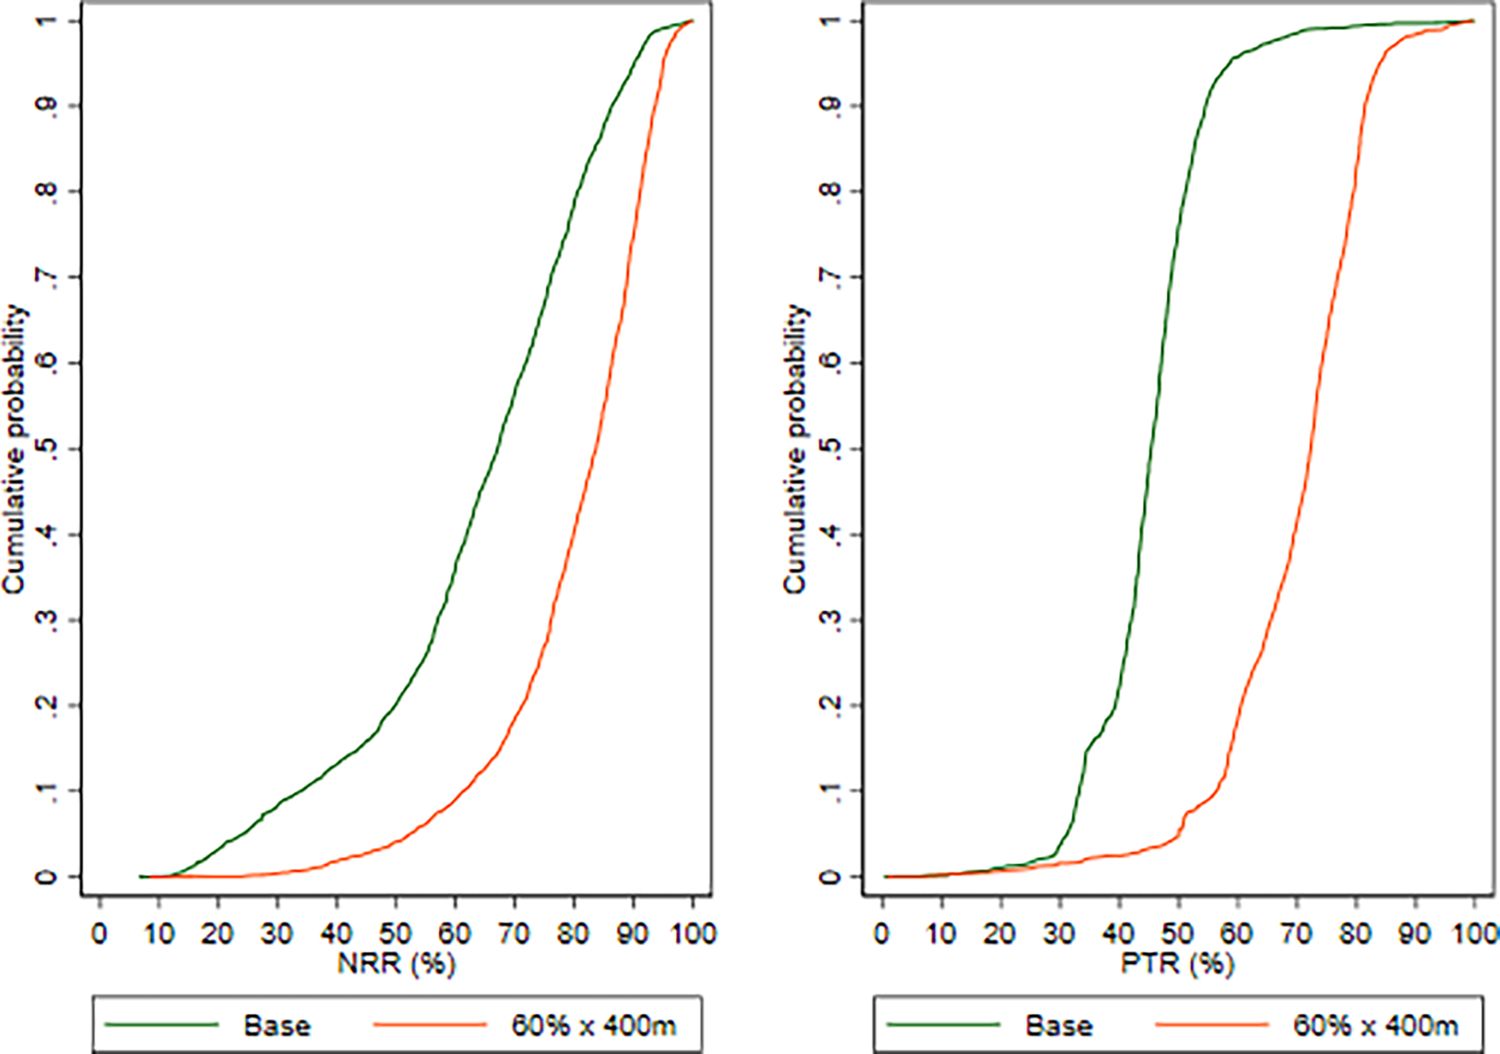
Reform 4: baseline versus 60% of previous earnings with maximum cap set at 43% of mean earnings (to give cost of c. €400m).
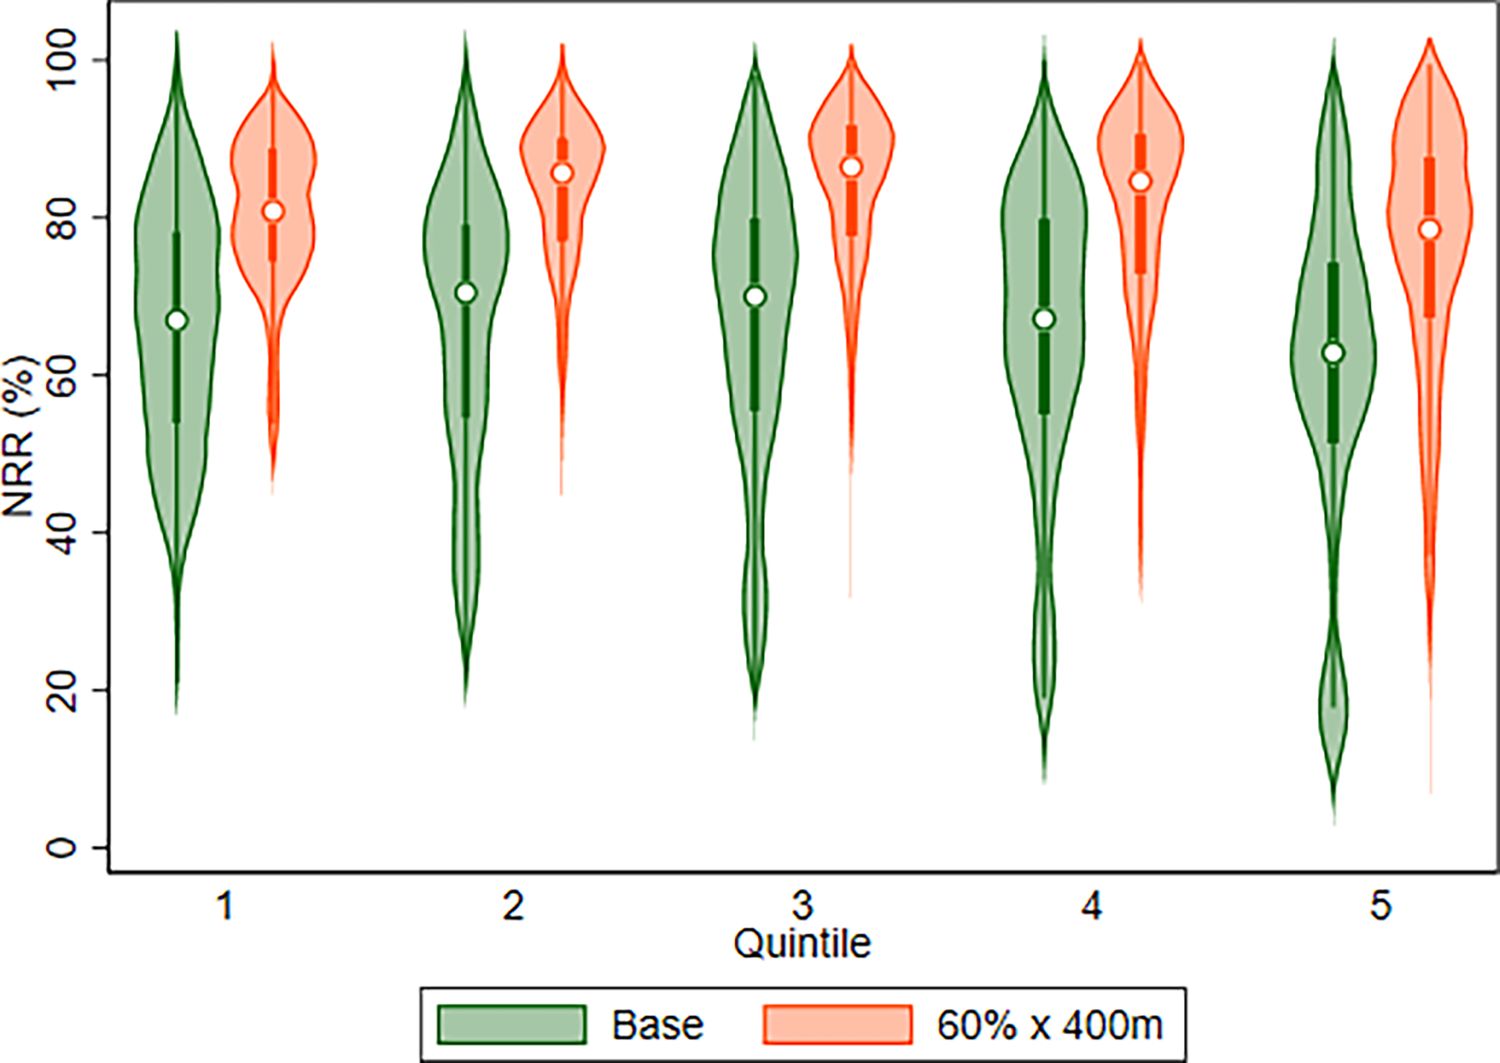
Net replacement rates, Reform 4: baseline versus 60% of previous earnings with maximum cap set at 43% of mean earnings (to give cost of c. €400m).
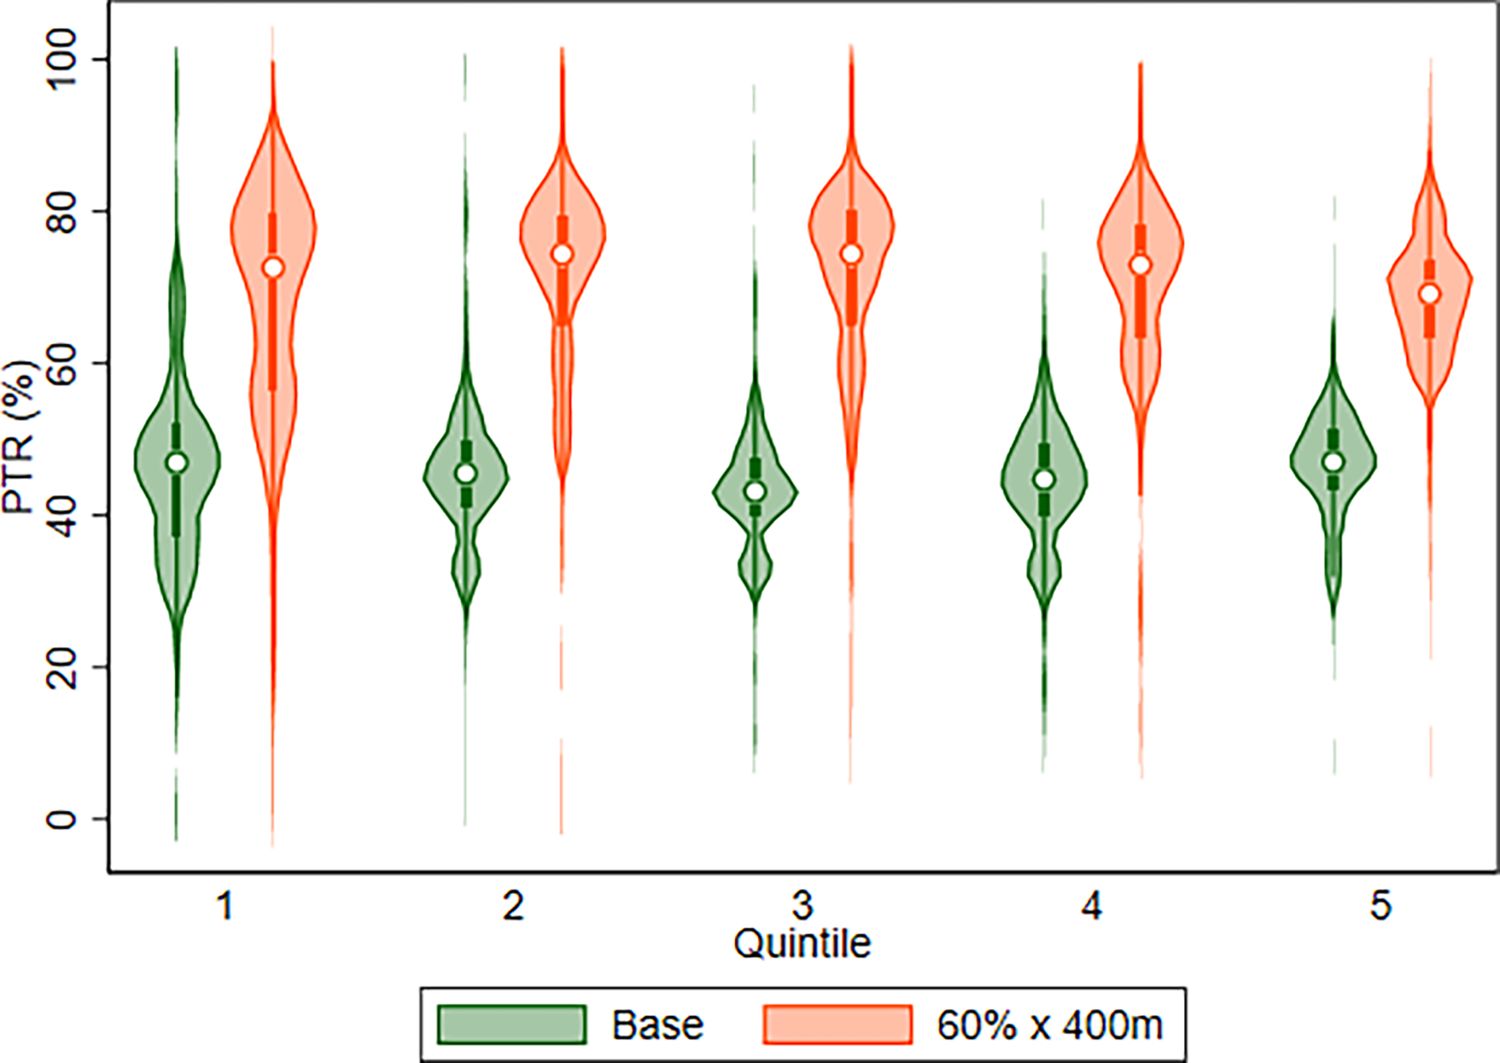
Participation tax rates, Reform 4: baseline versus 60% of previous earnings with maximum cap set at 43% of mean earnings (to give cost of c. €400m).
Tables
Income inequality, poverty and additional spending required.
| Baseline | Reform Scenario | Difference | |
|---|---|---|---|
| Gini | 0.2782 | 0.2773 | -0.001 pp |
| Poverty – Whole population | 13.63% | 13.57% | -0.06 pp |
| Poverty – Working age adult population | 13.31% | 13.24% | -0.07 pp |
| Elderly poverty* | 12.20% | 12.18% | -0.02 pp |
| Children poverty | 15.77% | 15.68% | -0.09 pp |
| Fiscal cost | €348 million | €626 million | €278 milion |
-
Note: Authors calculations using the SWITCH v4.6 tax-benefit system for 2019 linked to SILC 2019. Assessment units are defined as being at risk of poverty (poor) if their equivalised disposable income is below the poverty line. The poverty line is defined as 60% of the median equivalised disposable income of the baseline scenario. The CSO equivalence scale is used, which attributes a weight of 1 to the head of the unit, a weight of 0.66 to every person above the age of 13 and a weight of 0.33 to every child aged 0-13. Table B5 in the Appendix provides the income inequality and poverty rates for each of the 4 scenarios.
-
*
Changes in the elderly poverty rate are due to a small number of observations and thus should be read with caution.
Work incentives.
| Scenario | Reform | Median NRR (%) | Share with NRR > 70% (%) | Median PTR (%) | Share with PTR > 70% (%) |
|---|---|---|---|---|---|
| Baseline | Baseline | 67 | 43 | 45 | 1 |
| 1 | Reform scenario | 78 | 71 | 64 | 28 |
-
Source: Authors’ estimates using the SWITCH model and data from the 2019 SILC. Results for the 4 scenarios can be found in Table B4 at the Appendix.
Median Replacement Rate.
| Income quintile | Baseline (%) | Reform (%) | pp change |
|---|---|---|---|
| Poorest | 67 | 79 | 12 |
| 2 | 71 | 83 | 12 |
| 3 | 70 | 83 | 13 |
| 4 | 67 | 79 | 12 |
| Richest | 63 | 73 | 10 |
-
Source: Authors’ calculations using SWITCH and data from the 2019 SILC. Table B6 at the Appendix presents the Median RR for the rest of the reforms.
Median Participation Tax Rate.
| Income quintile | Baseline (%) | Reform (%) | pp change |
|---|---|---|---|
| Poorest | 47 | 71 | 24 |
| 2 | 46 | 70 | 24 |
| 3 | 43 | 67 | 24 |
| 4 | 45 | 64 | 19 |
| Richest | 47 | 62 | 15 |
-
Source: Authors’ calculations using SWITCH and data from the 2019 SILC. Table B7 at the Appendix presents the median PTR for the rest of the reform.
Share of individuals with Net Replacement Rate greater than 70 per cent
| All employees | Part-time employees | Full-time employees | |||||||
|---|---|---|---|---|---|---|---|---|---|
| Income quintile | Baseline (%) | Reform (%) | pp change | Baseline (%) | Reform (%) | pp change | Baseline (%) | Reform (%) | pp change |
| Poorest | 45 | 84 | 39 | 62 | 90 | 28 | 33 | 80 | 47 |
| 2 | 52 | 80 | 28 | 87 | 95 | 8 | 37 | 75 | 38 |
| 3 | 50 | 76 | 26 | 86 | 95 | 9 | 35 | 71 | 36 |
| 4 | 44 | 70 | 26 | 71 | 85 | 14 | 40 | 69 | 29 |
| Richest | 32 | 60 | 28 | 85 | 92 | 7 | 29 | 58 | 29 |
-
Source: Authors’ calculations using SWITCH and data from the 2019 Survey on Income and Living Conditions (SILC). The number of individuals in each quintile, split by part-time and full-time employees, and the average wage by quintile can be found in Table B2 and Table B3 at the Appendix respectively.
Share of individuals with Participation Tax Rate greater than 70 per cent.
| All employees | Part-time employees | Full-time employees | |||||||
|---|---|---|---|---|---|---|---|---|---|
| Income quintile | Baseline (%) | Reform (%) | pp change | Baseline (%) | Reform (%) | pp change | Baseline (%) | Reform (%) | pp change |
| Poorest | 6 | 53 | 47 | 12 | 50 | 38 | 4 | 58 | 54 |
| 2 | 3 | 50 | 47 | 11 | 62 | 51 | 4 | 50 | 46 |
| 3 | 2 | 38 | 36 | 5 | 57 | 52 | 2 | 35 | 33 |
| 4 | 0.6 | 21 | 20.4 | 1 | 40 | 39 | 1 | 21 | 20 |
| Richest | 0.2 | 9 | 8.8 | 2 | 40 | 38 | 0.2 | 8 | 7.8 |
-
Source: Authors’ calculations using SWITCH and data from the 2019 SILC.
Weekly Pandemic Unemployment Payment rates.
| Previous weekly income (Y) | Weekly PUP payment |
|---|---|
| Y < €150 | €150 |
| €150 ≤ Y < €220 | €203 |
| €220 ≤ Y < €300 | €250 |
| €300 ≤ Y < €400 | €300 |
| Y ≥ €400 | €350 |
-
Source: Rates from October 2020, see https://www.gov.ie/en/publication/0b0fc-covid-19-pandemic-unemployment-payment-rates/#rates-from-7-september-2021.
Unemployment Benefit Reforms.
| No. | Reform |
|---|---|
| 1 | 60% of previous earnings – maximum caps based on PUP rates |
| 2 | 60% of previous earnings – maximum cap set at 60% of mean daily earnings |
| 3 | 70% of previous earnings – maximum caps based on PUP rates |
| 4 | 60% of previous earnings – maximum cap set at 43% of mean daily earnings |
Number of employees by household quintile and employment type.
| Income quintile | All employees | Part-time employees | Full-time emploees |
|---|---|---|---|
| Poorest | 180,267 | 80,714 | 99,552 |
| 2 | 338,642 | 100,951 | 237,691 |
| 3 | 459,839 | 123,837 | 336,001 |
| 4 | 503,762 | 64,397 | 439,365 |
| Richest | 578,028 | 35,171 | 542,857 |
-
Source: Authors’ calculations using SWITCH and data from the 2019 SILC.
Average monthly wage by quintile (€).
| Income quintile | All employees | Part-time employees | Full-time emploees |
|---|---|---|---|
| Poorest | 1,994 | 1,269 | 2,581 |
| 2 | 2,562 | 1,419 | 3,047 |
| 3 | 2,973 | 1,611 | 3,476 |
| 4 | 4,076 | 2,269 | 4,341 |
| Richest | 5,753 | 3,369 | 5,972 |
-
Source: Authors’ calculations using SWITCH and data from the 2019 SILC.
Work incentives and additional spending required.
| No | Reform | Median NRR (%) | Share with NRR > 70% (%) | Median PTR (%) | Share with PTR > 70% (%) | Additional spending (€) |
|---|---|---|---|---|---|---|
| Baseline | Baseline | 67 | 43 | 45 | 1 | n/a |
| 1 | Reform scenario | 78 | 71 | 64 | 28 | 278m |
| 2 | RR: 60% Cap: 60% mean earnings | 88 | 91 | 79 | 74 | 588m |
| 3 | RR: 70% Cap: PUP | 79 | 72 | 64 | 28 | 285m |
| 4 | RR: 60% Cap: 43% mean earnings | 84 | 81 | 72 | 59 | 399m |
-
Source: Authors’ calculations using SWITCH and data from the 2019 SILC.
Income inequality and poverty.
| Gini | Poverty – Whole population | Poverty – Working age adult population | Elderly poverty* | Children poverty | |
|---|---|---|---|---|---|
| Baseline 2022 | 0.278 | 13.63% | 13.31% | 12.20% | 15.77% |
| Reform 1 | 0.277 | 13.57% | 13.24% | 12.18% | 15.68% |
| Reform 2 | 0.277 | 13.39% | 13.04% | 11.85% | 15.35% |
| Reform 3 | 0.277 | 13.57% | 13.24% | 12.18% | 15.68% |
| Reform 4 | 0.277 | 13.42% | 13.08% | 11.85% | 15.41% |
-
Source: Authors’ calculations using SWITCH and data from the 2019 SILC.
-
*
Changes in the elderly poverty rates are driven by a small number of observations and thus should be read with caution.
Median Replacement Rate, Reform 2-4.
| Income quintile | Baseline (%) | Reform 2 | Reform 3 | Reform 4 | |||
|---|---|---|---|---|---|---|---|
| NRR (%) | pp change | NRR (%) | pp change | NRR (%) | pp change | ||
| Poorest | 67 | 82 | 15 | 80 | 13 | 81 | 14 |
| 2 | 71 | 88 | 17 | 84 | 13 | 86 | 15 |
| 3 | 70 | 89 | 19 | 84 | 14 | 86 | 17 |
| 4 | 67 | 90 | 23 | 79 | 12 | 84 | 18 |
| Richest | 63 | 87 | 24 | 73 | 10 | 78 | 16 |
-
Source: Authors’ calculations using SWITCH and data from the 2019 SILC.
Participation Tax Rate, Reform 2-4.
| Income quintile | Baseline (%) | Reform 2 | Reform 3 | Reform 4 | |||
|---|---|---|---|---|---|---|---|
| PTR (%) | pp change | PTR (%) | pp change | PTR (%) | pp change | ||
| Poorest | 47 | 73 | 26 | 72 | 25 | 73 | 26 |
| 2 | 46 | 78 | 32 | 71 | 25 | 76 | 30 |
| 3 | 43 | 80 | 37 | 67 | 24 | 75 | 32 |
| 4 | 45 | 81 | 36 | 64 | 19 | 73 | 28 |
| Richest | 47 | 79 | 32 | 62 | 15 | 69 | 22 |
-
Source: Authors’ calculations using SWITCH and data from the 2019 SILC.
Data and code availability
The SWITCH model is based on the EUROMOD platform, available at https://euromod-web.jrc.ec.europa.eu/. We are happy to provide the front-end of the model upon request but due to restrictions imposed to us by the Irish Central Statistics Office, who provide the underlying data for the model, we cannot provide the input dataset the SWITCH model runs on. Only those appointed Officer of Statistics for the underlying data can access it and this is restricted to those residents in Ireland.
We are committed of preserving the data and model for a period of no less than five years following publication of the manuscript, and to providing reasonable assistance to requests for clarification and replication.