Economy-Wide Effect of Fiscal Drag in Ethiopia
- Adnan Abdulaziz Shahir: University of Bologna, Italy
- Francesco Figari: University of Eastern Piedmont, Italy
- Solomon Tsehay Feleke: Addis Ababa University, Ethiopia
Figures
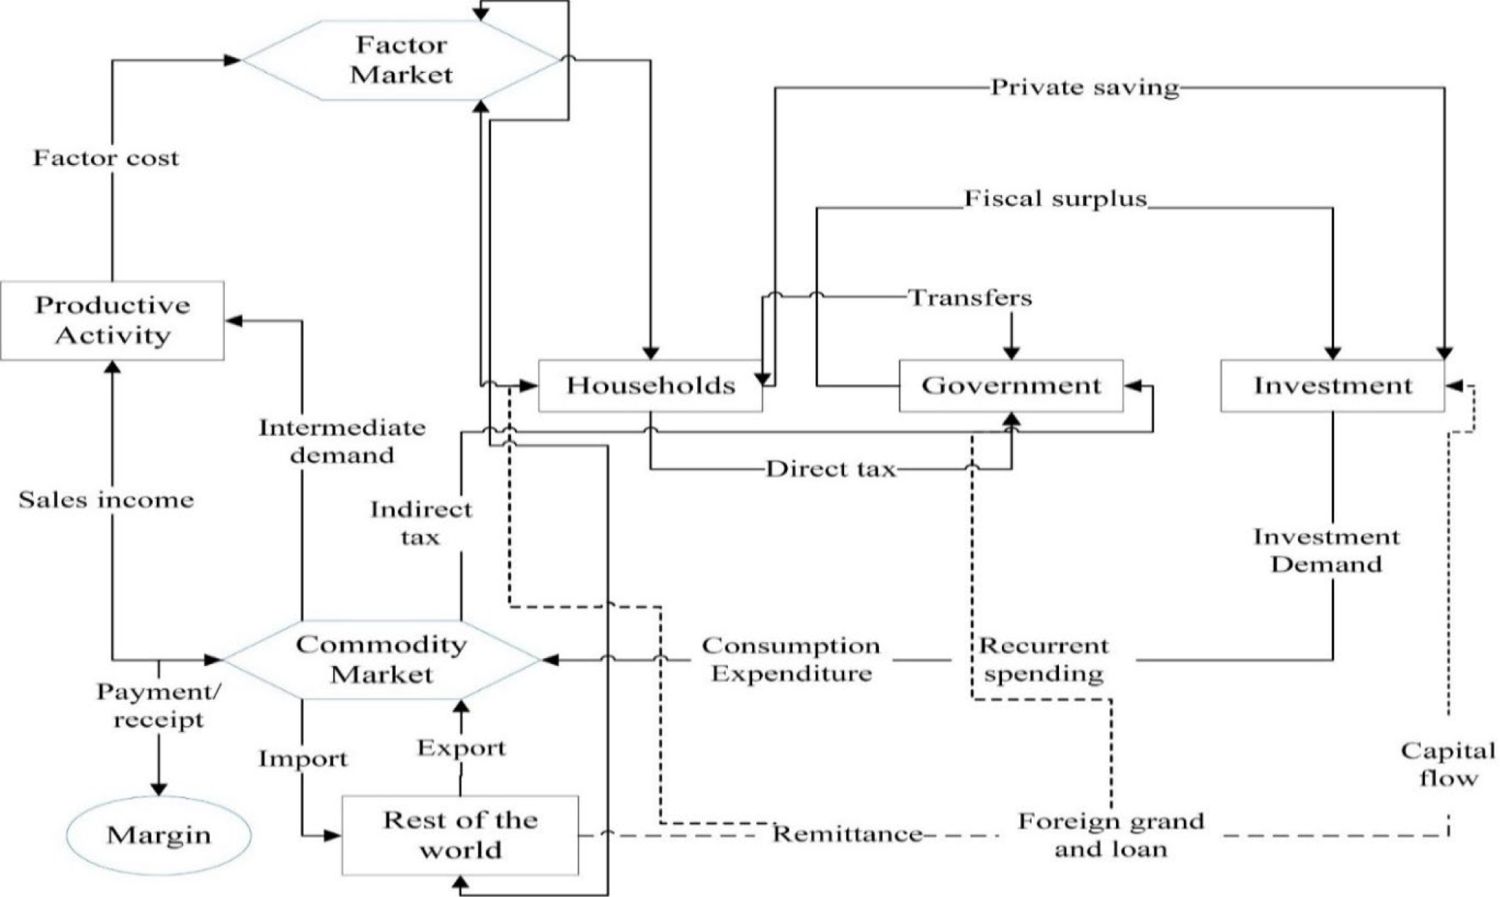
Circular flow diagram. Source: Own elaboration.

Trend of direct tax in Ethiopia. Source: Own computation.
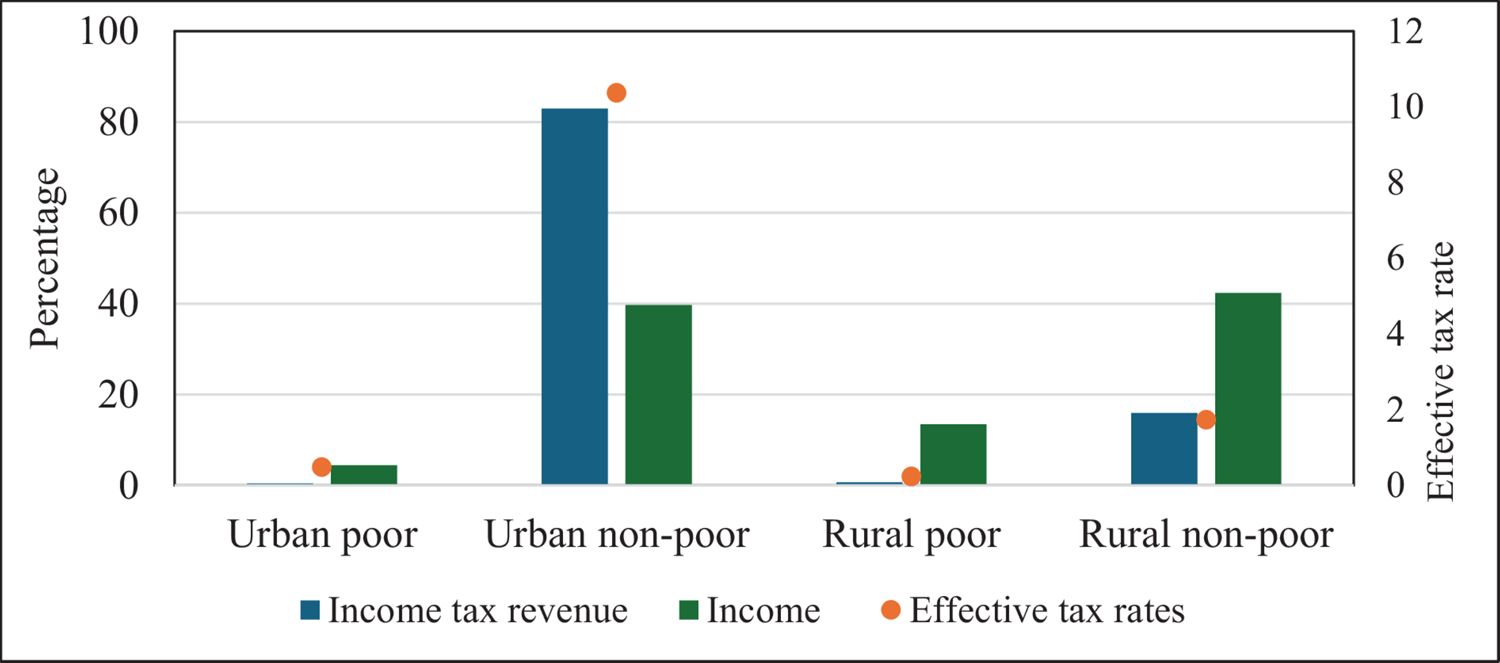
Income tax revenue, income, and effective tax rates by household types. Source: Own computation.

Bottom-up approach. Source: Adapted from Bourguignon and Bussolo (2013).

Production technology. Source: Own elaboration.
Tables
Percentage change in household consumption and income.
| Household types | Household consumption | Household income |
|---|---|---|
| Urban poor | 1.31 | -0.06 |
| Urban non-poor | -0.75 | -0.08 |
| Rural poor | 0.70 | 0.16 |
| Rural non-poor | 0.33 | 0.07 |
-
Source: Own computation.
Share of consumption and changes in household consumption and production.
| Item | Share of consumption by urban non-poor | Household consumption expenditure | Production | |||
|---|---|---|---|---|---|---|
| Urban Poor | Urban non-poor | Rural poor | Rural non-poor | |||
| Grain | 20.65 | 0.16 | - 0.09 | 0.38 | 0.18 | 0.14 |
| Livestock | 28.92 | 1.67 | -0.95 | 0.87 | 0.40 | 0.10 |
| Hotel | 41.58 | 1.86 | -1.01 | 0.63 | 0.30 | -0.13 |
| Forest | 18.53 | 2.06 | -1.13 | 1.26 | 0.59 | 0.37 |
| Agro-processing | 25.39 | 0.16 | -0.09 | 0.38 | 0.18 | 0.14 |
| Other service | 60.88 | 1.87 | -1.00 | 0.64 | 0.31 | -0.14 |
| Real estate | 63.86 | 1.88 | -0.99 | 0.65 | 0.32 | -0.34 |
| Transport | 52.93 | 1.87 | -1.00 | 0.64 | 0.31 | 0.13 |
| Alcohol | 53.91 | 0.17 | -0.09 | 0.39 | 0.19 | 0.06 |
| Textile | 27.11 | 0.92 | -0.50 | 0.88 | 0.42 | 0.31 |
-
Source: Own computation.
Percentage change in factor demand by selected activities.
| Items | Agricultural labor | Non-irrigated land | Irrigated land | Agricultural capital | Semi-skilled labor | Skilled labor | Other capital |
|---|---|---|---|---|---|---|---|
| Grain | 0.17 | 0.19 | 0.22 | ||||
| Livestock | 0.20 | 0.04 | |||||
| Hotel | -0.11 | -0.10 | -0.07 | ||||
| Forest | 0.40 | 0.23 | |||||
| Agro-processing | 0.16 | 0.18 | 0.21 | ||||
| Other services | -0.15 | -0.13 | -0.11 | ||||
| Real estate | -0.38 | -0.37 | -0.34 | ||||
| Transport | 0.12 | 0.14 | 0.16 | ||||
| Alcohol | 0.03 | 0.04 | 0.07 | ||||
| Textile | 0.28 | 0.30 | 0.33 |
-
Source: Own computation.
Macroeconomic effects of an increase in the income tax rate.
| Real GDP | 0.04 |
|---|---|
| Real domestic production | 0.04 |
| Real household consumption | 0.03 |
| Real domestic final demand | 0.02 |
| Real import | -0.05 |
| Real export | 0.03 |
| Real intermediate input | 0.05 |
-
Source: Own computation.
Effects of an increase in the income tax rate on government income and expenditure.
| Direct tax | 9.05 |
|---|---|
| Import tax | -0.02 |
| Sales tax | -0.11 |
| VAT | -0.38 |
| Excise tax | -0.04 |
| Government income | 2.89 |
| Government expenditure | -0.08 |
| Government savings | 6.91 |
-
Source: Own computation.
Balanced Macro SAM for the year 2015/16.
| Activity | Commodity | Margin | Factor | Household | Tax | Govt | Kapital | World | Total | |||||||||||||
|---|---|---|---|---|---|---|---|---|---|---|---|---|---|---|---|---|---|---|---|---|---|---|
| Agri | Indus | Service | Agri | Indus | Service | Labor | Land | Capital | Urban | Rural | direct | Indirect | ||||||||||
| Activity | Agri | 649 | 649 | |||||||||||||||||||
| Indus | 1,124 | 1,124 | ||||||||||||||||||||
| Service | 806 | 806 | ||||||||||||||||||||
| Commodity | Agri | 48 | 320 | 65 | 89 | 199 | 10 | 48 | 779 | |||||||||||||
| Indus | 46 | 365 | 114 | 201 | 342 | 0 | 531 | 13 | 1,613 | |||||||||||||
| service | 4 | 77 | 125 | 172 | 169 | 138 | 166 | 0 | 67 | 917 | ||||||||||||
| Margin | 98 | 70 | 4 | 172 | ||||||||||||||||||
| Factor | Labor | 357 | 221 | 333 | 911 | |||||||||||||||||
| Land | 20 | 20 | ||||||||||||||||||||
| Capital | 174 | 142 | 168 | 483 | ||||||||||||||||||
| Household | Urban | 468 | 0 | 150 | 1 | 66 | 686 | |||||||||||||||
| Rural | 443 | 20 | 333 | 2 | 70 | 868 | ||||||||||||||||
| Tax | Direct | 60 | 12 | 72 | ||||||||||||||||||
| Indirect | 82 | 33 | 115 | |||||||||||||||||||
| Govt | 45 | 72 | 115 | 30 | 262 | |||||||||||||||||
| Kapital | 123 | 176 | 92 | 150 | 541 | |||||||||||||||||
| World | 32 | 338 | 74 | 445 | ||||||||||||||||||
| Total | 649 | 1,124 | 806 | 779 | 1,613 | 917 | 172 | 911 | 20 | 483 | 686 | 868 | 72 | 115 | 262 | 541 | 445 | |||||
-
Source: Own computation.
Percentage change in Factor prices.
| Non-irrigated land | Irrigated land | Agricultural capital | Semi-skilled labor | Skilled labor | Other capital |
|---|---|---|---|---|---|
| 0.27 | 1.83 | 0.20 | -0.07 | -0.07 | -0.12 |
-
Source: Model simulation results.
Percentage distribution of household income by factor types.
| Factor types | Urban poor | Urban nonpoor | Rural poor | Rural nonpoor |
|---|---|---|---|---|
| Agricultural labor | 2.37 | 0.15 | 94.54 | 28.12 |
| Non-irrigated land | 0.16 | 0.04 | 5.23 | 1.08 |
| Irrigated land | 0.23 | 0.45 | ||
| Agricultural capital | 1.07 | 0.06 | 28.84 | |
| Semi-skilled labor | 41.39 | 47.22 | ||
| Skilled labor | 55.01 | 25.43 | 14.83 | |
| Other capital | 27.10 | 26.68 |
-
Source: Model simulation results.
Percentage change in unemployment.
| Unemployment in agricultural labor |
|---|
| -8.24 |
-
Source: Model simulation results.
List of main Account of the 2015/16 SAM for Ethiopia.
| Activities | Commodities | Factors | Households | Taxes | ||||
|---|---|---|---|---|---|---|---|---|
|
|
|
|
|
|
|
|
|
-
Source: Own compilation.
Income elasticities for Ethiopia.
| Commodities | Urban poor household | Urban non-poor household | Rural poor household | Rural non-poor household |
|---|---|---|---|---|
| Teff | 1.14 | 1.14 | 1.08 | 1.08 |
| Barley | 0.33 | 0.33 | 0.06 | 0.06 |
| Wheat | 0.41 | 0.41 | 0.42 | 0.42 |
| Maize | 0.58 | 0.58 | 0.62 | 0.62 |
| Sorghum | - 0.81 | - 0.81 | 1.00 | 1.00 |
| Finger millet | - 0.81 | -0.81 | 1.00 | 1.00 |
| Oats | 0.33 | 0.33 | 0.64 | 0.64 |
| Rice | 0.13 | 0.13 | 0.64 | 0.64 |
| Horse beans | 0.87 | 0.87 | 1.13 | 1.13 |
| Peas | 0.87 | 0.87 | 1.13 | 1.13 |
| Haricot beans | 0.87 | 0.87 | 1.13 | 1.13 |
| Lentils | 0.87 | 0.87 | 1.13 | 1.13 |
| Vetch | 0.87 | 0.87 | 1.13 | 1.13 |
| Other pulse | 0.87 | 0.87 | 1.13 | 1.13 |
| Neug | 2.10 | 2.10 | 0.96 | 0.96 |
| Linseed | 2.10 | 2.10 | 0.96 | 0.96 |
| Groundnuts | 2.10 | 2.10 | 0.96 | 0.96 |
| Sesame | 2.10 | 2.10 | 0.96 | 0.96 |
| Other cereals | -6.70 | -6.70 | 2.30 | 2.30 |
| Other spices | 0.67 | 0.67 | 0.30 | 0.30 |
| Other oilseeds | 2.10 | 2.10 | 0.96 | 0.96 |
| Peppers | 0.67 | 0.67 | 0.30 | 0.30 |
| Other vegetable | 0.87 | 0.87 | 0.95 | 0.95 |
| Onion | 0.87 | 0.87 | 0.95 | 0.95 |
| Potato and sweat potato | 0.59 | 0.59 | 0.18 | 0.18 |
| Garlic | 0.67 | 0.67 | 0.30 | 0.30 |
| Taro godere | 0.59 | 0.59 | 0.18 | 0.18 |
| Other root crop | 0.59 | 0.59 | 0.18 | 0.18 |
| Bananas | 0.87 | 0.87 | 0.95 | 0.95 |
| Other fruits | 0.87 | 0.87 | 0.95 | 0.95 |
| Chat | 0.85 | 0.85 | 1.39 | 1.39 |
| Coffee | 0.85 | 0.85 | 1.39 | 1.39 |
| Cotton | 0.85 | 0.85 | 1.39 | 1.39 |
| Hops | 0.85 | 0.85 | 1.39 | 1.39 |
| Sugarcane | 0.85 | 0.85 | 1.39 | 1.39 |
| Enset | - 0.39 | -0.39 | 2.12 | 2.12 |
| Flower | 1.50 | 1.50 | 1.72 | 1.72 |
| Livestock | 1.23 | 1.23 | 1.22 | 1.22 |
| Forest | 1.50 | 1.50 | 1.72 | 1.72 |
| Fishing | 0.12 | 0.12 | 0.52 | 0.52 |
| Preserve | 0.12 | 0.12 | 0.52 | 0.52 |
| Vegetable oil | 0.90 | 0.90 | 0.83 | 0.83 |
| Dairy | 0.12 | 0.12 | 0.52 | 0.52 |
| Grain | 0.12 | 0.12 | 0.52 | 0.52 |
| Bakery | 0.12 | 0.12 | 0.52 | 0.52 |
| Sugar | 0.96 | 0.96 | 0.16 | 0.16 |
| Argo-processing | 0.12 | 0.12 | 0.52 | 0.52 |
| Animal feed | 0.12 | 0.12 | 0.52 | 0.52 |
| Alcohol | 0.12 | 0.12 | 0.52 | 0.52 |
| Soft drinks | 0.12 | 0.12 | 0.52 | 0.52 |
| Tobacco | 1.50 | 1.50 | 1.72 | 1.72 |
| Textile | 0.67 | 0.67 | 1.19 | 1.19 |
| Apparel | 0.67 | 0.67 | 1.19 | 1.19 |
| Leather | 0.67 | 0.67 | 1.19 | 1.19 |
| Wood | 1.50 | 1.50 | 1.72 | 1.72 |
| Papier | 1.50 | 1.50 | 1.72 | 1.72 |
| 1.50 | 1.50 | 1.72 | 1.72 | |
| Chemicals | 1.50 | 1.50 | 1.72 | 1.72 |
| Fertilizer | 1.50 | 1.50 | 1.72 | 1.72 |
| Ink | 1.50 | 1.50 | 1.72 | 1.72 |
| Soap detergent | 1.50 | 1.50 | 1.72 | 1.72 |
| Pharmaceutical | 1.50 | 1.50 | 1.72 | 1.72 |
| Rubber | 1.50 | 1.50 | 1.72 | 1.72 |
| Non-metal | 1.50 | 1.50 | 1.72 | 1.72 |
| Metal | 1.50 | 1.50 | 1.72 | 1.72 |
| Electrical | 1.50 | 1.50 | 1.72 | 1.72 |
| Machinery | 1.50 | 1.50 | 1.72 | 1.72 |
| Furniture | 1.50 | 1.50 | 1.72 | 1.72 |
| Gas | 1.50 | 1.50 | 1.72 | 1.72 |
| Construction | 1.50 | 1.50 | 1.72 | 1.72 |
| Water | 1.35 | 1.35 | 0.86 | 0.86 |
| Transport | 1.35 | 1.35 | 0.86 | 0.86 |
| Trade | 1.35 | 1.35 | 0.86 | 0.86 |
| Real | 1.35 | 1.35 | 0.86 | 0.86 |
| Public | 1.35 | 1.35 | 0.86 | 0.86 |
| Private | 1.35 | 1.35 | 0.86 | 0.86 |
| Other service | 1.35 | 1.35 | 0.86 | 0.86 |
| Hotel | 1.35 | 1.35 | 0.86 | 0.86 |
| Health | 1.35 | 1.35 | 0.86 | 0.86 |
| Entertainment | 1.35 | 1.35 | 0.86 | 0.86 |
| Electricity | 1.35 | 1.35 | 0.86 | 0.86 |
| Education | 1.35 | 1.35 | 0.86 | 0.86 |
| Banking | 1.35 | 1.35 | 0.86 | 0.86 |
-
Source: Own compilation based on Hertel (1997) and Tafere et al. (2010).
Frisch elasticity
| Urban poor household | Urban non-poor Household | Rural poor household | Rural non-poor household |
|---|---|---|---|
| -5.85 | -5.85 | -5.85 | -5.85 |
-
Source: Own compilation based on Hertel (1997).
Data and code availability
We used the STAGE 1 variant of the CGE model, which is open source at http://cgemod.org.uk/stage_1.html, and the Social Accounting Matrix can be accessed from the Ministry of Planning and Development of Ethiopia.