Social Distress and (Some) Relief: Estimating the Impact of Pandemic Job Loss on Poverty in South Africa
- University of Surrey; and SALDRU, University of Cape Town, South Africa
- SALDRU, University of Cape Town, South Africa
- World Bank Equity and Policy Lab; and SALDRU, University of Cape Town, South Africa
Figures
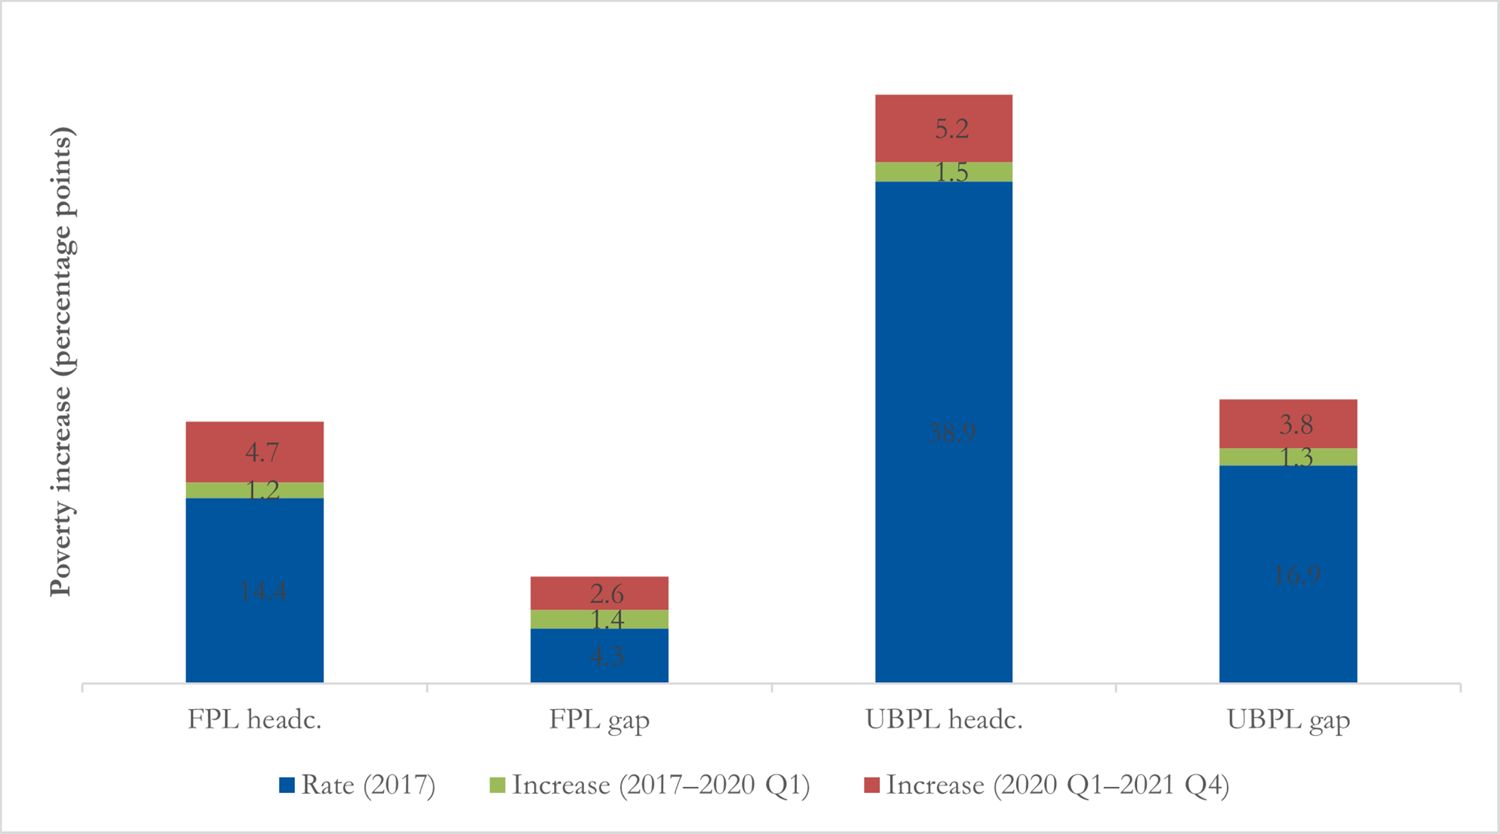
Poverty increase in NIDS by matching QLFS employment changes.
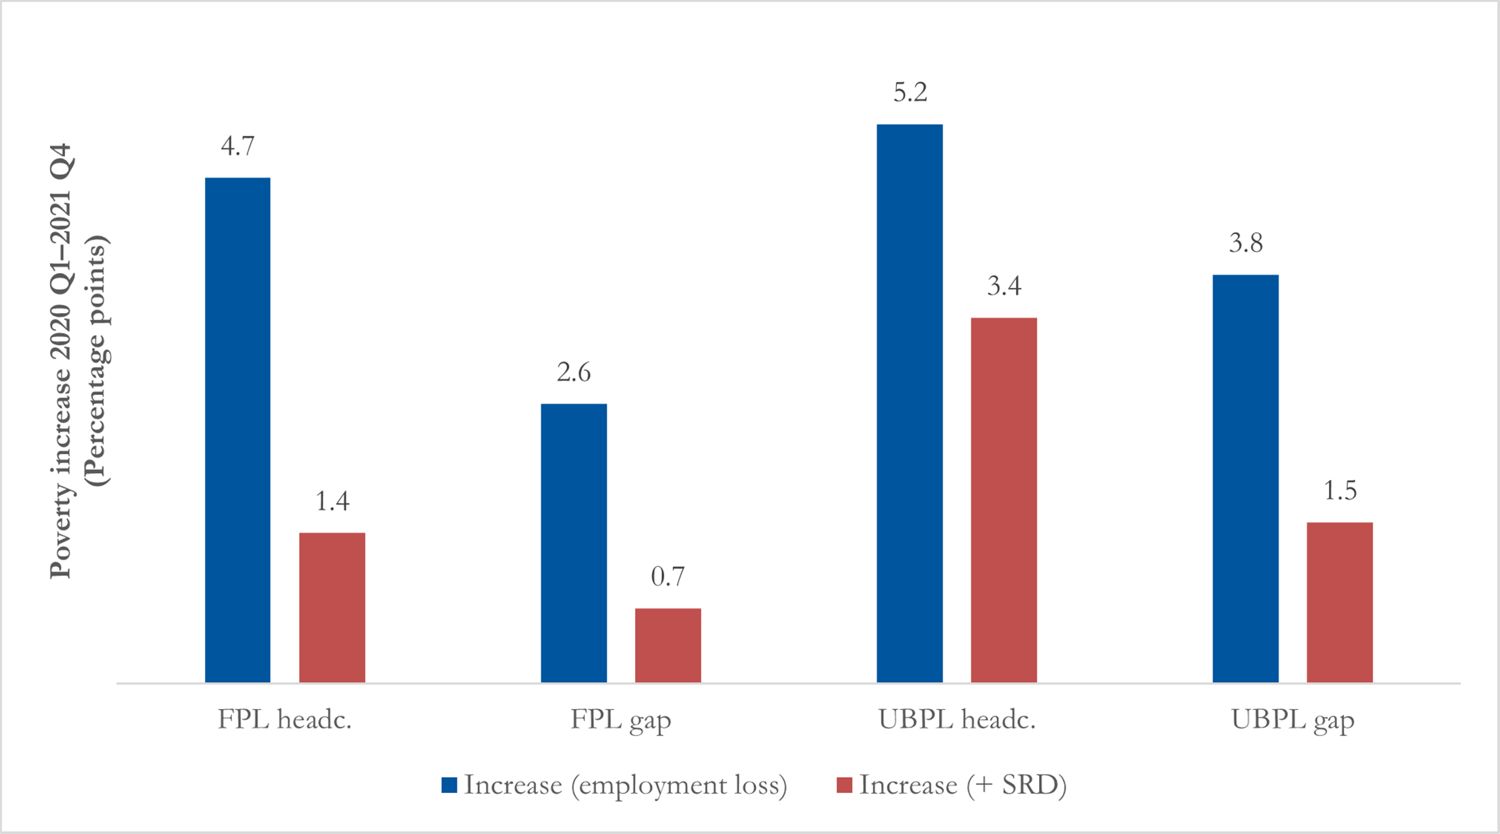
Poverty increase 2020 Q1 to 2021 Q4 with and without SRD, in NIDS by matching on employment changes.
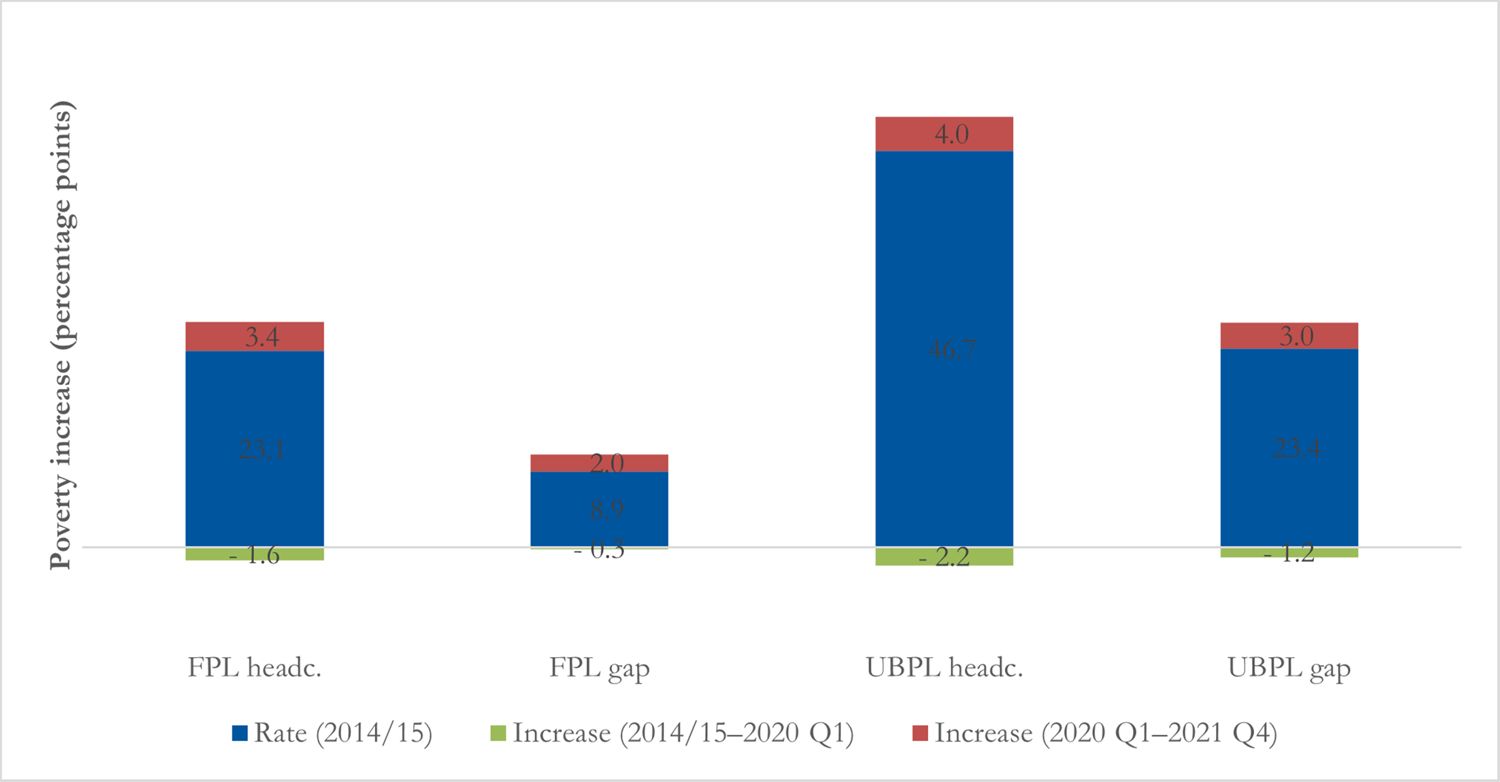
Poverty rates in LCS, matching on changes.

Poverty rates in NIDS, matching on levels.
Tables
Poverty estimates by method, 2020 Q1 to 2021 Q4.
| Increase in poverty rates | |||||||||
|---|---|---|---|---|---|---|---|---|---|
| Data and method | Baseline | Employment loss only | SRD | ||||||
| Headcount (%) | Gap (%) | Headcount (percentage points) | Gap (percentage points) | Population (million) | Headcount (percentage points) | Gap (percentage points) | Population (million) | ||
| Upper-bound poverty line | |||||||||
| NIDS | Changes | 40.4 | 18.2 | 5.2 | 3.8 | 3.1 | 3.4 | 1.5 | 2.0 |
| Levels | 44.0 | 21.4 | 3.0 | 2.5 | 1.8 | 1.1 | 0.2 | 0.7 | |
| LCS | Changes | 44.5 | 22.2 | 4.0 | 3.0 | 2.4 | |||
| Food poverty line | |||||||||
| NIDS | Changes | 15.6 | 5.7 | 4.7 | 2.6 | 2.8 | 1.4 | 0.7 | 0.8 |
| Levels | 19.6 | 8.1 | 3.3 | 1.7 | 2.0 | −0.3 | −0.3 | −0.2 | |
| LCS | Changes | 21.5 | 8.6 | 3.4 | 2.0 | 2.0 | |||
-
Note: the 2021 FPL is ZAR624 per month and the UBPL is ZAR1,335 per month.
-
Source: authors’ estimates based on QLFS 2017, 2021 Q4; NIDS 2017; LCS 2014/15.
Comparison with existing poverty estimates.
| Poverty headcount ratio estimates (%) | ||||||||
|---|---|---|---|---|---|---|---|---|
| Poverty line | Barnes et al. | Van den Heever et al. | NIDS levels | |||||
| Mar 2020 | April 2020 | 2020 Q4 | 2020 Q1 | 2020 Q2 | 2020 Q4 | 2021 Q4 | ||
| FPL | 20.6 | 26.3 | 21.2 | 19.6 | 22.5 | 21.6 | 22.9 | |
| UBPL | 48.2 | 52.5 | 48.9 | 44.0 | 46.7 | 46.0 | 47.0 | |
-
Note: authors’ estimates calculated here using most comparable method (NIDS levels); authors’ estimates and 2020 Q2 broadly comparable estimates not including simulated allocations of the Special COVID-19 SRD; broadly comparable poverty rate estimates modelled using income aggregate; authors’ estimates based on 2021 poverty lines; broadly comparable estimates based on 2019 lines adjusted using CPI to 2021; differences likely to be minimal.
-
Source: author’s estimates based on QLFS 2017, 2020 Q4, 2021 Q4; NIDS 2017; broadly comparable estimates for April 2020 based on Barnes et al. (2021) (including simulated TERS receipt) and for 2020 Q4 on Van de Heever et al. (2021).
Number of individuals and households, by QLFS dataset
| QLFS dataset | Individuals | Households |
|---|---|---|
| 2015 Q1 | 72,561 | 20,828 |
| 2017 Q1 | 69,353 | 20,529 |
| 2020 Q1 | 66,657 | 19,913 |
| 2020 Q2 | 47,103 | 13,408 |
| 2020 Q4 | 48,990 | 14,242 |
| 2021 Q4 | 39,073 | 11,502 |
-
Source: authors’ calculations based on QLFS 2015 Q1, 2017 Q1, 2020 Q1, 2021 Q4.
Year-on-year GNI growth (LCS).
| Year | Per capita GNI | Year-on-year growth |
|---|---|---|
| 2014/15 | 77,062 | |
| 2015/16 | 81,474 | 1.06 |
| 2016/17 | 85,626 | 1.05 |
| 2017/18 | 89,172 | 1.04 |
| 2018/19 | 92,309 | 1.04 |
| 2019/20 | 91,681 | 0.99 |
| 2020/21 | 96,229 | 1.05 |
-
Source: authors’ estimates based on SARB (2022).
Year-on-year GNI growth (NIDS).
| Year | Per capita GNI | Year-on-year growth |
|---|---|---|
| 2017 | 86,633 | |
| 2018 | 90,018 | 1.04 |
| 2019 | 93,072 | 1.03 |
| 2020 | 91,217 | 0.98 |
-
Source: authors’ estimates based on SARB (2022).
Employment rates by demographic characteristic in QLFS and NIDS, matching on changes.
| Employment | ||||||
|---|---|---|---|---|---|---|
| Demographic characteristics | 2017 rates | 2021 rates | 2017–21 (% change) | |||
| QLFS | NIDS | QLFS | NIDS | QLFS | NIDS | |
| All | 58.0 | 63.2 | 48.5 | 51.0 | −16.4 | −19.3 |
| Race | ||||||
| African | 54.9 | 61.8 | 45.5 | 49.0 | −17.1 | −20.7 |
| Coloured | 62.7 | 63.6 | 52.2 | 51.9 | −16.7 | −18.4 |
| Indian/Asian | 68.0 | 66.5 | 51.6 | 58.0 | −24.1 | −12.8 |
| White | 79.6 | 79.0 | 78.9 | 70.4 | −0.9 | −10.9 |
| Gender | ||||||
| Female | 65.0 | 72.9 | 55.1 | 58.1 | −15.2 | −20.3 |
| Male | 51.1 | 53.8 | 41.9 | 44.0 | −18.0 | −18.2 |
| Rural/urban | ||||||
| Rural | 44.9 | 52.3 | 37.2 | 42.9 | −17.1 | −18.0 |
| Urban | 63.1 | 68.1 | 53.4 | 54.6 | −15.4 | −19.8 |
| Education | ||||||
| Less than matric | 48.8 | 54.1 | 40.4 | 42.3 | −17.2 | −21.8 |
| Matric | 62.9 | 64.1 | 50.4 | 49.7 | −19.9 | −22.5 |
| Tertiary | 81.9 | 82.0 | 73.9 | 71.2 | −9.8 | −13.2 |
-
Note: supercolumn (a) shows the employment rates in the original 2017 data, for NIDS and QLFS, supercolumn (b) the employment rates for 2021 Q4 in the updated dataset, and supercolumn (c) the % change in the QLFS and NIDS from 2017 to 2021 Q4; we disaggregate into the usual four racial groups rather than the aggregated two we use for the updating algorithm; restricted to ages 25–55.
-
Source: authors’ estimates based on QLFS 2017, 2021 Q4; NIDS 2017.
Employment sectors in QLFS and NIDS, matching on changes.
| Employment sector | Employment | |||||
|---|---|---|---|---|---|---|
| 2017 rates (%) | 2021 rates (%) | 2017–21 (% change) | ||||
| QLFS | NIDS | QLFS | NIDS | QLFS | NIDS | |
| Formal/informal | ||||||
| Informal | 28.3 | 32.5 | 28.0 | 31.9 | −1.1 | −1.8 |
| Sector | ||||||
| Agriculture | 8.1 | 10.9 | 8.4 | 11.9 | 3.7 | 9.2 |
| Util./fin. | 21.8 | 18.3 | 24.2 | 20.3 | 11.0 | 10.9 |
| Industry | 20.3 | 19.0 | 17.0 | 15.4 | −16.3 | −18.9 |
| Trade | 19.4 | 16.3 | 19.7 | 15.9 | 1.5 | −2.5 |
| Services | 22.2 | 25.3 | 22.2 | 25.6 | - | 1.2 |
| Private households | 8.2 | 10.2 | 8.6 | 11.0 | 4.9 | 7.8 |
-
Note: supercolumn (a) shows the proportions of employed in the original 2017 data, for NIDS and QLFS, supercolumn (b) the proportions of employed for 2021 Q4 in the updated dataset; and supercolumn (c) the % change in the QLFS and NIDS from 2017 to 2021 Q4; data restricted to ages 25–55.
-
Source: authors’ estimates based on QLFS 2017, 2021 Q4; NIDS 2017.
Employment rates by province in QLFS and NIDS, matching on changes.
| Employment | ||||||
|---|---|---|---|---|---|---|
| Province | 2017 rates | 2021 rates | 2017–21 (% change) | |||
| QLFS | NIDS | QLFS | NIDS | QLFS | NIDS | |
| Eastern Cape | 49.5 | 55.6 | 40.5 | 46.1 | −18.2 | −17.1 |
| Free State | 52.9 | 62.1 | 50.1 | 48.9 | −5.3 | −21.3 |
| Gauteng | 64.6 | 69.5 | 53.1 | 55.9 | −17.8 | −19.6 |
| KwaZulu-Natal | 52.1 | 61.6 | 44.8 | 52.0 | −14.0 | −15.6 |
| Limpopo | 53.7 | 57.0 | 42.0 | 45.4 | −21.8 | −20.4 |
| Mpumalanga | 58.0 | 62.9 | 46.7 | 49.1 | −19.5 | −21.9 |
| Northern Cape | 50.6 | 62.2 | 45.1 | 50.4 | −10.9 | −19.0 |
| North West | 53.5 | 60.2 | 43.3 | 49.2 | −19.1 | −18.3 |
| Western Cape | 67.4 | 63.1 | 58.9 | 48.6 | −12.6 | −23.0 |
-
Notes: supercolumn (a) shows the employment rates in the original 2017 data, for NIDS and QLFS, supercolumn (b) the employment rates for 2021 Q4 in the updated dataset, and supercolumn (c) the % change in the QLFS and NIDS from 2017 to 2021 Q4; data restricted to ages 25–55.
-
Source: authors’ estimates based on QLFS 2017, 2021 Q4; NIDS 2017.
Income growth in NIDS and national accounts.
| Year | Per capita national income | ||
|---|---|---|---|
| GNI in national accounts | Disposable income | ||
| Matching on changes | Matching on levels | ||
| Growth | |||
| 2017 to 2019 | 1.07 | 1.02 | 1.03 |
| 2020 Q1 to 2021 Q4 | 1.09 | 0.94 | 0.97 |
| 2020 Q1 to 2021 Q4 + SRD | 0.94 | 0.99 | |
-
Source: authors’ calculations based on SARB (2022) and NIDS 2017.
Employment rates in QLFS and LCS, matching on changes.
| Demographic characteristics | 2015 rates (%) | 2021 rates (%) | 2017–21 (% change) | |||
|---|---|---|---|---|---|---|
| QLFS | LCS | QLFS | LCS | QLFS | LCS | |
| All | 57 | 61 | 49 | 53 | −15 | −14 |
| Race | ||||||
| African | 54 | 58 | 46 | 50 | −16 | −13 |
| Coloured | 63 | 68 | 52 | 55 | −17 | −19 |
| Indian/Asian | 65 | 70 | 52 | 61 | −20 | −14 |
| White | 78 | 83 | 79 | 77 | 1 | −7 |
| Gender | ||||||
| Female | 65 | 68 | 55 | 59 | −15 | −14 |
| Male | 50 | 55 | 42 | 47 | -16 | -14 |
| Rural/urban | ||||||
| Rural | 45 | 46 | 37 | 40 | -17 | -14 |
| Urban | 62 | 68 | 53 | 58 | -14 | -14 |
| Education | ||||||
| Less than matric | 49 | 52 | 40 | 45 | −17 | −14 |
| Matric | 62 | 67 | 50 | 56 | −19 | −15 |
| Tertiary | 81 | 87 | 74 | 78 | −9 | −10 |
-
Notes: supercolumn (a) shows the employment rates in the original 2015 data, for LCS and QLFS, supercolumn (b) the employment rates for 2021 Q4 in the updated dataset, and supercolumn (c) the % change in the QLFS and LCS from 2015 to 2021 Q4; we disaggregate into the usual four racial groups rather than the aggregated two we use for the updating algorithm; restricted to ages 25–55.
-
Source: authors' estimates based on QLFS 2015, 2021 Q4; LCS 2014/15.
Employment rates in QLFS and NIDS, matching on levels.
| Demographic characteristics | 2017 rates (%) | 2021 rates (%) | 2017–21 (% change) | |||
|---|---|---|---|---|---|---|
| QLFS | NIDS | QLFS | NIDS | QLFS | NIDS | |
| All | 58 | 63 | 49 | 47 | −16 | −26 |
| Race | ||||||
| African | 55 | 62 | 46 | 44 | −17 | −29 |
| Coloured | 63 | 64 | 52 | 48 | −17 | −24 |
| Indian/Asian | 68 | 67 | 52 | 63 | −24 | −5 |
| White | 80 | 79 | 79 | 68 | −1 | −14 |
| Gender | ||||||
| Female | 65 | 73 | 55 | 51 | −15 | −30 |
| Male | 51 | 54 | 42 | 42 | −18 | −22 |
| Rural/urban | ||||||
| Rural | 45 | 52 | 37 | 37 | −17 | −30 |
| Urban | 63 | 68 | 53 | 51 | −15 | −25 |
| Education | ||||||
| Less than matric | 49 | 54 | 40 | 37 | −17 | −31 |
| Matric | 63 | 64 | 50 | 46 | −20 | −28 |
| Tertiary | 82 | 82 | 74 | 68 | −10 | −18 |
-
Notes: supercolumn (a) shows the employment rates in the original 2017 data, for NIDS and QLFS, supercolumn (b) the employment rates for 2021 Q4 in the updated dataset, and supercolumn (c) the % change in the QLFS and NIDS from 2017 to 2021 Q4; we disaggregate into the usual four racial groups rather than the aggregated two we use for the updating algorithm; restricted to ages 25–55.
-
Source: authors' estimates based on QLFS 2017, 2021 Q4; NIDS 2017.
Data and code availability
The raw data associated with this research is publicly available from Statistics South Africa (https://www.statssa.gov.za/) and DataFirst (https://www.datafirst.uct.ac.za/). The code associated with this paper and any supplementary data is publicly available on Joshua Budlender’s website (https://www.joshbudlender.co.za/) and Github repo (https://github.com/jbudlender).