Are Energy Bills Squeezing People’s Spending?
- Bank of Italy, DG for Economics, Statistics and Research - Financial Stability Directorate, Italy
- Bank of Italy, Climate Change and Sustainability Hub, Italy
Figures

Price elasticities of electricity demand at stratum level.
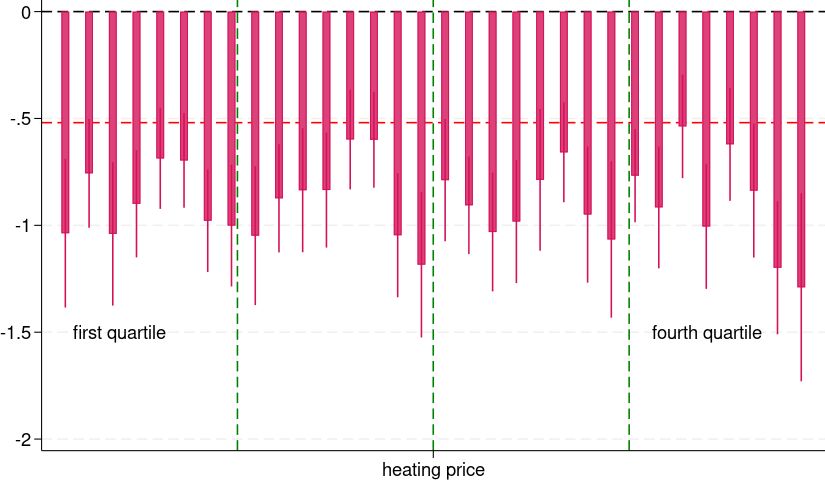
Price elasticities of heating demand at stratum level.

Baseline.. Notes: The figure shows the share of vulnerable households and the debt at risk in the baseline model. The rate of new non-performing household loans is defined as the ratio of non-performing loans to total household loans at the beginning of the period and it is calculated as an average of the quarters; the ratio is available until 2022.
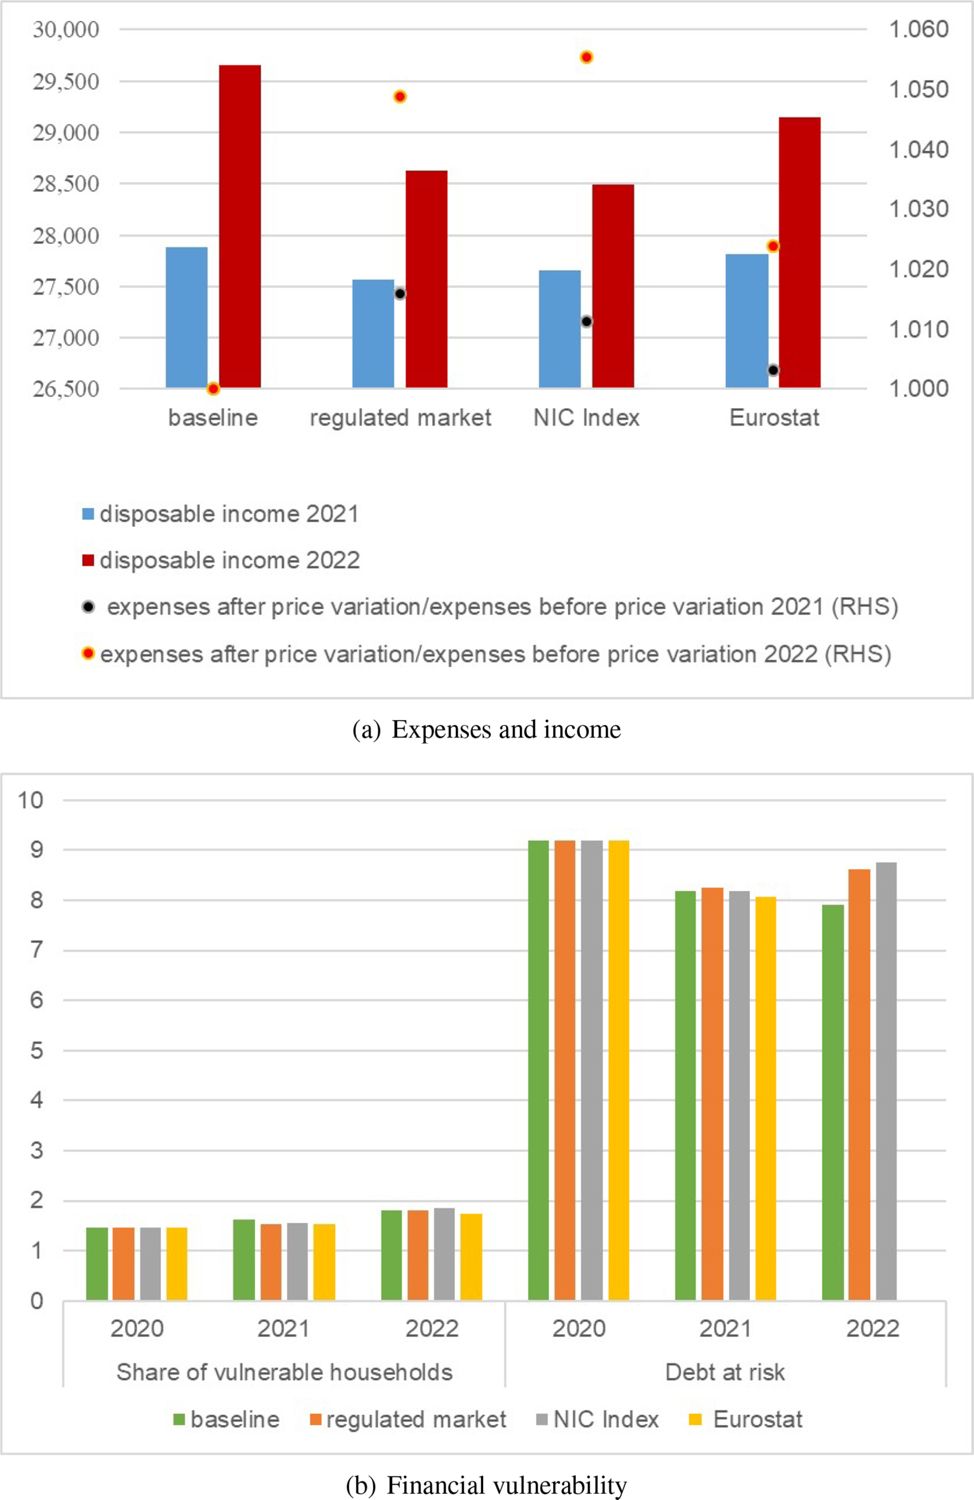
Microsimulation model with no price elasticity (case 1): Aggregate results.. Notes: Panel (a) shows how household consumption and disposable income change, on average, after the energy price shock. Panel (b) reports the share of vulnerable households and their debt (debt at risk). Disposable income is in euros, and results for Panel (b) are in percentage values.
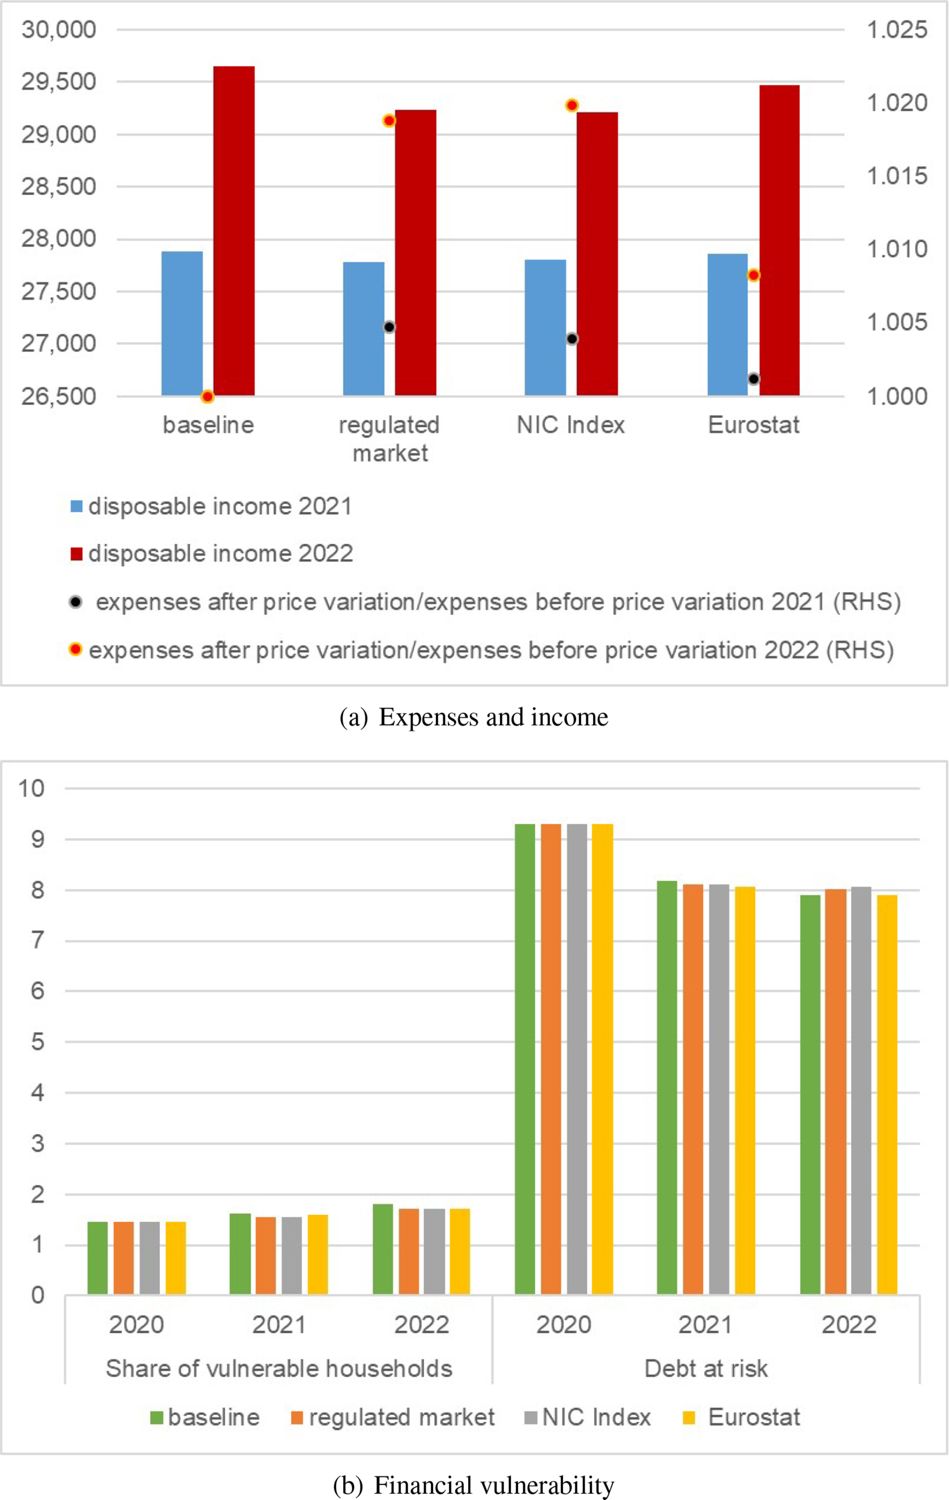
Microsimulation model with price elasticity, (case 2): Aggregate results.. Notes: Panel (a) shows how household consumption and disposable income change, on average, after the energyprice shock. Panel (b) reports the share of vulnerable households and their debt (debt at risk). Disposable incomeis in euros, and results for Panel (b) are in percentage values.
Tables
Cumulated price variations (2020-2022)
| Electricity | Natural gas | |||||
|---|---|---|---|---|---|---|
| Data source: | Regulated | NIC | Eurostat | Regulated | NIC | Eurostat |
| market | Index | market | Index | |||
| Period | (1) | (2) | (3) | (4) | (5) | (6) |
| A. Percentage variations | ||||||
| 2020-22 | 172 | 142 | 46 | 92 | 109 | 47 |
| 2020-21 | 31 | 15 | 4 | 22 | 21 | 6 |
| 2021-22 | 108 | 110 | 40 | 57 | 74 | 38 |
| B. Absolute variations | ||||||
| 2020-22 | 0.31 | 0.34 | 0.11 | 15.5 | 23.4 | 10.9 |
| 2020-21 | 0.05 | 0.04 | 0.01 | 3.8 | 4.4 | 1.4 |
| 2021-22 | 0.25 | 0.31 | 0.10 | 11.7 | 19.0 | 9.4 |
-
Notes: results are in percentage points for cumulated variations, €/kWh for electricity and €/Gj for natural gas in the case of absolute variations. The absolute variations for the NIC use Eurostat as base.
Description of the variables used
| Variable | Description | Source |
|---|---|---|
| (a) Model to estimate price elasticities | ||
| Electricity and heating quantity | HBS based on Faiella and Lavecchia (2021b) | |
| Final retail price for electricity and natural gas | Eurostat, Istat and ARERA (own elaboration; see also Table 1) | |
| Total expenditure of households | Own elaboration based on HBS | |
| Short run price elasticities for electricity and heating demand | Own elaboration based on HBS and (Faiella and Lavecchia, 2021b) | |
| (b) Model of households’ financial vulnerability | ||
| Income | National accounts and Bank of Italy macro model | |
| Mortgage | Bank of Italy’s statistical data warehouse and macroeconomic model | |
| Consumer credit | Bank of Italy’s Statistical data warehouse and macro model | |
| Mortgage interest rate | 10-year IRS (for fixed-rate)Euribor (for variable rate) | |
Strata of the population used in the analysis
| Stratum ID | Households’ type |
|---|---|
| x02 | Single person under the age of 35 or aged 35-64 |
| x03 | Single person aged 65 and over |
| x05 | Childless couple with contact person under the age of 35 years old or aged 35-64 |
| x06 | Childless couple with contact person aged 65 and over |
| x07 | Couple with 1 child |
| x08 | Couple with 2 or more children |
| x10 | Single parent |
| x11 | Other types |
-
where x=1,2,3 or 4 are the quartiles of the total equivalised expenditure distribution.
Price elasticities of energy demand at stratum level
| Electricity | Heating | |||
|---|---|---|---|---|
| Strata | ||||
| Single person under the age of 35 or aged 35-64, 1st quarter | -0.44 | 0.15 | -1.04 | 0.18 |
| Single person aged 65 and over, 1st quarter | -0.33 | 0.10 | -0.76 | 0.13 |
| Childless couple, < 35 years old or aged 35-64, 1st quarter | -0.67 | 0.16 | -1.04 | 0.17 |
| Childless couple, aged 65 and over, 1st quarter | -0.37 | 0.09 | -0.90 | 0.13 |
| Couple with 1 child, 1st quarter | -0.31 | 0.11 | -0.69 | 0.12 |
| Couple with 2 or more children, 1st quarter | -0.40 | 0.09 | -0.70 | 0.11 |
| Single parent, 1st quarter | -0.31 | 0.11 | -0.98 | 0.12 |
| Other types, 1st quarter | -0.23 | 0.13 | -1.00 | 0.14 |
| Single person under the age of 35 or aged 35-64, 2nd quarter | -0.24 | 0.12 | -1.05 | 0.17 |
| Single person aged 65 and over, 2nd quarter | -0.18 | 0.09 | -0.87 | 0.13 |
| Childless couple, < 35 years old or aged 35-64, 2nd quarter | -0.34 | 0.12 | -0.84 | 0.15 |
| Childless couple, aged 65 and over, 2nd quarter | -0.14 | 0.09 | -0.83 | 0.14 |
| Couple with 1 child, 2nd quarter | -0.16 | 0.09 | -0.60 | 0.12 |
| Couple with 2 or more children, 2nd quarter | -0.16 | 0.09 | -0.60 | 0.11 |
| Single parent, 2nd quarter | -0.13 | 0.11 | -1.05 | 0.15 |
| Other types, 2nd quarter | -0.29 | 0.16 | -1.18 | 0.17 |
| Single person under the age of 35 or aged 35-64, 3rd quarter | -0.16 | 0.11 | -0.79 | 0.15 |
| Single person aged 65 and over, 3rd quarter | -0.20 | 0.11 | -0.91 | 0.12 |
| Childless couple, < 35 years old or aged 35-64, 3rd quarter | -0.02 | 0.13 | -1.03 | 0.14 |
| Childless couple, aged 65 and over, 3rd quarter | -0.05 | 0.13 | -0.98 | 0.15 |
| Couple with 1 child, 3rd quarter | 0.01 | 0.10 | -0.79 | 0.17 |
| Couple with 2 or more children, 3rd quarter | -0.04 | 0.09 | -0.66 | 0.12 |
| Single parent, 3rd quarter | -0.07 | 0.18 | -0.95 | 0.16 |
| Other types, 3rd quarter | 0.05 | 0.20 | -1.07 | 0.19 |
| Single person under the age of 35 or aged 35-64, 4th quarter | -0.11 | 0.10 | -0.77 | 0.11 |
| Single person aged 65 and over, 4th quarter | -0.07 | 0.12 | -0.92 | 0.14 |
| Childless couple, < 35 years old or aged 35-64, 4th quarter | -0.07 | 0.14 | -0.54 | 0.12 |
| Childless couple, aged 65 and over, 4th quarter | -0.03 | 0.11 | -1.01 | 0.15 |
| Couple with 1 child, 4th quarter | -0.14 | 0.11 | -0.62 | 0.13 |
| Couple with 2 or more children, 4th quarter | -0.15 | 0.13 | -0.84 | 0.16 |
| Single parent, 4th quarter | -0.24 | 0.18 | -1.20 | 0.16 |
| Other types, 4th quarter | -0.11 | 0.21 | -1.29 | 0.22 |
Indicators of indebted households in 2020 (median value)
| Vulnerable HHs | Other indebted HHs | |
|---|---|---|
| Age | 49 | 49 |
| Household Size (number of components) | 3 | 3 |
| Net Wealth (euros) | 100,900 | 131,000 |
| Financial Assets (euros) | 3,000 | 10,000 |
| Debt to income | 3.6 | 0.7 |
| Debt to assets | 0.3 | 0.2 |
| Income (euros) | 15,147 | 34,474 |
| Mortgage (euros) | 52,000 | 16,000 |
| Annual debt instalment (euros) | 7,680 | 4,800 |
| Monthly consumption expenses | 1,158 | 1,416 |
-
Notes: Our calculations are based on SHIW data.
Model with no price elasticity (case 1): Aggregate results.
| 2020 | 2021 | 2022 | |
|---|---|---|---|
| (1) | (2) | (3) | |
| A. Expenses after /Expenses before | |||
| baseline | 1.000 | 1.000 | |
| regulated market | 1.016 | 1.049 | |
| NIC Index | 1.011 | 1.055 | |
| Eurostat | 1.003 | 1.024 | |
| B. Disposable income | |||
| baseline | 26,882 | 27,884 | 29,652 |
| regulated market | 26,882 | 27,564 | 28,630 |
| NIC Index | 26,882 | 27,656 | 28,493 |
| Eurostat | 26,882 | 27,820 | 29,149 |
| C. Share of vulnerable households | |||
| baseline | 1.45 | 1.62 | 1.80 |
| regulated market | 1.45 | 1.54 | 1.82 |
| NIC Index | 1.45 | 1.55 | 1.85 |
| Eurostat | 1.45 | 1.53 | 1.74 |
| D. Debt at risk | |||
| baseline | 9.19 | 8.18 | 7.90 |
| regulated market | 9.19 | 8.25 | 8.62 |
| NIC Index | 9.19 | 8.18 | 8.75 |
| Eurostat | 9.19 | 8.07 | 8.15 |
-
Notes: Panel A shows households’ consumption average change after the energy price shock; Panel B reports disposable income in euros; Panels C and D include the share of vulnerable households and their debt at risk in percentage values.
Model with price elasticity (case 2): Aggregate results.
| 2020 | 2021 | 2022 | |
|---|---|---|---|
| (1) | (2) | (3) | |
| A. Expenses after /Expenses before | |||
| baseline | 1.000 | 1.000 | |
| regulated market | 1.005 | 1.019 | |
| NIC Index | 1.004 | 1.020 | |
| Eurostat | 1.001 | 1.008 | |
| B. Disposable income | |||
| baseline | 26,882 | 27,884 | 29,652 |
| regulated market | 26,882 | 27,785 | 29,238 |
| NIC Index | 26,882 | 27,801 | 29,207 |
| Eurostat | 26,882 | 27,860 | 29,470 |
| C. Share of vulnerable households | |||
| baseline | 1.45 | 1.62 | 1.80 |
| regulated market | 1.45 | 1.54 | 1.71 |
| NIC Index | 1.45 | 1.54 | 1.72 |
| Eurostat | 1.45 | 1.59 | 1.72 |
| D. Debt at risk | |||
| baseline | 9.30 | 8.18 | 7.90 |
| regulated market | 9.30 | 8.10 | 8.02 |
| NIC Index | 9.30 | 8.10 | 8.06 |
| Eurostat | 9.30 | 8.06 | 7.91 |
-
Notes: Panel A shows households’ consumption average change after the energy price shock; Panel B reports disposable income in euros; Panels C and D include the share of vulnerable households and their debt at risk in percentage values.
Model with price elasticity (case 2): heterogeneity in expenses and disposable income.
| Expenses after/Expenses before | Disposable income | |||||
|---|---|---|---|---|---|---|
| (1) | (2) | (3) | (4) | (5) | (6) | |
| Geographical area | ||||||
| North | Center | South | North | Center | South | |
| 2020 | ||||||
| baseline | 31,161 | 28,138 | 20,094 | |||
| 2021 | ||||||
| baseline | 1.000 | 1.000 | 1.000 | 32,341 | 29,201 | 20,813 |
| regulated market | 1.003 | 1.004 | 1.006 | 32,239 | 29,107 | 20,717 |
| NIC Index | 1.004 | 1.004 | 1.005 | 32,255 | 29,123 | 20,734 |
| Eurostat | 1.001 | 1.001 | 1.001 | 32,316 | 29,178 | 20,790 |
| 2022 | ||||||
| baseline | 1.000 | 1.000 | 1.000 | 34,414 | 31,063 | 22,097 |
| regulated market | 1.017 | 1.017 | 1.022 | 33,991 | 30,661 | 21,688 |
| NIC Index | 1.017 | 1.018 | 1.024 | 33,966 | 30,633 | 21,646 |
| Eurostat | 1.007 | 1.008 | 1.010 | 34,226 | 30,889 | 21,917 |
| Number of household components | ||||||
| 1-2 | 3 | 4+ | 1-2 | 3 | 4+ | |
| 2020 | ||||||
| baseline | 21,280 | 33,598 | 37,186 | |||
| 2021 | ||||||
| baseline | 1.000 | 1.000 | 1.000 | 22,080 | 34,858 | 38,543 |
| regulated market | 1.005 | 1.005 | 1.005 | 22,000 | 34,738 | 38,412 |
| NIC Index | 1.004 | 1.004 | 1.004 | 22,016 | 34,754 | 38,429 |
| Eurostat | 1.001 | 1.001 | 1.001 | 22,062 | 34,828 | 38,510 |
| 2022 | ||||||
| baseline | 1.000 | 1.000 | 1.000 | 23,488 | 37,066 | 40,969 |
| regulated market | 1.018 | 1.020 | 1.019 | 23,146 | 36,560 | 40,429 |
| NIC Index | 1.018 | 1.023 | 1.022 | 23,140 | 36,492 | 40,355 |
| Eurostat | 1.008 | 1.010 | 1.009 | 23,348 | 36,831 | 40,711 |
| Age classes | ||||||
| 15-39 | 40-65 | 66+ | 15-39 | 40-65 | 66+ | |
| 2020 | ||||||
| baseline | 27,611 | 30,218 | 21,803 | |||
| 2021 | ||||||
| baseline | 1.000 | 1.000 | 1.000 | 27,970 | 31,569 | 22,959 |
| regulated market | 1.005 | 1.005 | 1.005 | 27,870 | 31,461 | 22,874 |
| NIC Index | 1.004 | 1.004 | 1.004 | 27,885 | 31,477 | 22,891 |
| Eurostat | 1.001 | 1.001 | 1.001 | 27,945 | 31,542 | 22,939 |
| 2022 | ||||||
| baseline | 1.000 | 1.000 | 1.000 | 29,111 | 33,572 | 24,749 |
| regulated market | 1.018 | 1.018 | 1.019 | 28,703 | 33,120 | 24,382 |
| NIC Index | 1.020 | 1.020 | 1.020 | 28,666 | 33,068 | 24,378 |
| Eurostat | 1.008 | 1.008 | 1.008 | 28,925 | 33,364 | 24,599 |
-
Notes: Columns 1-3 show household consumption average change after the energy price shock. Columns 4-6 report disposable income in euros.
Model with price elasticity (case 2): heterogeneity in financial vulnerability.
| Share of vulnerable households | Debt at risk | |||||
|---|---|---|---|---|---|---|
| (1) | (2) | (3) | (4) | (5) | (6) | |
| Geographical area | ||||||
| North | Center | South | North | Center | South | |
| 2020 | ||||||
| baseline | 1.41 | 1.45 | 1.52 | 8.86 | 6.51 | 16.51 |
| 2021 | ||||||
| baseline | 1.50 | 1.08 | 2.12 | 7.36 | 4.85 | 16.30 |
| regulated market | 1.30 | 1.11 | 2.14 | 7.36 | 4.41 | 16.43 |
| NIC Index | 1.30 | 1.11 | 2.14 | 7.36 | 4.31 | 16.42 |
| Eurostat | 1.43 | 1.08 | 2.12 | 7.34 | 4.36 | 16.32 |
| 2022 | ||||||
| baseline | 1.50 | 1.38 | 2.49 | 6.52 | 5.25 | 16.03 |
| regulated market | 1.31 | 1.39 | 2.48 | 6.58 | 5.18 | 16.60 |
| NIC Index | 1.31 | 1.39 | 2.48 | 6.62 | 5.20 | 16.66 |
| Eurostat | 1.29 | 1.39 | 2.53 | 6.51 | 5.09 | 16.32 |
| Number of household components | ||||||
| 1-2 | 3 | 4+ | 1-2 | 3 | 4+ | |
| 2020 | ||||||
| baseline | 0.80 | 2.13 | 2.77 | 8.69 | 9.87 | 9.45 |
| 2021 | ||||||
| baseline | 1.28 | 1.62 | 2.63 | 9.35 | 7.57 | 7.36 |
| regulated market | 1.11 | 1.64 | 2.73 | 8.99 | 7.61 | 7.48 |
| NIC Index | 1.11 | 1.64 | 2.73 | 8.99 | 7.61 | 7.48 |
| Eurostat | 1.21 | 1.63 | 2.67 | 9.01 | 7.58 | 7.38 |
| 2022 | ||||||
| baseline | 1.40 | 2.16 | 2.68 | 9.68 | 7.37 | 6.47 |
| regulated market | 1.20 | 2.19 | 2.80 | 9.57 | 7.52 | 6.77 |
| NIC Index | 1.19 | 2.19 | 2.83 | 9.56 | 7.58 | 6.84 |
| Eurostat | 1.24 | 2.17 | 2.73 | 9.50 | 7.45 | 6.60 |
| Age classes | ||||||
| 15-39 | 40-65 | 66+ | 15-39 | 40-65 | 66+ | |
| 2020 | ||||||
| baseline | 2.66 | 1.95 | 0.26 | 12.36 | 7.70 | 13.38 |
| 2021 | ||||||
| baseline | 2.17 | 2.29 | 0.56 | 10.81 | 7.34 | 6.36 |
| regulated market | 2.17 | 2.32 | 0.30 | 10.82 | 7.28 | 5.63 |
| NIC Index | 2.17 | 2.32 | 0.30 | 10.82 | 7.28 | 5.63 |
| Eurostat | 2.17 | 2.29 | 0.46 | 10.81 | 7.19 | 6.11 |
| 2022 | ||||||
| baseline | 2.20 | 2.56 | 0.73 | 11.27 | 7.05 | 5.62 |
| regulated market | 2.51 | 2.50 | 0.49 | 12.42 | 6.96 | 5.02 |
| NIC Index | 2.51 | 2.51 | 0.49 | 12.46 | 7.00 | 5.02 |
| Eurostat | 2.30 | 2.57 | 0.48 | 11.64 | 7.01 | 5.01 |
-
Notes: The share of vulnerable households and the debt at risk are in percentage values.
Data and code availability
Household Budget Survey - publicly available at the website: https://www.istat.it/it/archivio/180358. Survey of Household Income and Wealth - Anonymised survey data are distributed for research purposes only: https://www.bancaditalia.it/statistiche/tematiche/indagini-famiglie-imprese/bilanci-famiglie/distribuzione-microdati/index.html. The codes are properties owned by the Bank of Italy.