The development of AUS-OA - a population health economic model of osteoarthritis in Australia
- Department of Surgery, The University of Melbourne, St Vincent’s Hospital, Australia
- Simulation modelling and health economics of chronic disease unit, The University of Melbourne, Australia
Abstract
Simulation modelling is a powerful tool for assessing the impact of diseases and guiding healthcare policy decisions. This paper introduces AUS-OA, a dynamic discrete time microsimulation model of osteoarthritis and its treatment in Australia. AUS-OA aims to provide policy makers and researchers with increased capacity to evaluate the burden and treatment of osteoarthritis across Australia. AUS-OA uses a synthetic base population of individuals with age, sex, Body Mass Index (BMI), osteoarthritis and other attributes weighted to the Australian population. Body mass index, osteoarthritis incidence and progression, primary and revision joint replacement are modelled over time based on econometric equations derived from linked and longitudinal data. Costs and health-related quality of life outcomes are then assigned based on an individual’s health conditions and treatments. AUS-OA is calibrated with observed data between 2013 and 2022. Base case and ‘what-if’ scenarios can then be simulated from 2023. For an initial application, AUS-OA was used for an economic evaluation of a decision support tool, SMART Choice, that improves patient selection into surgery. Comparisons of univariate and bivariate distributions across key population attributions such as BMI, osteoarthritis and joint replacement between the synthetic and actual populations highlight that the AUS-OA model accurately reflects the Australian population over the calibration period. The evaluation of the SMART Choice decision support tool highlighted that the tool is cost-effective. AUS-OA provides a robust analytical framework for evaluating the long-term, population-level impact of osteoarthritis and its treatments.
1. Introduction
Osteoarthritis is a common and debilitating disease. In Australia, people with osteoarthritis are almost twice as likely to rate their health as ‘fair’ to ‘poor’, and to report ‘moderate’ to ‘very severe’ bodily pain compared to those without the condition (Australian Institute of Health and Welfare, 2023). Federal government spending on osteoarthritis reached $4.3 billion in 2020-21, or 2.9% of total spending on healthcare (Australian Institute of Health and Welfare, 2023), and is expected to continue grow rapidly to 2030 (Ackerman et al., 2019). Substantial effort is being made to reduce the health and economic burden of osteoarthritis, including the development of new streamlined models of care (Minister for Health et al., 2023), community-based lifestyle interventions to reduce the need for end-stage surgeries (The University of Sydney, 2023), and trials to investigate the use of stem-cell therapies to avoid the progression of osteoarthritis altogether (Watkins, 2022). However, the epidemiology of osteoarthritis is complex and progresses over a lifetime, while population demographics and behaviours are changing over time. It is a major challenge to extrapolate the results from clinical trials and quasi-experimental studies to broader, long-term population outcomes, to understand which interventions are effective and cost-effective.
Simulation modelling addresses that challenge and is a powerful tool for assessing the impact of diseases and guiding healthcare policy decisions (Schofield et al., 2018; Zucchelli et al., 2010). Its advantages include the ability to model the social determinants of health and disease progression over a patient’s lifetime, and to capture the heterogeneity of a population within a systematic analytical framework (Zucchelli et al., 2010; Kopasker et al., 2023). Complex population trends can be modelled by a series of relatively simple equations at the individual level, such as how the progression of osteoarthritis varies depending on age, gender and/or Body Mass Index (BMI). New policies and models of care can be evaluated by changing inputs into the model, and sensitivity analyses can be completed to test the robustness of the results.
The efficacy of simulation models for the study of osteoarthritis is exemplified by OAPOL, a Markov model developed in the United States that has been widely utilised for health economic policy research (Losina et al., 2011); a New Zealand adaption of OAPOL, NZ-MOA (Wilson and Abbott, 2018); and POHEM-OA, a continuous time microsimulation model developed originally out of Statistics Canada (Kopec et al., 2010). Simulation modelling has been employed in Australia to model the impact of policy (Hayes et al., 2019), and the indirect costs of chronic disease (Schofield et al., 2015). This paper introduces AUS-OA, a dynamic microsimulation model of osteoarthritis and its treatment in Australia. The aim of AUS-OA is to provide policy makers, healthcare providers, and researchers with the critical capability to assess the lifetime and population-wide impacts of interventions and innovations to reduce the burden of osteoarthritis across Australia.
2. The AUS-OA dynamic simulation model
2.1. Overview of model
AUS-OA is a probabilistic, discrete time, dynamic microsimulation model representative of the Australian population of adults aged 45 years and older.1 Individual agents within the model have a range of attributes including age, gender, BMI and osteoarthritis, the presence of comorbidities including mental illness, the use of medications for osteoarthritis or mental illness, private health insurance status, socio-economic position as proxied by completion of year 12 secondary schooling, and state of residence (see Table 1). Each year, new agents enter the model at age 45, while existing agents in the model grow older, experience a change in BMI, acquire comorbidities, potentially develop osteoarthritis or experience it worsen, seek treatments such as pain relief or total joint replacement, and in some cases, die. Health service utilisation and costs, and health-related quality of life, are then evaluated based on the individual agent’s attributes, health conditions, and treatments. Presently, the focus of AUS-OA is osteoarthritis of the knee, but the model has the capacity to be adapted to include other bodily sites. AUS-OA simulations begin in 2013 to allow the model to be validated against observed data between 2013 and 2022. Base case projections and ‘what-if’ scenarios can then be simulated for up to 30 years from 2023 until 2053, to evaluate the impact of socio-demographic trends, changes in costs or advances in osteoarthritis treatment and models of care. The model is coded in both R 2024.04.2 (R Core Team, 2020) and Matlab R2022b (MATLAB, 2022).
Key variables tracked within the model.
| Domain | Variable |
|---|---|
| Socio-demographics | Age, gender, socio-economic position, private health insurance, state |
| Risk factors | BMI, mental illness, comorbidities |
| Outcomes | Osteoarthritis, health-related quality of life, costs |
| Treatments | Osteoarthritis medications, primary care health, joint replacement and revisions |
2.2. Base population
A 2013 synthetic Australian population is derived from a long-running Australian longitudinal study, the Household, Income and Labour Dynamics in Australia (HILDA) survey (Wooden and Watson, 2007), and weighted to the Australian population using the SimPop synthetic data generator package in R (Templ et al., 2017). HILDA contains data for all key variables, including age, gender, year 12 completion (the proxy for socio-economic position), BMI, mental illness (as defined as a diagnosis of depression or anxiety), comorbidities (modelled as a count of illnesses including heart disease, diabetes, cancer as recorded in HILDA), osteoarthritis and health-related quality of life measured using the Short Form 6D generic instrument (Melbourne Institute: Applied Economic & Social Research, 2024). A range of visual and empirical diagnostics were completed to ensure the synthetic population captures the cross-correlations between key population attributes (e.g. between age, BMI and osteoarthritis). These diagnostics, including univariate and bivariate distributions between the synthetic and actual populations, are provided in Supplementary materials.
2.3. Dynamics
2.3.1. BMI
Changes in BMI over time are modelled as a function of age, gender, socio-economic position as proxied by year 12 completion, which is time invariant, and current BMI, based on previous research using a simulation modelling approach to match cohorts with National Health Surveys reporting population-level BMI (Hayes et al., 2019).
2.3.2. Osteoarthritis
Osteoarthritis incidence rates are derived from HILDA and based on based on age, sex, socio-economic position, and BMI (see Supplementary materials). The Kellgren-Lawrence (KL) grade is used to characterise osteoarthritis severity as is common in the literature (Joo et al., 2022). AUS-OA assumes that all new incidents of osteoarthritis have a KL grade of 2. KL progression equations are derived from the Osteoarthritis Initiative (OAI), a large longitudinal study of osteoarthritis and are based on age, sex and BMI. Note that national statistics tend to report osteoarthritis at the person-level, rather than the individual site within the body (e.g. knee). In AUS-OA, while the total population prevalence of osteoarthritis can grow over time, a fixed proportion (49 per cent) of those reporting the presence of osteoarthritis are assumed to have knee osteoarthritis, based on a recent review that found in Australia this share has remained relatively constant over time (Long et al., 2022). AUS-OA does not specify the side of the knee osteoarthritis (left or right), but previous total knee replacements (TKRs) are explicitly counted, and used as a predictor of a subsequent TKR.
2.3.3. Comorbidities
Mental health incidence is modelled as a function of gender such that the prevalence of mental illness within AUS-OA increases in-line with observed population trends. Incidence of other chronic comorbidity is modelled as a function of age and gender based on analysis of HILDA over time and incorporated in the model as a count of comorbidities (see Supplementary materials). AUS-OA currently assumes no remission for mental health or other comorbidities. Further modelling of the dynamics of comorbidities and mental illness can be incorporated at a later date.
2.3.4. Total knee replacement
The incidence of TKR is modelled as a function of age, sex, BMI, mental health, and previous TKR, based on a Fine and Gray competing risks model, with death the competing risk, as published previously (Thuraisingam et al., 2022). Two adjustments are made for AUS-OA: first incidence rates are adjusted up or down based on the individual’s osteoarthritis severity (see Supplementary materials), a known risk factor used as a dependent variable in high performing international models (Liu et al., 2022); second, trends over time are incorporated into the baseline hazard rate and calibrated to observed trends in utilisation by age and sex from the Australian Orthopaedic Association National Joint Replacement Registry (AOANJRR) which captures data on 98 per cent of Australia’s joint replacements (Smith et al., 2023). Future iterations of the model will differentiate models of TKR incidence by private health insurance status.
2.3.5. Revisions of total knee replacement
Equations to model TKR revisions are developed from a bespoke data request from the Australian Orthopaedic Association National Joint Replacement Registry (AOANJRR) which predicts revisions using a parametric regression based on age, sex, and BMI (see Supplementary materials).
2.3.6. Death
Death rates are derived from the lifetables from the national statistics agency, amended with increased relative risks associated with joint replacement; obesity and comorbidities (Hayes et al., 2019; Australian Bureau of Statistics, 2014; Zhou et al., 2023). AUS-OA can also be run using standard unadjusted lifetables to investigate the impact of these adjustments. Full details of amendments to death rates are provided in the Supplementary materials.
2.3.7. Health-related Quality of Life
Health-related quality of life (HRQOL) measured in HILDA using the SF6D forms the base 2013 population. Over time, movements in HRQOL occur as a result of changes in age, BMI, comorbidities and severity of osteoarthritis. Age and comorbidity HRQOL decrements are derived from analysis of HILDA; osteoarthritis decrements are based on a longitudinal analysis of the OAI (Wilson et al., 2018). BMI decrements are obtained from a meta-analysis (Carrello et al., 2021). HRQOL scores are used to estimate Quality Adjusted Life Years (QALY) for each individual for each year. It is assumed that the HRQOL score for a given year is accrued across the year such that the QALY accrued in one year is equal to the HRQOL score in that year. The HRQOL improvements from TKR are derived from a regression analysis of the St Vincent’s Melbourne Arthroplasty (SMART) registry data that has captured joint replacements for over two decades (Gould et al., 2021), as a function of preoperative HRQOL, age, sex, BMI, comorbidities and mental health. This is an update on earlier 2017 analysis (Schilling et al., 2017). Further details are provided in the Supplementary materials.
2.3.8. Costs
A range of costs associated with osteoarthritis and its treatment are incorporated into AUS-OA, including the costs of surgical hospital admissions, both primary and revisions, rehabilitation costs at home or inpatient, and primary care costs that are captured by the Medical Benefits Scheme (MBS) and the Pharmaceutical Benefits Scheme (PBS). A full list of cost inputs is provided in the Supplementary materials (see Table 2). All costs are in Australian dollars. AUS-OA can provide economic evaluations from different perspectives, including from a government, health payer or consumer perspective, however at present wider societal costs such as productivity costs and costs borne by carers are not included in the model. The modelling framework allows these to be incorporated at a later date. A discount rate of 5 per cent is applied to costs and outcomes as per standard Australian health technology assessment guidelines (Medical Services Advisory Committee, 2021).
Key dynamics within AUS-OA.
| Variable | Model | Key covariates | Data | Source |
|---|---|---|---|---|
| BMI | Multivariate regression | Age, sex, SEP BMI | NHS | Hayes et al., 2019 |
| OA incidence | Logistic regression | Age, sex, SEP BMI | HILDA | Author’s own – see Supplementary materials |
| OA progression | Logistic regression | Age, sex, BMI | OAI | Author’s own |
| Mental health | Calibration | Sex | HILDA, NHS | Author’s own |
| Other comorbidities | Calibration | Age, sex | HILDA, NHS | Author’s own |
| TKR incidence | Fine and Gray competing risks | Ae, sex, BMI, mental health, previous TKR, KL score | Linked primary care and AOANJRR | Thuraisingam et al., 2022, modified for AUS-OA |
| TKR complication | Logistic regression | Age, sex, BMI, mental health, comorbidities, HRQOL | SMART Registry | Author’s own; |
| Inpatient rehabilitation | Logistic regression | Age, sex, BMI, mental health, comorbidities, HRQOL, complications | SMART Registry | Author’s own; |
| TKR revision | Weibull parametric regression | Age, sex, BMI | AOANJRR | AOA bespoke request 2024 |
| Death | Life tables; standardised mortality ratios | Age, sex, BMI, SEP, TKR | NZJR, NHS | Zhou et al., 2023; Hayes et al., 2019 |
| HRQOL decrements | Various | Age, sex, BMI, KL score, comorbidities | HILDA, OAI | Author’s own; Carrello et al. (2021), Wilson and Abbott (2018) |
| HRQOL after surgery | Multivariate regression | Age, sex, BMI, comorbidities | SMART | Author’s own, based on Schilling et al. (2017) (Schilling et al., 2017) |
-
AOA = Australian Orthopaedic Association; AOANJRR = Australian Orthopaedic Association National Joint Replacement Registry; BMI = Body mass index; HILDA = Household Income and Labour Dynamics of Australia; HRQOL = Health-related quality of life; KL = Kellgren-Lawrence; NZJR = New Zealand Joint Register; NHS = National Health Survey; OA = osteoarthritis; OAI = Osteoarthritis Initiative; SEP = socio-economic position as proxied by completion of year 12; TKR = Total knee replacement
3. Validation of AUS-OA
3.1. Internal validation
Validation is not a simple check-box exercise or unified process, nor is there one single way of validating a complex dynamic microsimulation model (Kaye-Blake et al., 2014). For AUS-OA, we have conducted a systematic set of validation exercises to build trust in the model. First, internal validation was conducted by reproducing the model in two software languages: R and Matlab, and by two coders, and comparing simulation outputs. A range of shocks were imposed in the model and results tested to confirm that AUS-OA was working as expected. For example, a sharp increase in BMI was modelled, to confirm that an increase in a key risk factor for osteoarthritis led to higher rate of disease incidence and progression; higher rates of osteoarthritis progression were tested to confirm that the AUS-OA then predicted a higher rate of TKR.
3.2. External validation
Following the internal validation, AUS-OA simulations for 2013 to 2022 were compared with observed data from National Health Surveys for BMI and osteoarthritis (Australian Bureau of Statistics, 2022), and national registry data for rates of TKR per 100,000 population (AOANJRR, 2022). Some model dynamics were then calibrated to improve the accuracy of the AUS-OA simulations (see Supplementary materials Figures 1–3). In general the AUS-OA model adequately captures the trends in these variables, however one area of is inconsistency is the higher level of overweight and obese in 75+ aged cohort, particularly for women, in AUS-OA relative to the National Health Surveys.

AUS-OA (simulated) versus National Health Survey (observed) rates of overweight and obese, by age and sex categories, 2013 to 2022.
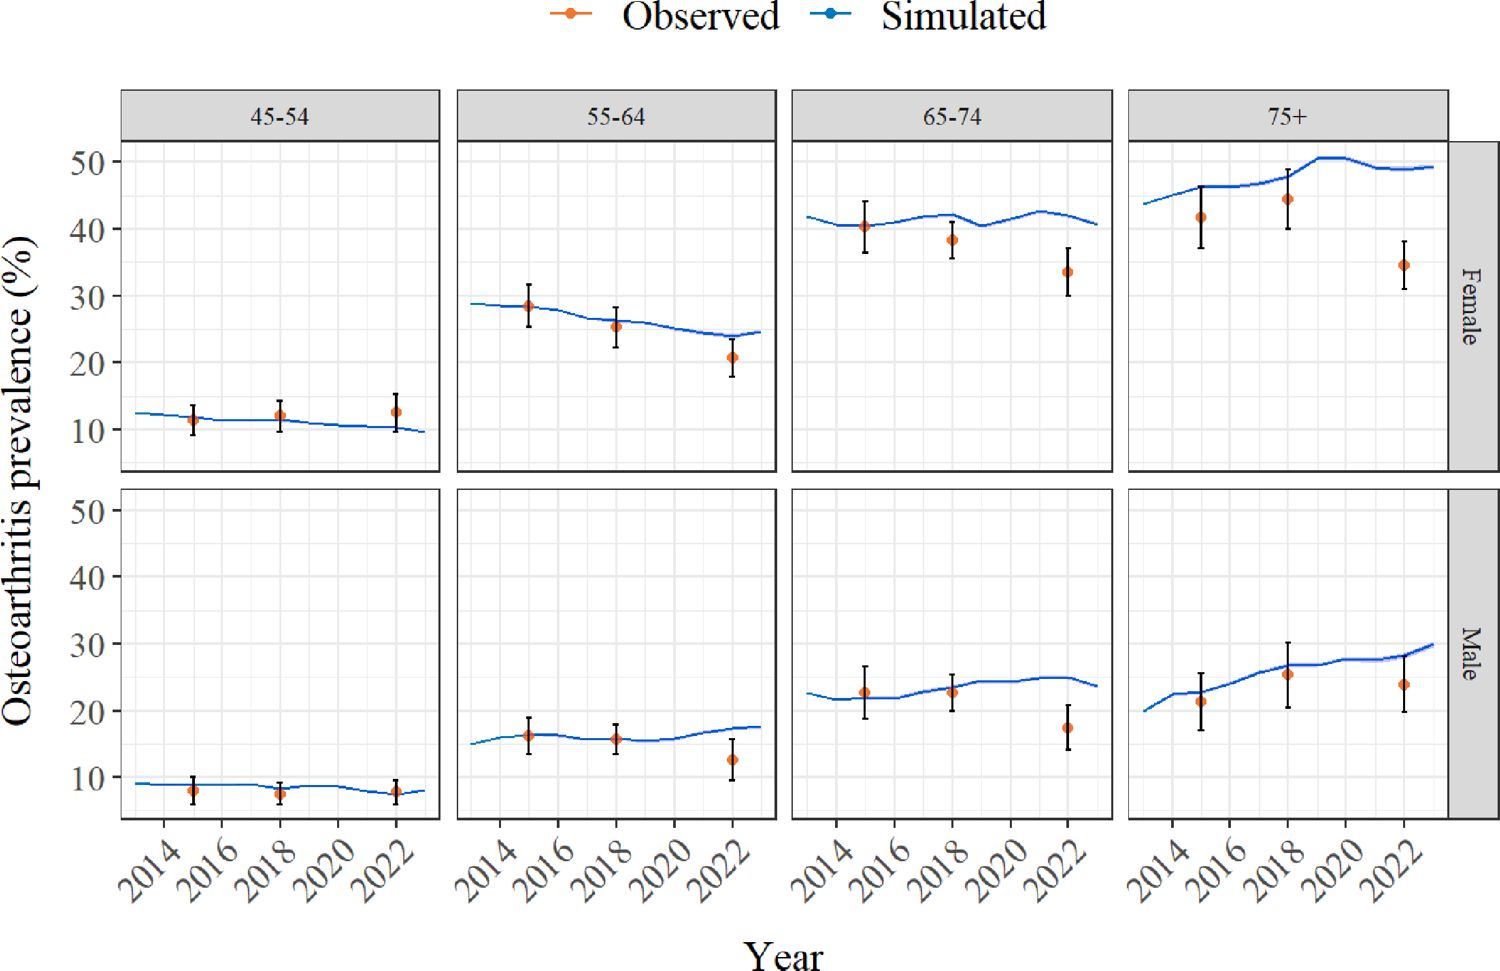
AUS-OA (simulated) versus National Health Survey (observed) prevalence of osteoarthritis, by age and sex categories, 2013 to 2022.
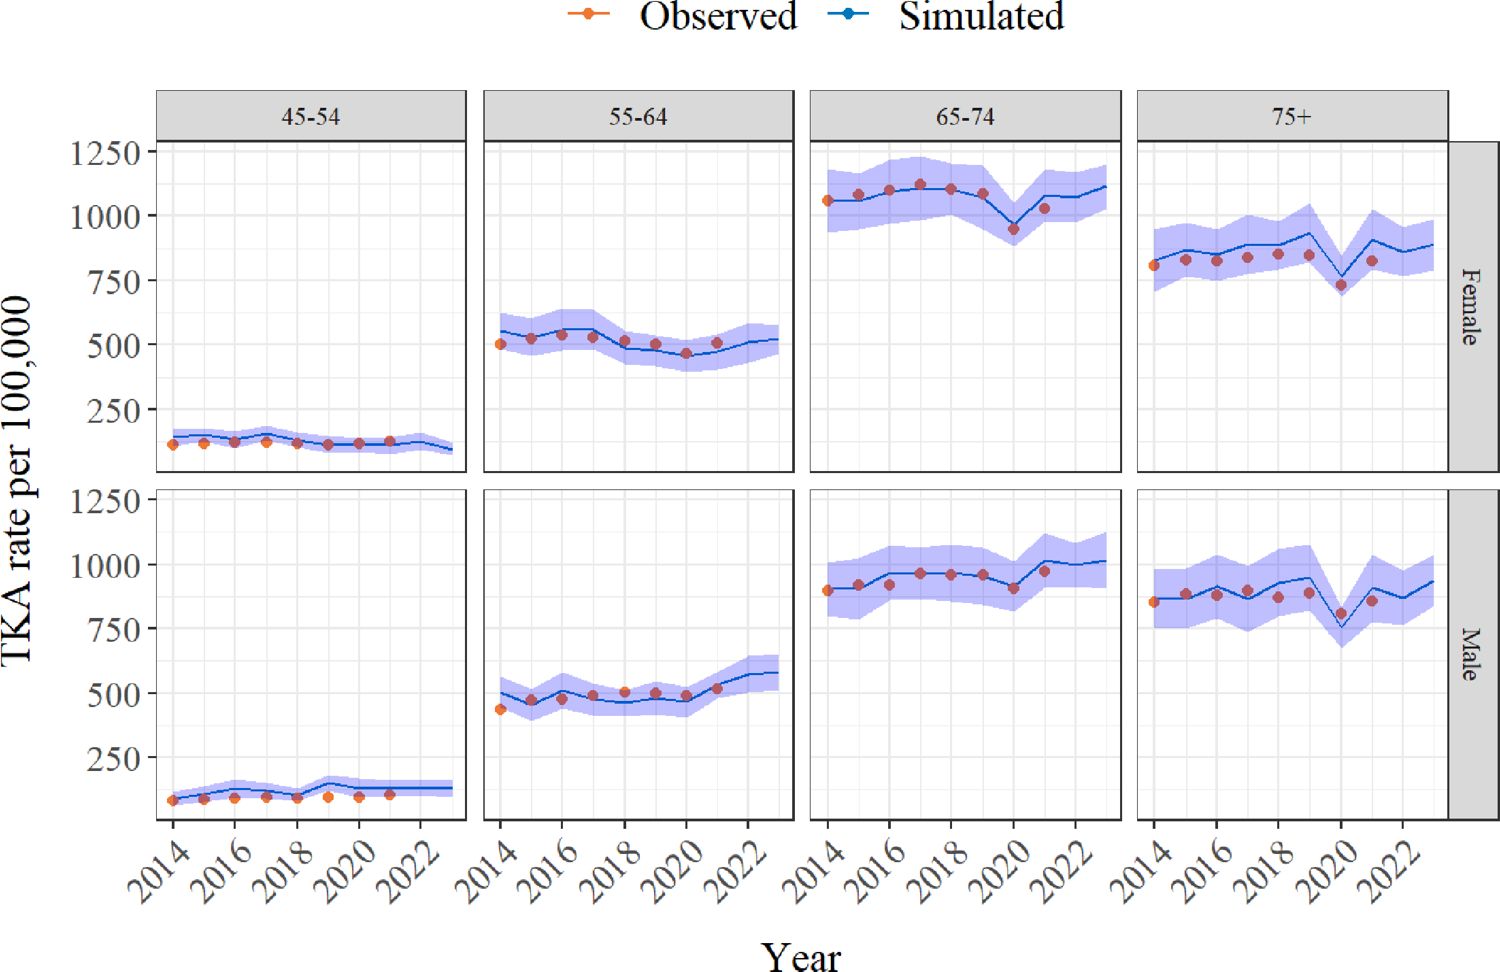
AUS-OA (simulated) versus AOANJRR (observed) rates of TKR by 100,000 population, by age and sex categories, 2013 to 2022.
4. Application of AUS-OA: evaluation of the SMART Choice decision support tool
4.1. Application
As an example application, we used AUS-OA to complete a model-based economic evaluation of a novel decision support tool, SMART Choice, to improve patient selection into surgery. Both the SMART Choice tool and the randomised control trial (RCT) to evaluate it are detailed elsewhere (Zhou et al., 2023; Zhou et al., 2022; Zhou et al., 2024), but in short the tool provides a prediction for outcomes from surgery based on an individual’s age, gender, pain and functional impairment. The RCT found that the SMART Choice tool reduced patient preference for surgery in a cohort unlikely to benefit (OR 0.46, 95% CI 0.20-1.03, p value 0.06, Zhou et al., 2024).
4.2. Economic evaluation
We completed a cost-utility analysis from a health funder perspective. We compare costs and HRQOL outcomes under a scenario where 3 per cent (sensitivity test 1 and 5 per cent) of those with osteoarthritis and a preference for surgery use SMART Choice, versus the status quo baseline without SMART Choice. The mechanism through which the tool delivers benefit is by improving the mix of patients receiving TKRs. The impact of SMART Choice is modelled by applying the odds ratio observed in the trial to the rate of surgeries in those unlikely to benefit (Zhou et al., 2024). The decision support tool is not an active treatment that would be expected to alter the progression of osteoarthritis, and there are large waiting lists for surgery, so it is unlikely to reduce overall numbers of TKR in any given year. We therefore offset the lower rates of TKR in those unlikely to benefit by an increase in the rate of TKRs for those likely to benefit. The costs of SMART Choice are largely sunk in the development of the web-based tool, however we consider annual operational costs of $150,000 to cover website hosting and maintenance. We compute an incremental cost effectiveness ratio (ICER) and assess cost-effectiveness relative to a common threshold of $50,000 per QALY (Wang et al., 2018). We simulate the analysis 100 times over 10 years, discounting both costs and HRQOL outcomes at 5 per cent.
4.3. Results of model-based economic evaluation
The cost-effectiveness results are shown in Table 3 and a cost-effectiveness plane is shown in the Supplementary materials. On average, the results suggest that SMART Choice delivers an increase in population QALYs because of improved patient selection into surgery, resulting in a highly cost-effective ICER of $243 per QALY. Note that the incremental costs are lower than the direct costs of the intervention as the improved patient mix also results in reduced costs due to lower rates of complications and inpatient rehabilitation. In sensitivity analysis, the ICER falls to $84 per QALY if 5 per cent of the surgical population use SMART Choice; conversely the ICER increases to $1,039 if only 1 per cent use it.
Cost effectiveness of SMART Choice
| Use of SMART Choice in surgical population | Increment costs | Incremental QALYs | Incremental Cost/QALY |
|---|---|---|---|
| Baseline – 3% | $707,918 | 2,910 | $243 |
| 1% | $1,008,146 | 970 | $1,039 |
| 5% | $407,691 | 4,850 | $84 |
5. Conclusion
5.1. Strengths and limitations
AUS-OA combines research about the epidemiology and health economics of osteoarthritis and its treatments, into a consistent and repeatable analytical framework. This allows testing of policy changes, improvements to models of care and development of innovative treatments. In general, the data underpinning the model is from high quality datasets and research, including long-running longitudinal surveys and registries, meta-analyses, and bespoke analysis. A number of verification and validation exercises have been conducted to gain trust in the model, including coding the model in two languages by different coders. The R version of the model is publicly available through a GITHUB repository.
Importantly, AUS-OA includes key risk factors associated with osteoarthritis, particularly age, sex, and BMI. However, we also note that other risk factors for osteoarthritis such as injury are not currently included. There is also uncertainty in the population trends for key variables, and bias in the self-reported BMI data for HILDA and the 2022 NHS, which moved to self-report post pandemic. Both BMI distributions and osteoarthritis prevalence rates have tended to fluctuate in the national survey data over the last decade. We have provided a range of validation graphs to highlight how AUS-OA compares to observed population results, but there is uncertainty as to how accurate our baseline projections will be. We note that AUS-OA overestimates the prevalence of osteoarthritis relative to the 2022 health survey, and as a result, economic evaluations of interventions targeting this older cohort may overestimate the size of the population, and potentially the benefit form the intervention.
5.2. Potential applications and future improvements
There are two major applications of AUS-OA currently planned:
Incorporation of further differences for priority cohorts including Aboriginal and Torres Strait Islander peoples, and culturally and linguistically diverse populations. We plan to extend the current parameters and dynamics to capture differences in these populations, which will allow us to evaluate the equity of new policies and interventions.
Inclusion of further early risk factors for osteoarthritis, such as injury and microtears, to allow AUS-OA to model the costs and benefits of interventions earlier on in the disease pathway. We are currently supporting a trial of a novel stem-cell therapy that has the potential to alter the disease trajectory of osteoarthritis. AUS-OA will be used to provide analysis of the likely cost-effectiveness of such interventions, and to highlight areas where further improvements are necessary.
Further improvements to the model will be driven by our end-users in policy and government. These may include but are not limited to:
Further regional disaggregation to capture differences across locations, and allow policy simulations around consolidation of health service providers;
More detail about surgery hospitalisations, including endogenizing length of stay and cost, to allow analysis of changes to hospital-level models of care;
Incorporation of productivity and wider societal costs of osteoarthritis. We know that these costs are substantial and important for decision-making; adding these will allow us to complete economic evaluations from a variety of perspectives.
Critically, we aim to keep the AUS-OA ‘open source’ and promote the use of synthetic data, so that the model can be widely used. Methodologically, we are also considering moving to a discrete event framework that would allow us to model time to event.
5.3. Summary
In conclusion, this paper introduces the AUS-OA dynamic microsimulation model of osteoarthritis and its treatment. The example provided highlights how AUS-OA can be used to evaluate interventions such as the SMART Choice decision support tool. We believe AUS-OA can provide a significant uplift in the capability and capacity for detailed analysis of current and emerging innovations to reduce the burden of osteoarthritis.
Footnotes
1.
While the burden of osteoarthritis tends to peak in older ages, innovative interventions such as lifestyle modifications, weight-loss and stem-cell therapy, can occur early in the life course.
References
-
1
The projected burden of primary total knee and hip replacement for osteoarthritis in Australia to the year 2030BMC Musculoskeletal Disorders 20:90.https://doi.org/10.1186/s12891-019-2411-9
- 2
-
3
3302.0.55.0001- Life tables, states, territories and Australia, 2011-2013https://www.abs.gov.au/AUSSTATS/abs%40.nsf/Lookup/3302.0.55.001Main%2BFeatures12011-2013%3FOpenDocument, Accessed, 11 November 2025.
-
4
Nationalhealth surveyhttps://www.abs.gov.au/statistics/health/health-conditions-and-risks/national-health-survey/latest-release#cite-window1, Accessed, 28 March 2024.
-
5
Osteoarthritishttps://www.aihw.gov.au/reports/chronic-musculoskeletal-conditions/osteoarthritis, Accessed, 14 December 2023.
-
6
Utility Decrements Associated with Adult Overweight and Obesity in Australia: A Systematic Review and Meta-AnalysisPharmacoEconomics 39:503–519.https://doi.org/10.1007/s40273-021-01004-x
-
7
Cohort profile: the St Vincent’s Melbourne Arthroplasty Outcomes (SMART) Registry, a pragmatic prospective database defining outcomes in total hip and knee replacement patientsBMJ Open 11:e040408.https://doi.org/10.1136/bmjopen-2020-040408
-
8
Socioeconomic inequalities in obesity: modelling future trends in AustraliaBMJ Open 9:e026525.https://doi.org/10.1136/bmjopen-2018-026525
-
9
Defining and predicting radiographic knee osteoarthritis progression: a systematic review of findings from the osteoarthritis initiativeKnee Surgery, Sports Traumatology, Arthroscopy 30:4015–4028.https://doi.org/10.1007/s00167-021-06768-5
-
10
Validation of an Agricultural MAS for Southland, New ZealandJournal of Artificial Societies and Social Simulation 17:5.https://doi.org/10.18564/jasss.2564
-
11
Microsimulation as a flexible tool to evaluate policies and their impact on socioeconomic inequalities in healthThe Lancet Regional Health. Europe 34:100758.https://doi.org/10.1016/j.lanepe.2023.100758
-
12
Development of a population-based microsimulation model of osteoarthritis in CanadaOsteoarthritis and Cartilage 18:303–311.https://doi.org/10.1016/j.joca.2009.10.010
-
13
Prediction models for the risk of total knee replacement: development and validation using data from multicentre cohort studiesThe Lancet. Rheumatology 4:e125–e134.https://doi.org/10.1016/s2665-9913(21)00324-6
-
14
Prevalence Trends of Site-Specific Osteoarthritis From 1990 to 2019: Findings From the Global Burden of Disease Study 2019Arthritis & Rheumatology 74:1172–1183.https://doi.org/10.1002/art.42089
-
15
Impact of obesity and knee osteoarthritis on morbidity and mortality in older AmericansAnnals of Internal Medicine 154:217–226.https://doi.org/10.7326/0003-4819-154-4-201102150-00001
-
16
MathWorks Store, version 9.13.0 (R2022b)MathWork.
-
17
Guidelinesfor preparing assessments for the Medical Services Advisory Committee version1.0 May 2021http://www.msac.gov.au/internet/msac/publishing.nsf/Content/E0D4E4EDDE91EAC8CA2586E0007AFC75/$File/MSAC%20Guidelines-complete-16-FINAL(18May21).pdf, Accessed, 30 August 2024.
-
18
HILDA surveyhttps://melbourneinstitute.unimelb.edu.au/hilda, Accessed, 9 February 2024.
- 19
-
20
R:A language and environment for statistical computing. Vienna: R Foundation forStatistical ComputingR:A language and environment for statistical computing. Vienna: R Foundation forStatistical Computing, https://www.R-project.org.
-
21
Predicting the Long-Term Gains in Health-Related Quality of Life After Total Knee ArthroplastyThe Journal of Arthroplasty 32:395–401.https://doi.org/10.1016/j.arth.2016.07.036
-
22
Multiple chronic health conditions and their link with wealth assetsEuropean Journal of Public Health 25:285–289.https://doi.org/10.1093/eurpub/cku134
-
23
A Brief, Global History of Microsimulation Models in Health: Past Applications, Lessons Learned and Future DirectionsInternational Journal of Microsimulation 11:97–142.https://doi.org/10.34196/ijm.00175
-
24
https://doi.org/10.25310/YWQZ9375Hip, knee and shoulder arthroplasty: 2023 annual report, Australian Orthopaedic Association National Joint Replacement Registry.
-
25
Simulation of synthetic complex data: The R package simPopJ Stat Soft 79:1–38.https://doi.org/10.18637/jss.v079.i10
-
26
Sydney researchers awarded $47 million for medical researchhttps://www.sydney.edu.au/news-opinion/news/2023/03/14/sydney-researchers-awarded--47-million-for-medical-research.html, Accessed, 28 March 2024.
-
27
Developing and internally validating a prediction model for total knee replacement surgery in patients with osteoarthritisOsteoarthritis and Cartilage Open 4:100281.https://doi.org/10.1016/j.ocarto.2022.100281
-
28
Comparing the ICERs in Medicine Reimbursement Submissions to NICE and PBAC-Does the Presence of an Explicit Threshold Affect the ICER Proposed?Value in Health 21:938–943.https://doi.org/10.1016/j.jval.2018.01.017
-
29
Stem cell research funded $7m to prevent joint deformity, enable cartilage regeneration and improve carehttps://mdhs.unimelb.edu.au/news-and-events/news-archive/stem-cell-research-funded-$7m-to-prevent-joint-deformity,-enable-cartilage-regeneration-and-improve-care, Accessed, 28 March 2024.
-
30
Development and validation of a new population-based simulation model of osteoarthritis in New ZealandOsteoarthritis and Cartilage 26:531–539.https://doi.org/10.1016/j.joca.2018.01.004
-
31
Radiographic knee osteoarthritis impacts multiple dimensions of health-related quality of life: data from the Osteoarthritis InitiativeRheumatology (Oxford, England) 57:891–899.https://doi.org/10.1093/rheumatology/key008
-
32
The HILDA Survey and its Contribution to Economic and Social Research (So Far)*Economic Record 83:208–231.https://doi.org/10.1111/j.1475-4932.2007.00395.x
-
33
Evaluating willingness for surgery using the SMART Choice (Knee) patient prognostic tool for total knee arthroplasty: study protocol for a pragmatic randomised controlled trialBMC Musculoskeletal Disorders 23:179.https://doi.org/10.1186/s12891-022-05123-0
-
34
SMART choice (knee) tool: a patient-focused predictive model to predict improvement in health-related quality of life after total knee arthroplastyANZ Journal of Surgery 93:316–327.https://doi.org/10.1111/ans.18250
-
35
Assessing the Mortality Rate After Primary Total Knee Arthroplasty: An Observational Study to Inform Future Economic AnalysisThe Journal of Arthroplasty 38:2328–2335.https://doi.org/10.1016/j.arth.2023.05.070
-
36
Predictive Tool Use and Willingness for Surgery in Patients With Knee Osteoarthritis: A Randomized Clinical TrialJAMA Network Open 7:e240890.https://doi.org/10.1001/jamanetworkopen.2024.0890
-
37
The Evaluation of Health Policies through Microsimulation MethodsHEDG, c/o Department of Economics, University of York.
Article and author information
Author details
Sharmala Thuraisingam

Funding
The authors wish to acknowledge the HCF Research Foundation that supported the initial development and randomised control trial of the SMART Choice tool that is evaluated in this paper; the support of the University of Melbourne Faculty of Medicine, Dentistry and Health Sciences EMCR Catalyst grant which supported development of some AUS-OA parameters; and the support of ARISTOCRAT, a Medical Research Future Fund grant (GTN2017213).
Acknowledgements
The AUS-OA model uses parameters derived from a number of datasets, data linkages and research programs. We acknowledge and thank these studies here, including but not limited to: the Australian Orthopaedic Association National Joint Replacement Registry; St Vincent’s Melbourne Arthroplasty registry and associated Medicare Benefits Schedule and Pharmaceutical Benefits Scheme data linkage facilitated by the Australian Institute of Health and Welfare, the Osteoarthritis Initiative, and the Household Income and Labour Dynamics of Australia study.
Publication history
- Version of Record published: April 30, 2025 (version 1)
Copyright
© 2025, Knight
This article is distributed under the terms of the Creative Commons Attribution License, which permits unrestricted use and redistribution provided that the original author and source are credited.