The development of AUS-OA - a population health economic model of osteoarthritis in Australia
Chris Schilling, Yushy Zhou, Siddharth Rele, Cade Shadbolt, Sharmala Thuraisingam, Penny O’Brien, Josh Knight, Nabeeh Zakariyya, Michelle Dowsey, Peter Choong
Department of Surgery, The University of Melbourne, St Vincent’s Hospital, Melbourne, Australia; Simulation modelling and health economics of chronic disease unit, The University of Melbourne, Carlton, Australia
Cite as: C. Schilling, Y. Zhou, S. Rele, C. Shadbolt, S. Thuraisingam, P. O’Brien, J. Knight, N. Zakariyya, M. Dowsey, P. Choong; 2025; The development of AUS-OA - a population health economic model of osteoarthritis in Australia; International Journal of Microsimulation; 18(1); 84–94. doi: 10.34196/ijm.00317
Abstract
Simulation modelling is a powerful tool for assessing the impact of diseases and guiding healthcare policy decisions. This paper introduces AUS-OA, a dynamic discrete time microsimulation model of osteoarthritis and its treatment in Australia. AUS-OA aims to provide policy makers and researchers with increased capacity to evaluate the burden and treatment of osteoarthritis across Australia. AUS-OA uses a synthetic base population of individuals with age, sex, Body Mass Index (BMI), osteoarthritis and other attributes weighted to the Australian population. Body mass index, osteoarthritis incidence and progression, primary and revision joint replacement are modelled over time based on econometric equations derived from linked and longitudinal data. Costs and health-related quality of life outcomes are then assigned based on an individual’s health conditions and treatments. AUS-OA is calibrated with observed data between 2013 and 2022. Base case and ‘what-if’ scenarios can then be simulated from 2023. For an initial application, AUS-OA was used for an economic evaluation of a decision support tool, SMART Choice, that improves patient selection into surgery. Comparisons of univariate and bivariate distributions across key population attributions such as BMI, osteoarthritis and joint replacement between the synthetic and actual populations highlight that the AUS-OA model accurately reflects the Australian population over the calibration period. The evaluation of the SMART Choice decision support tool highlighted that the tool is cost-effective. AUS-OA provides a robust analytical framework for evaluating the long-term, population-level impact of osteoarthritis and its treatments.
This article contains 3 figures and 3 tables.
Figures
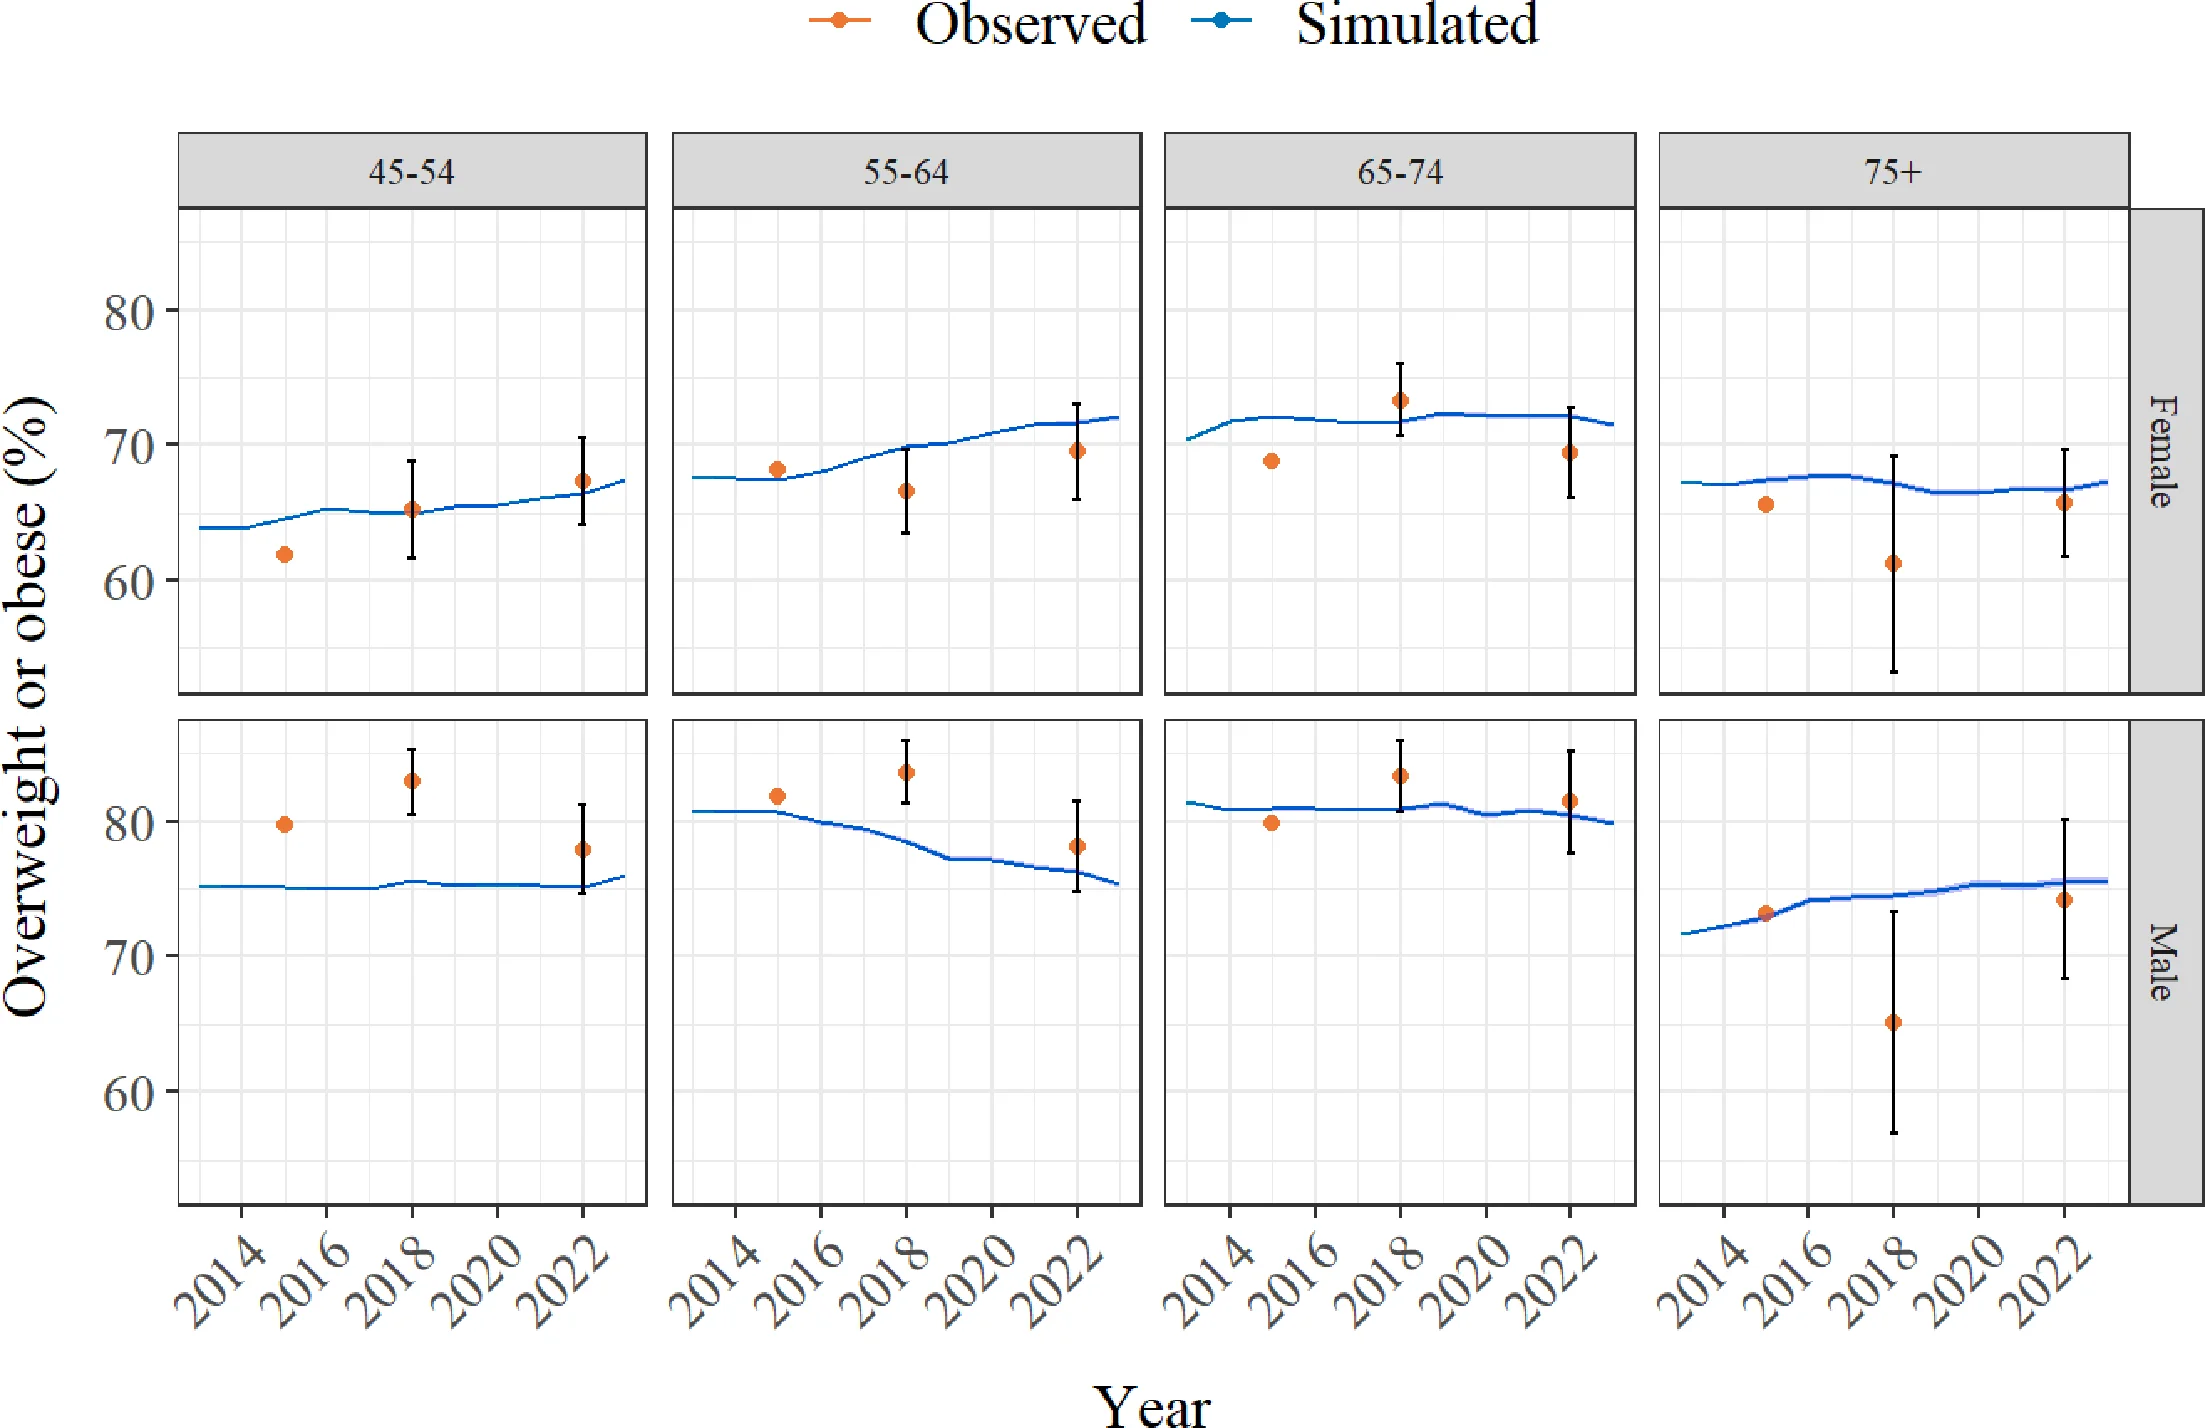
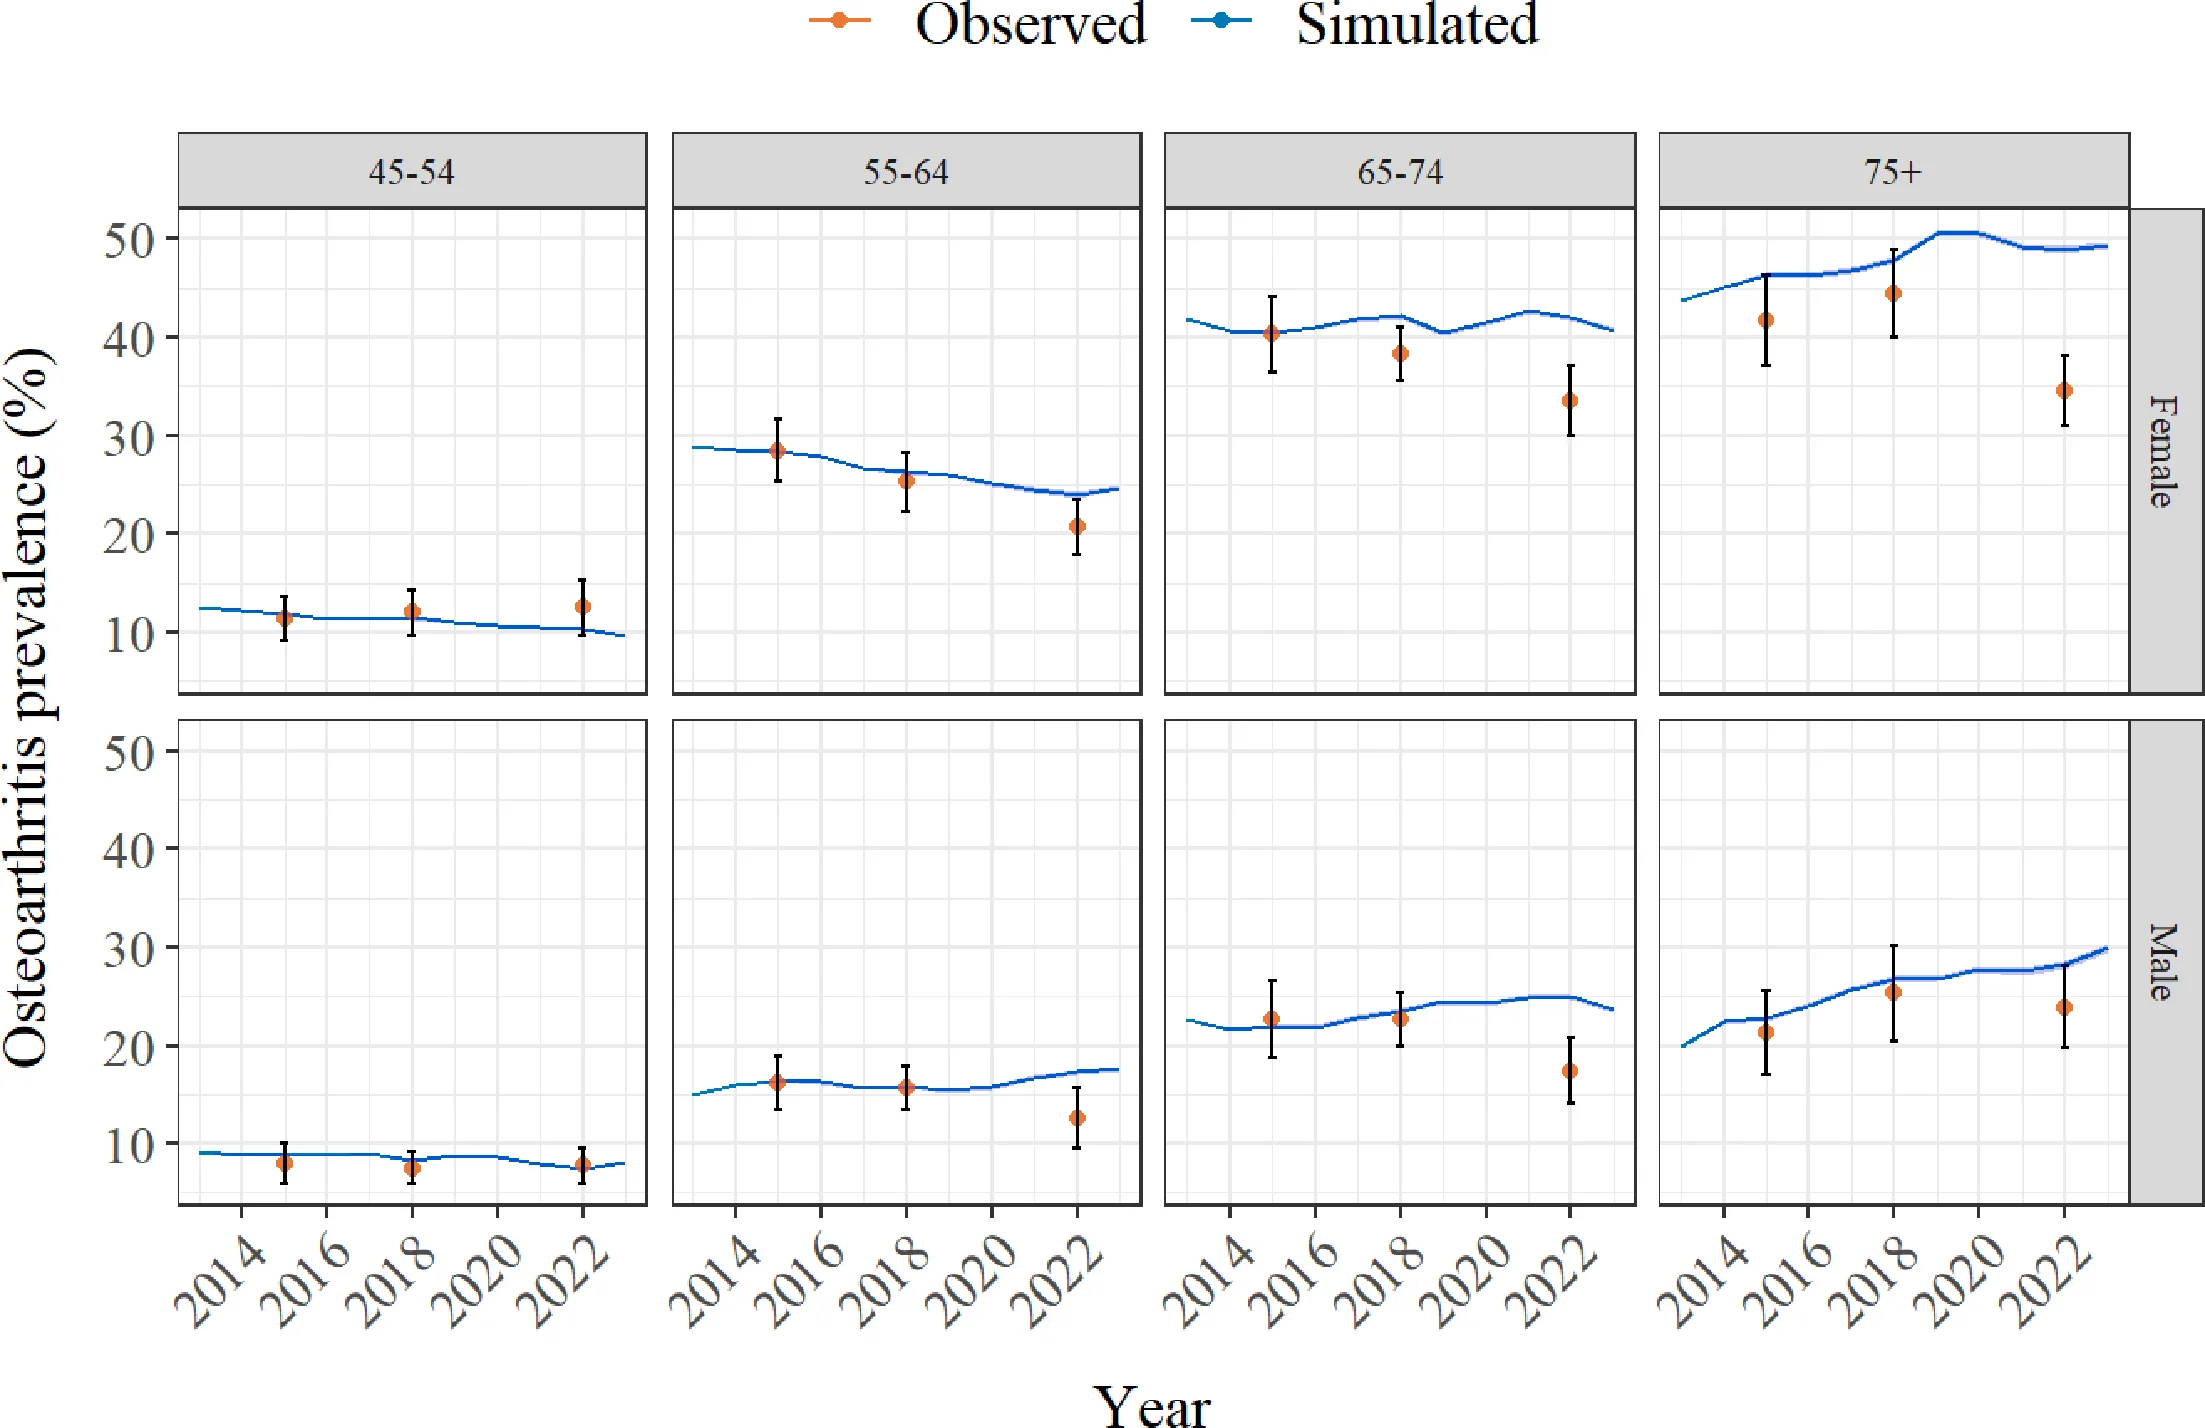
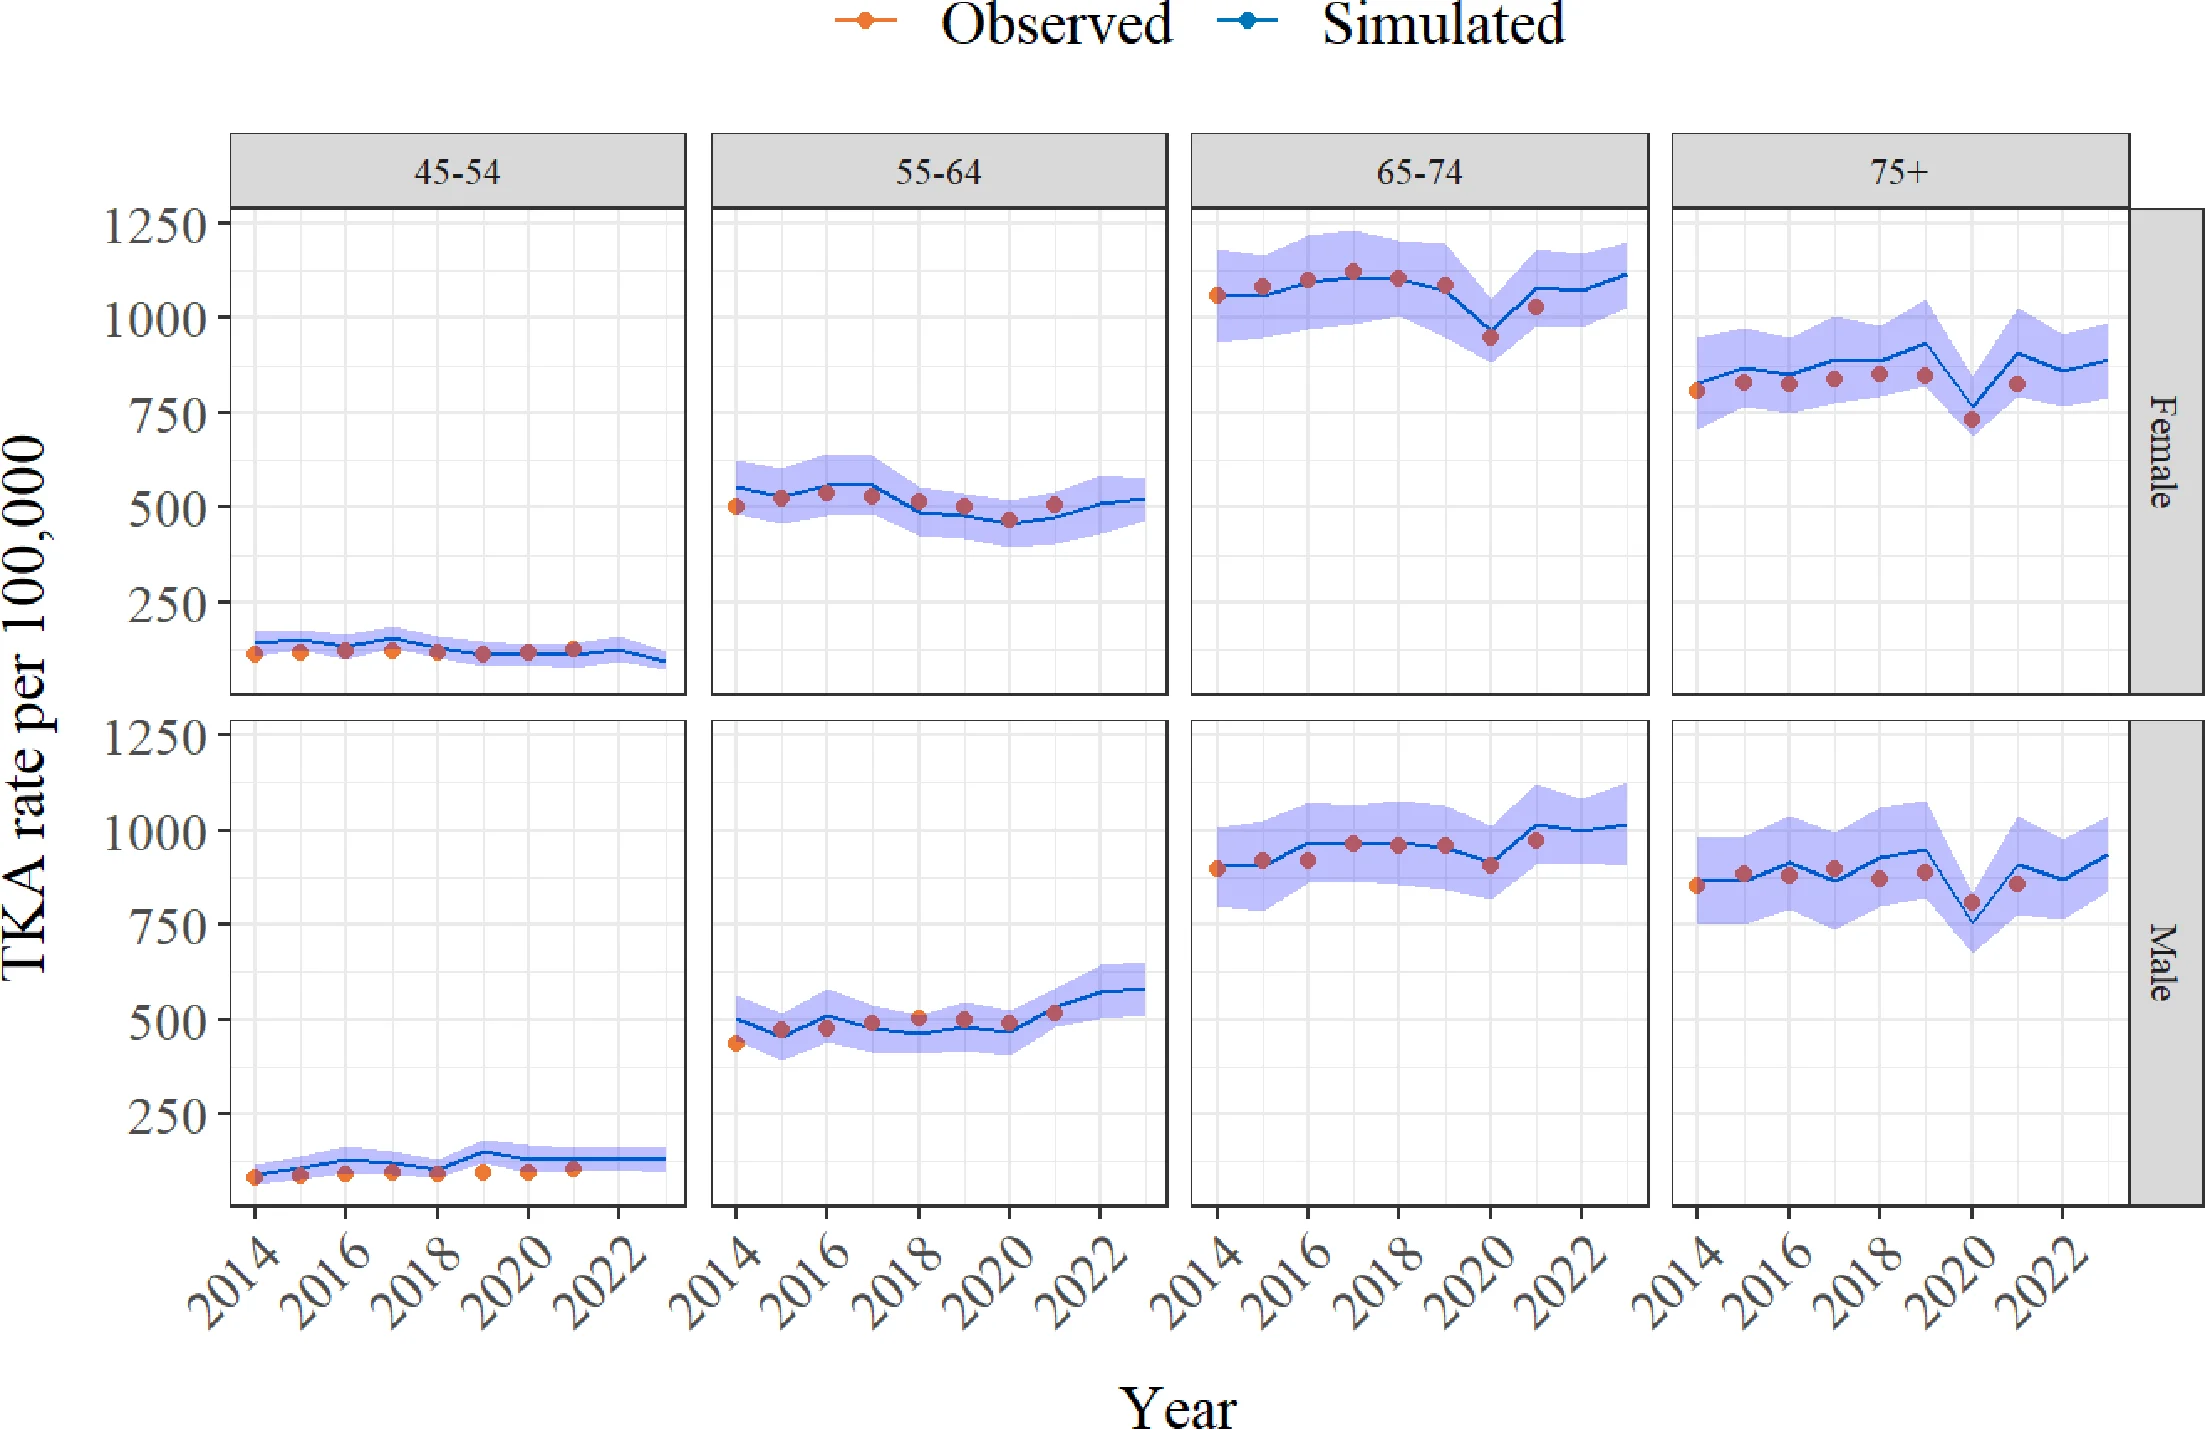
Figure 1. AUS-OA (simulated) versus National Health Survey (observed) rates of overweight and obese, by age and sex categories, 2013 to 2022.Figure 2. AUS-OA (simulated) versus National Health Survey (observed) prevalence of osteoarthritis, by age and sex categories, 2013 to 2022.Figure 3. AUS-OA (simulated) versus AOANJRR (observed) rates of TKR by 100,000 population, by age and sex categories, 2013 to 2022.
Tables
Table 1. Key variables tracked within the model.
Domain
Variable
Socio-demographics
Age, gender, socio-economic position, private health insurance, state
Risk factors
BMI, mental illness, comorbidities
Outcomes
Osteoarthritis, health-related quality of life, costs
Treatments
Osteoarthritis medications, primary care health, joint replacement and revisions
AOA = Australian Orthopaedic Association; AOANJRR = Australian Orthopaedic Association National Joint Replacement Registry; BMI = Body mass index; HILDA = Household Income and Labour Dynamics of Australia; HRQOL = Health-related quality of life; KL = Kellgren-Lawrence; NZJR = New Zealand Joint Register; NHS = National Health Survey; OA = osteoarthritis; OAI = Osteoarthritis Initiative; SEP = socio-economic position as proxied by completion of year 12; TKR = Total knee replacement