
This article contains 24 figures and 2 tables.
Figures
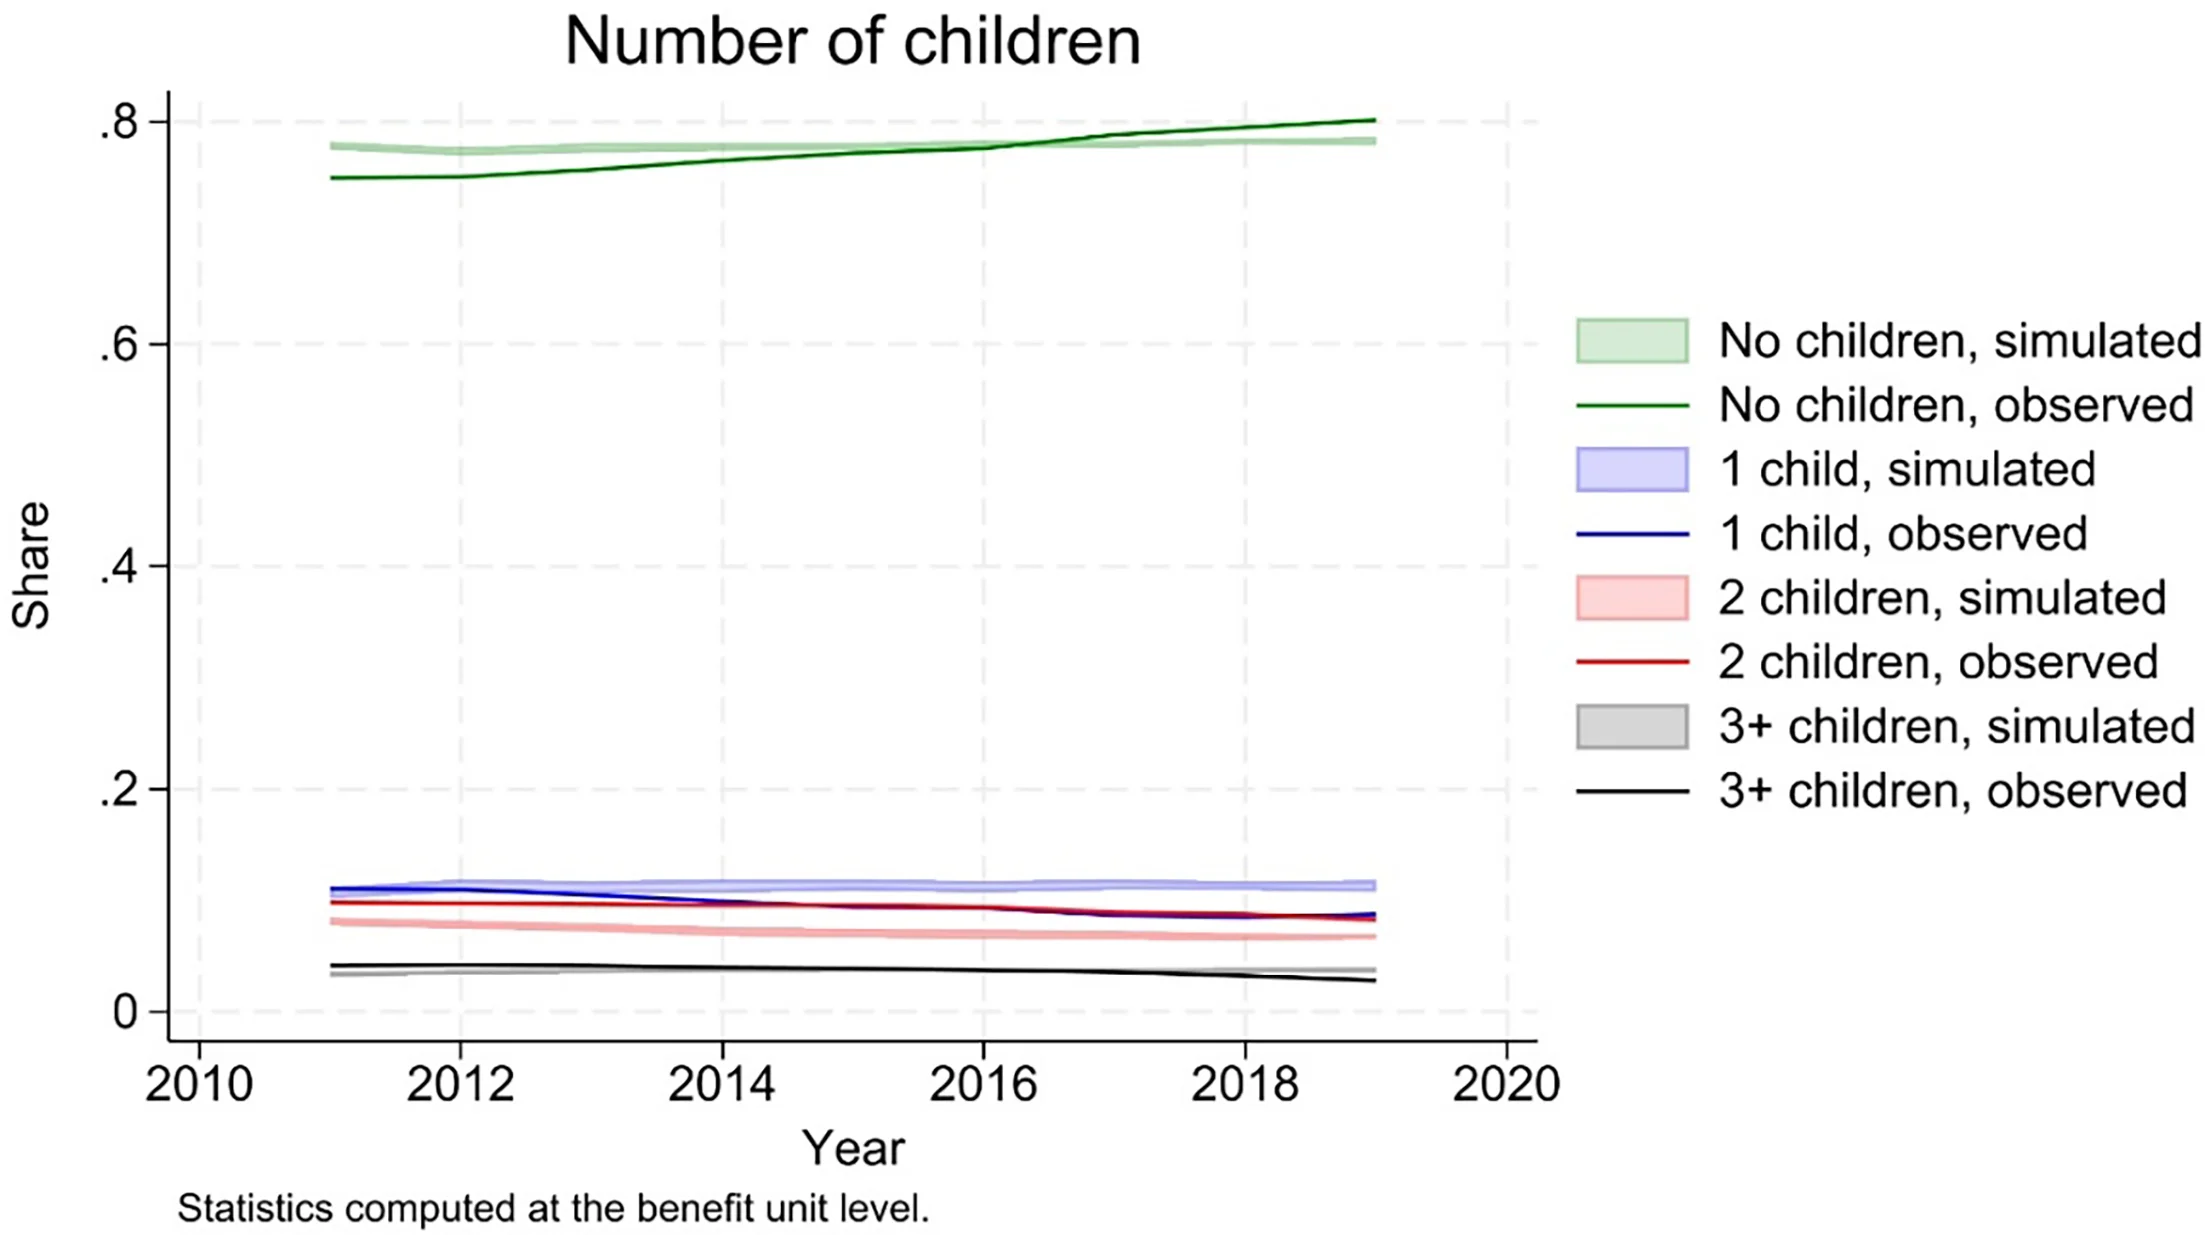
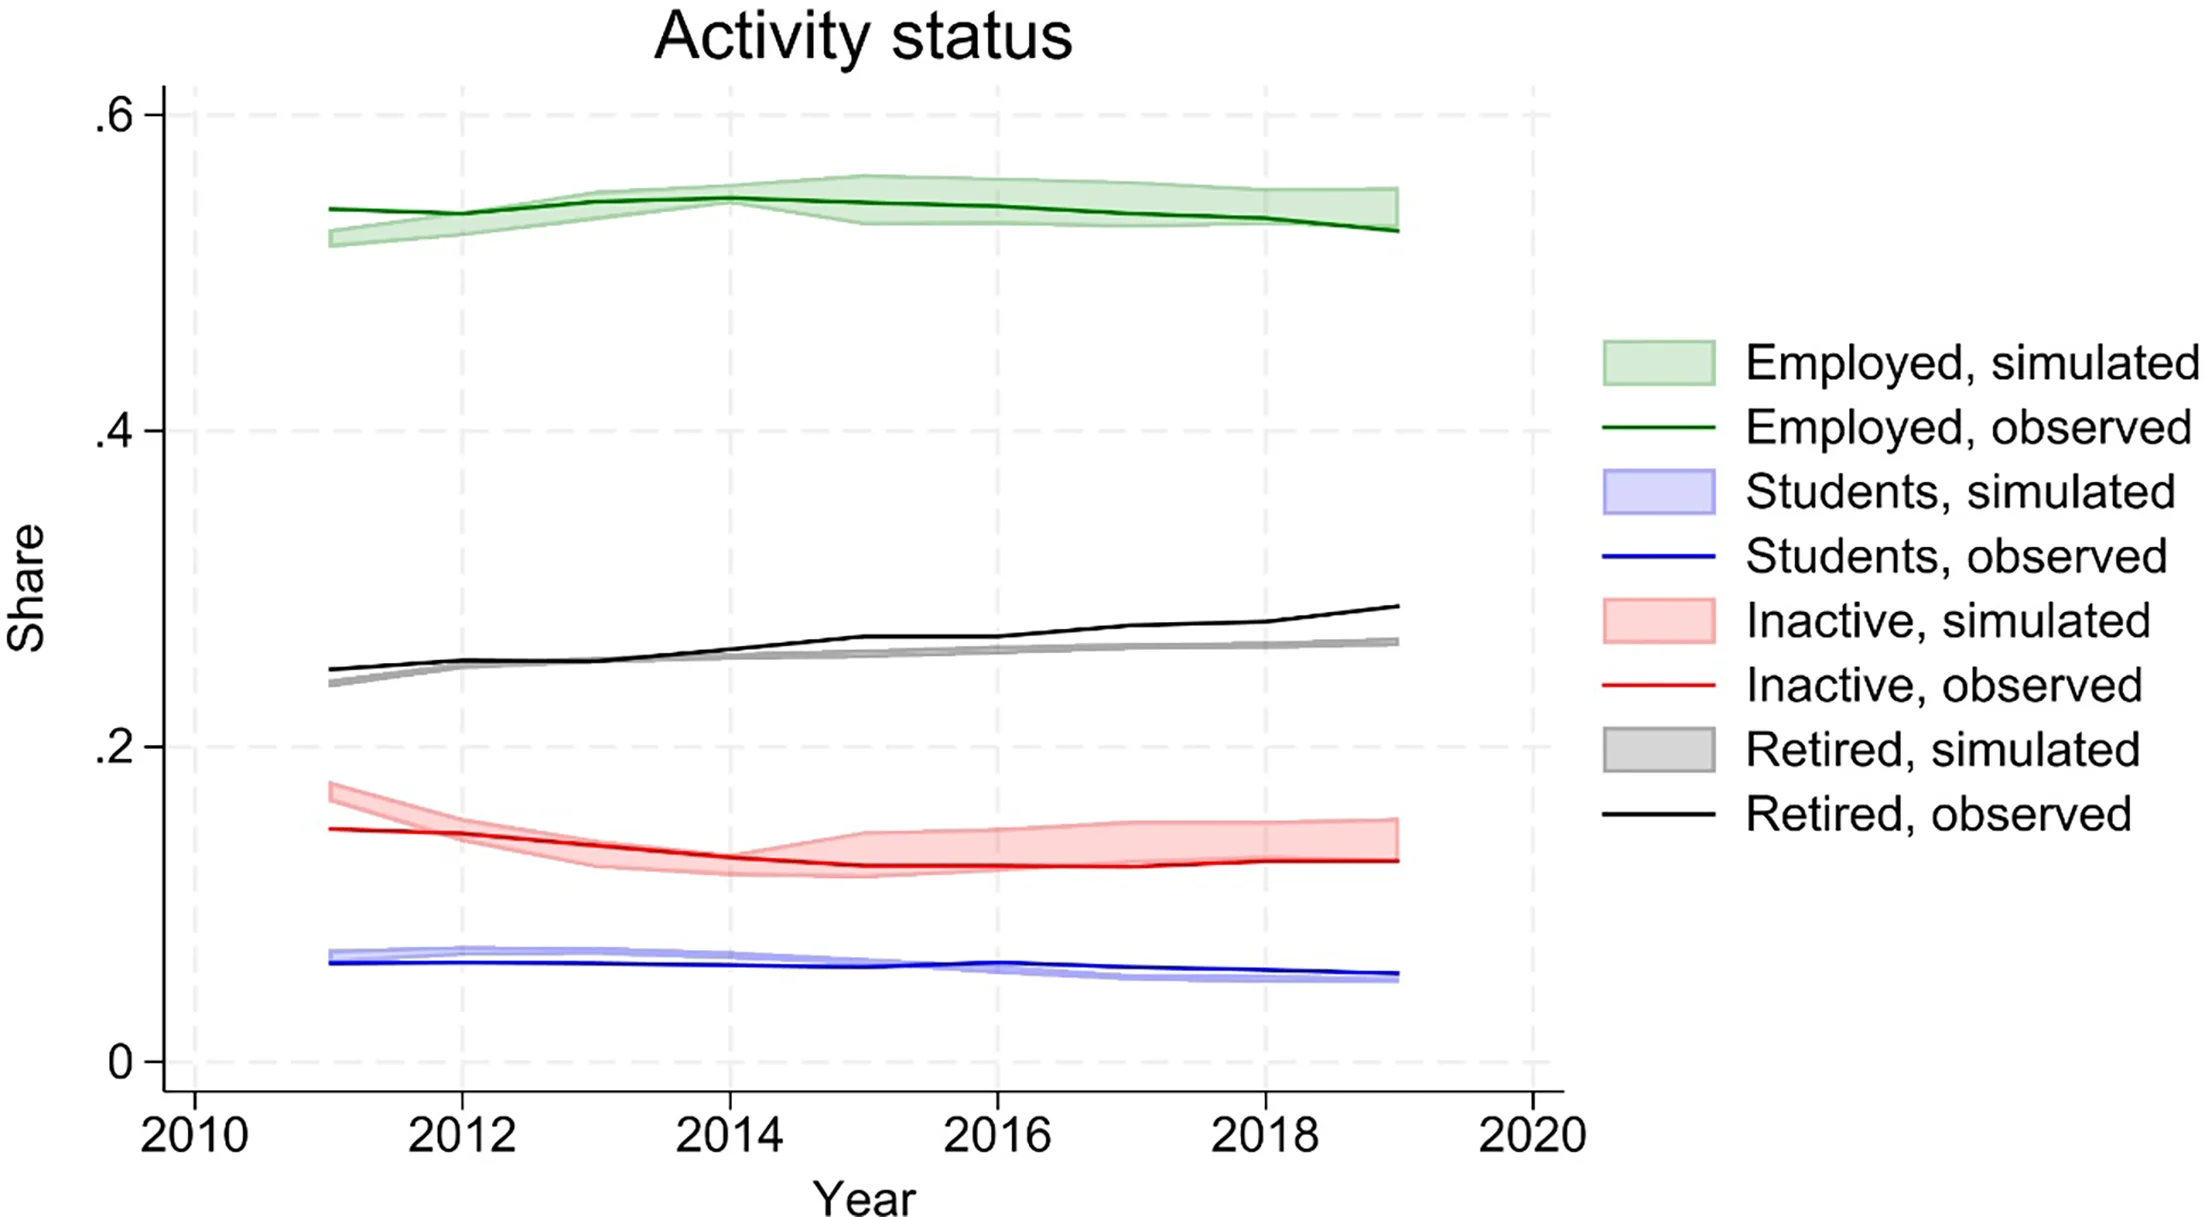
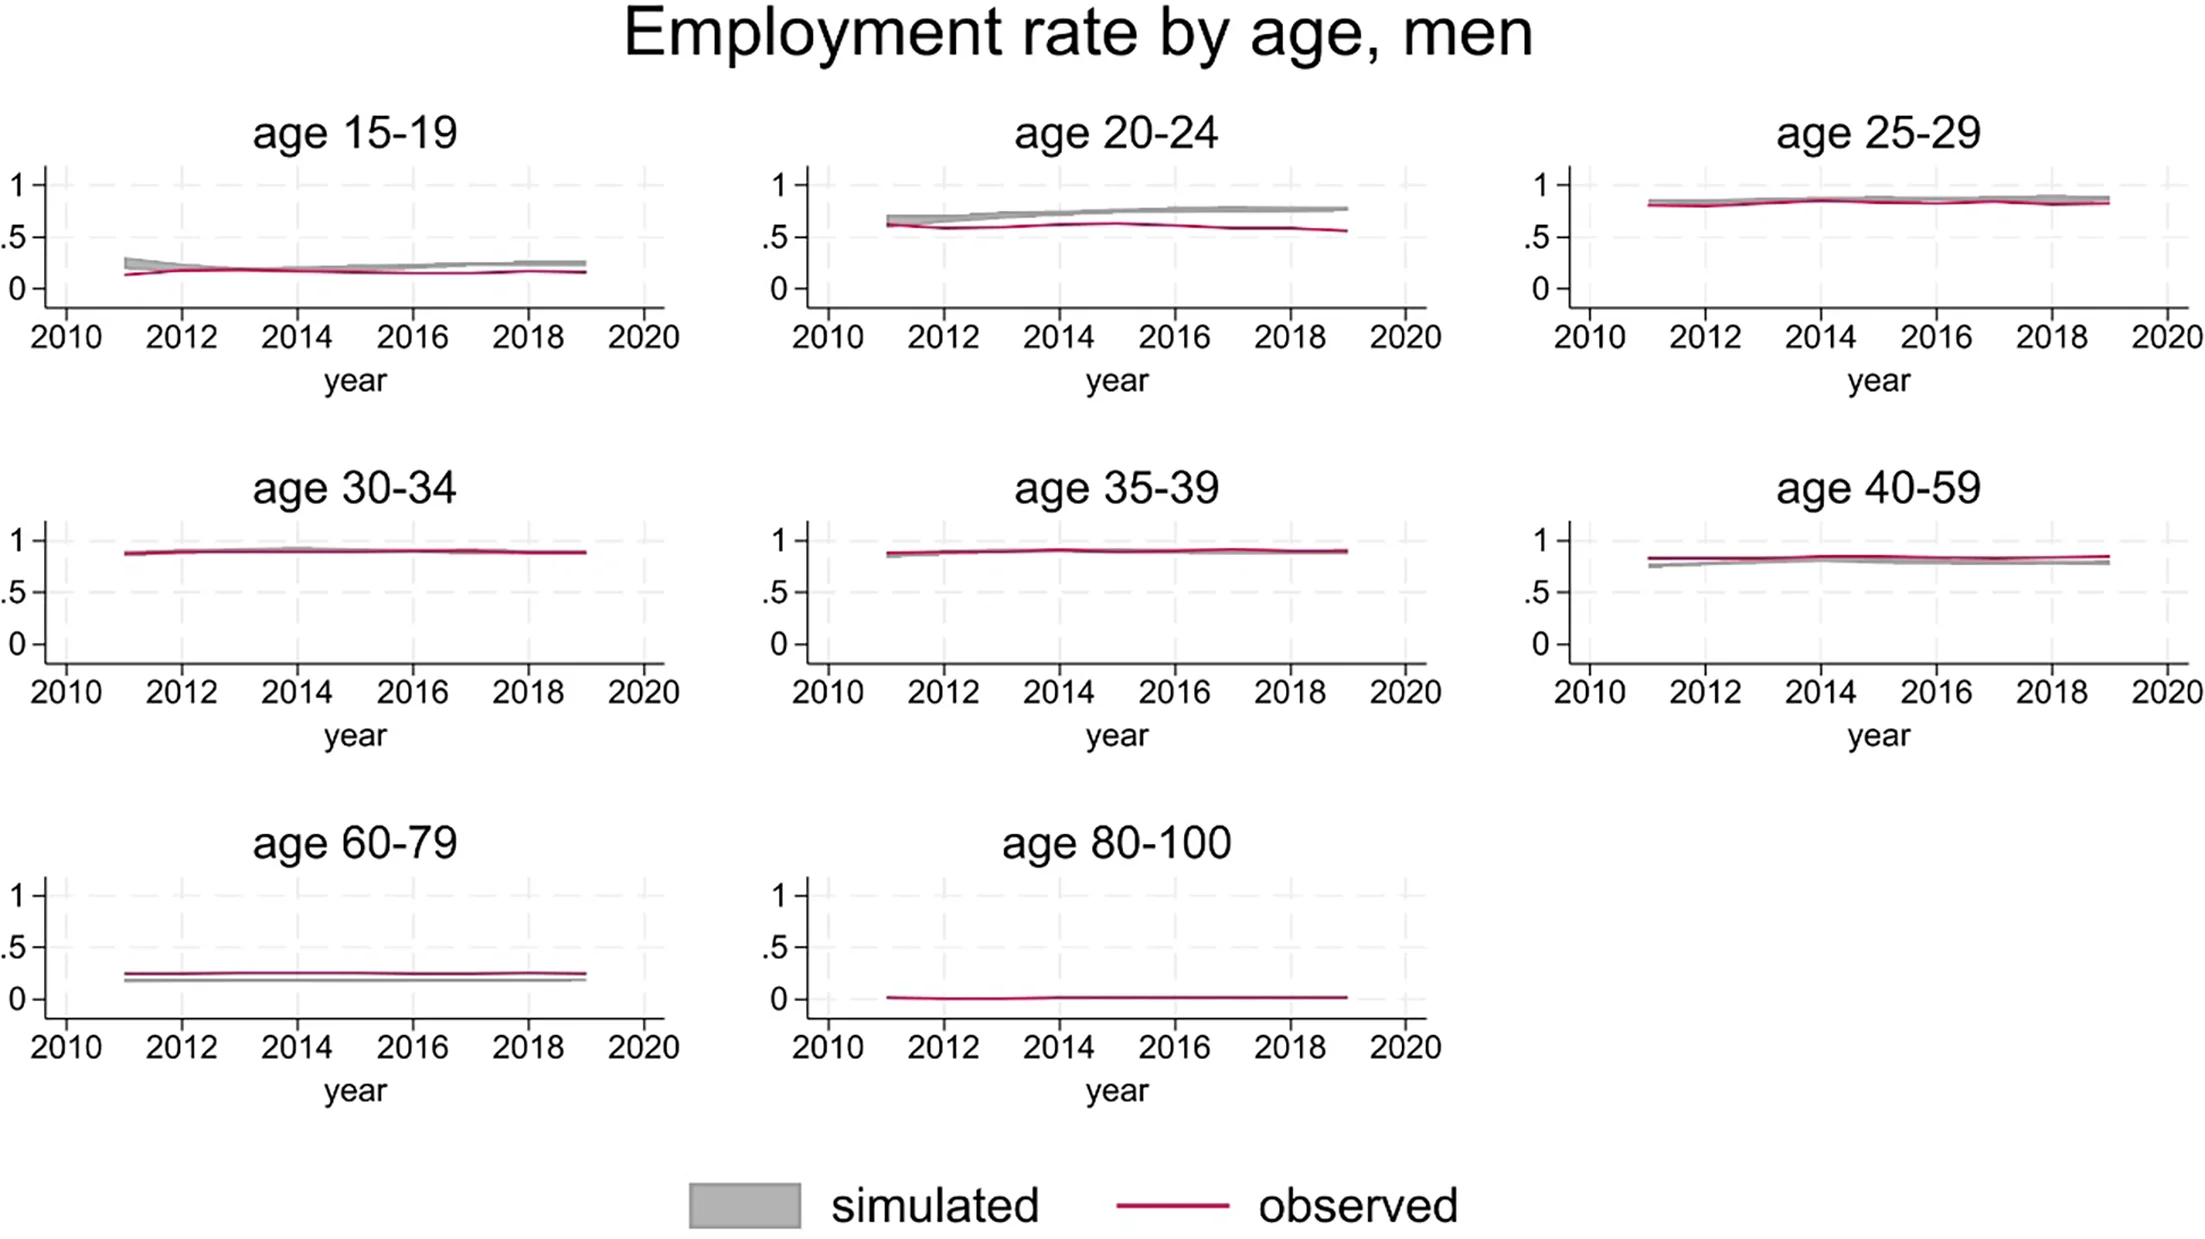
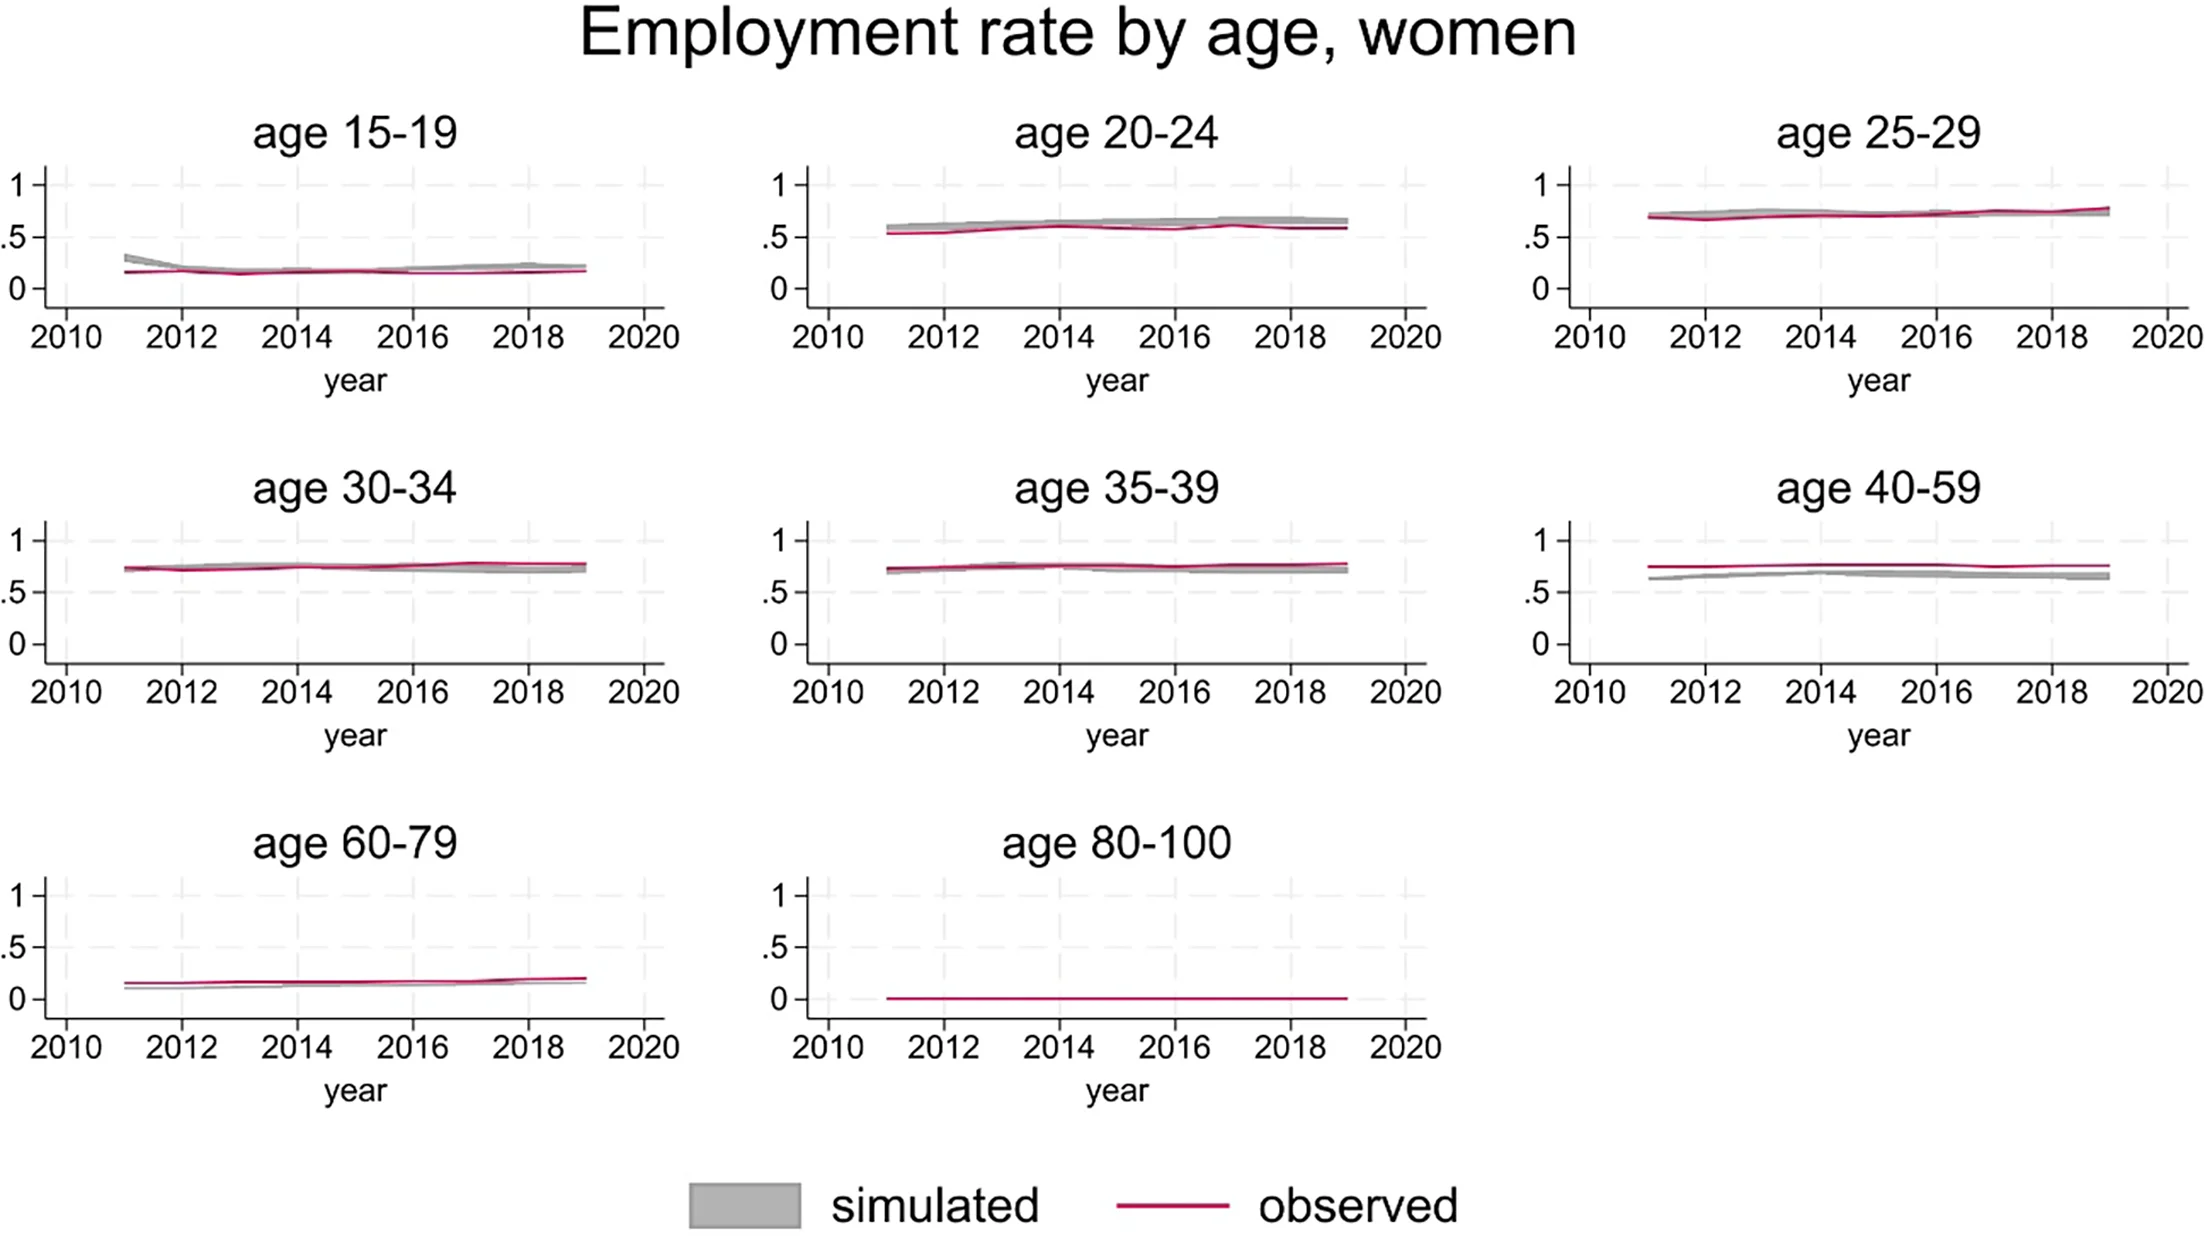
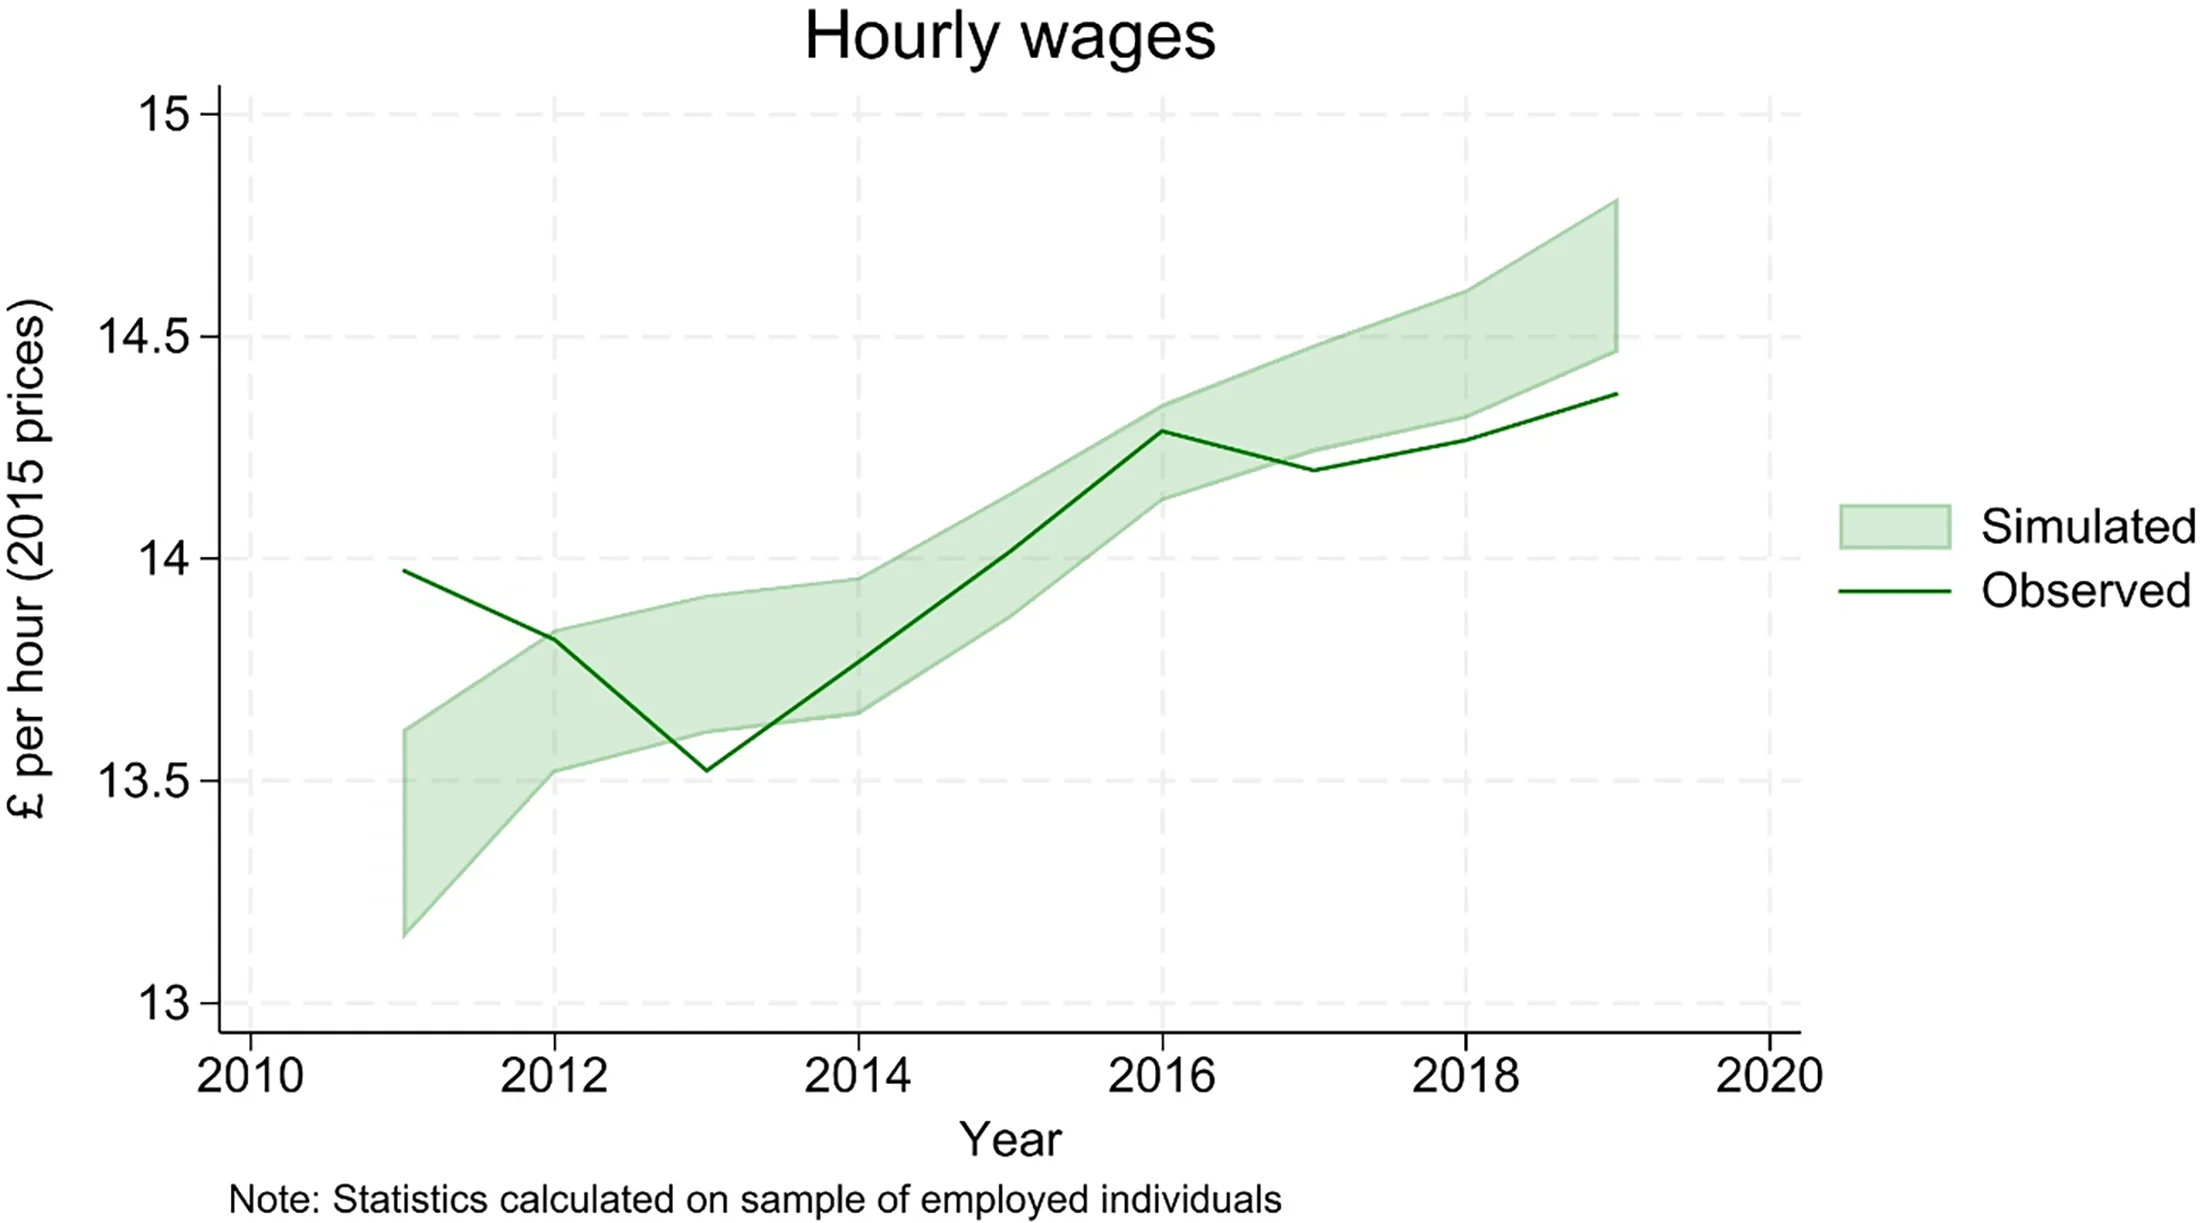
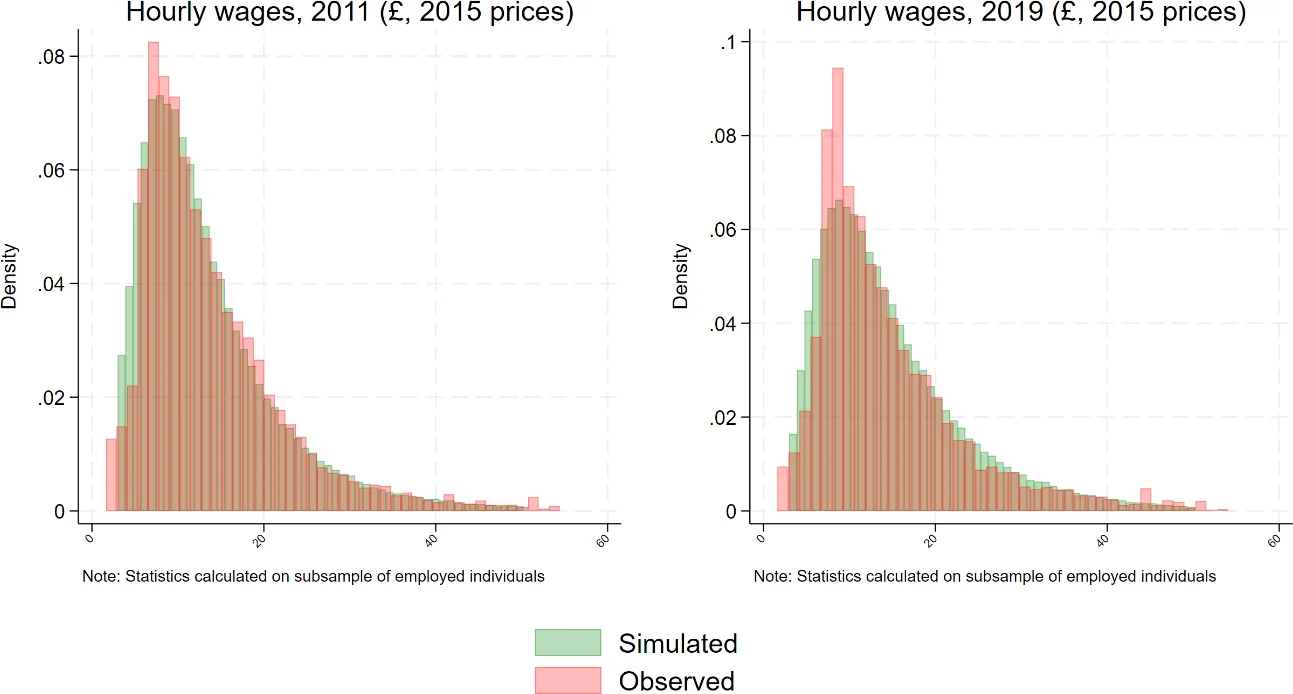
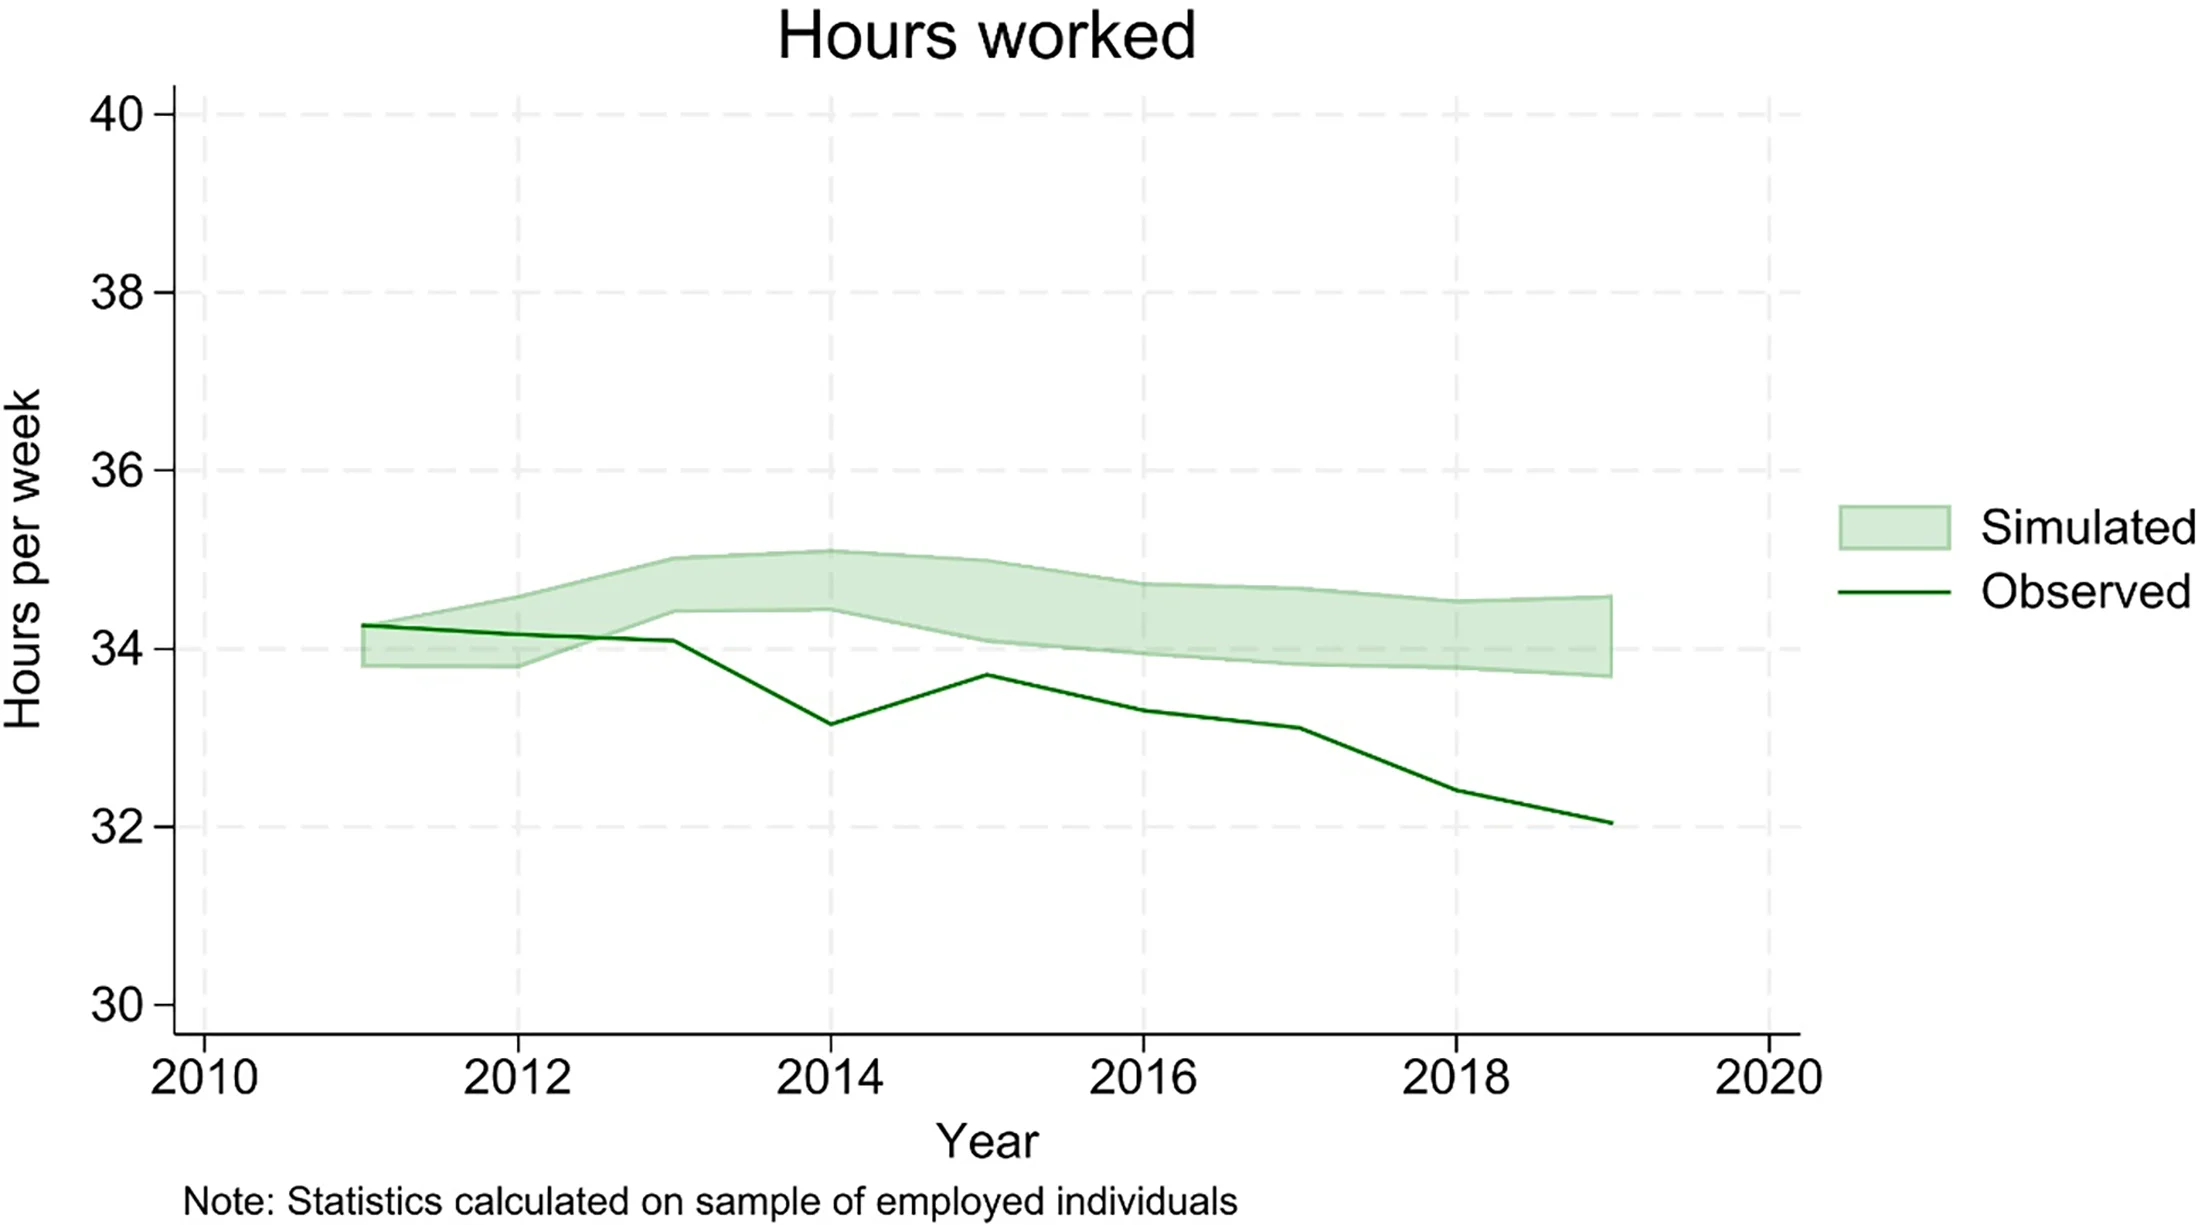
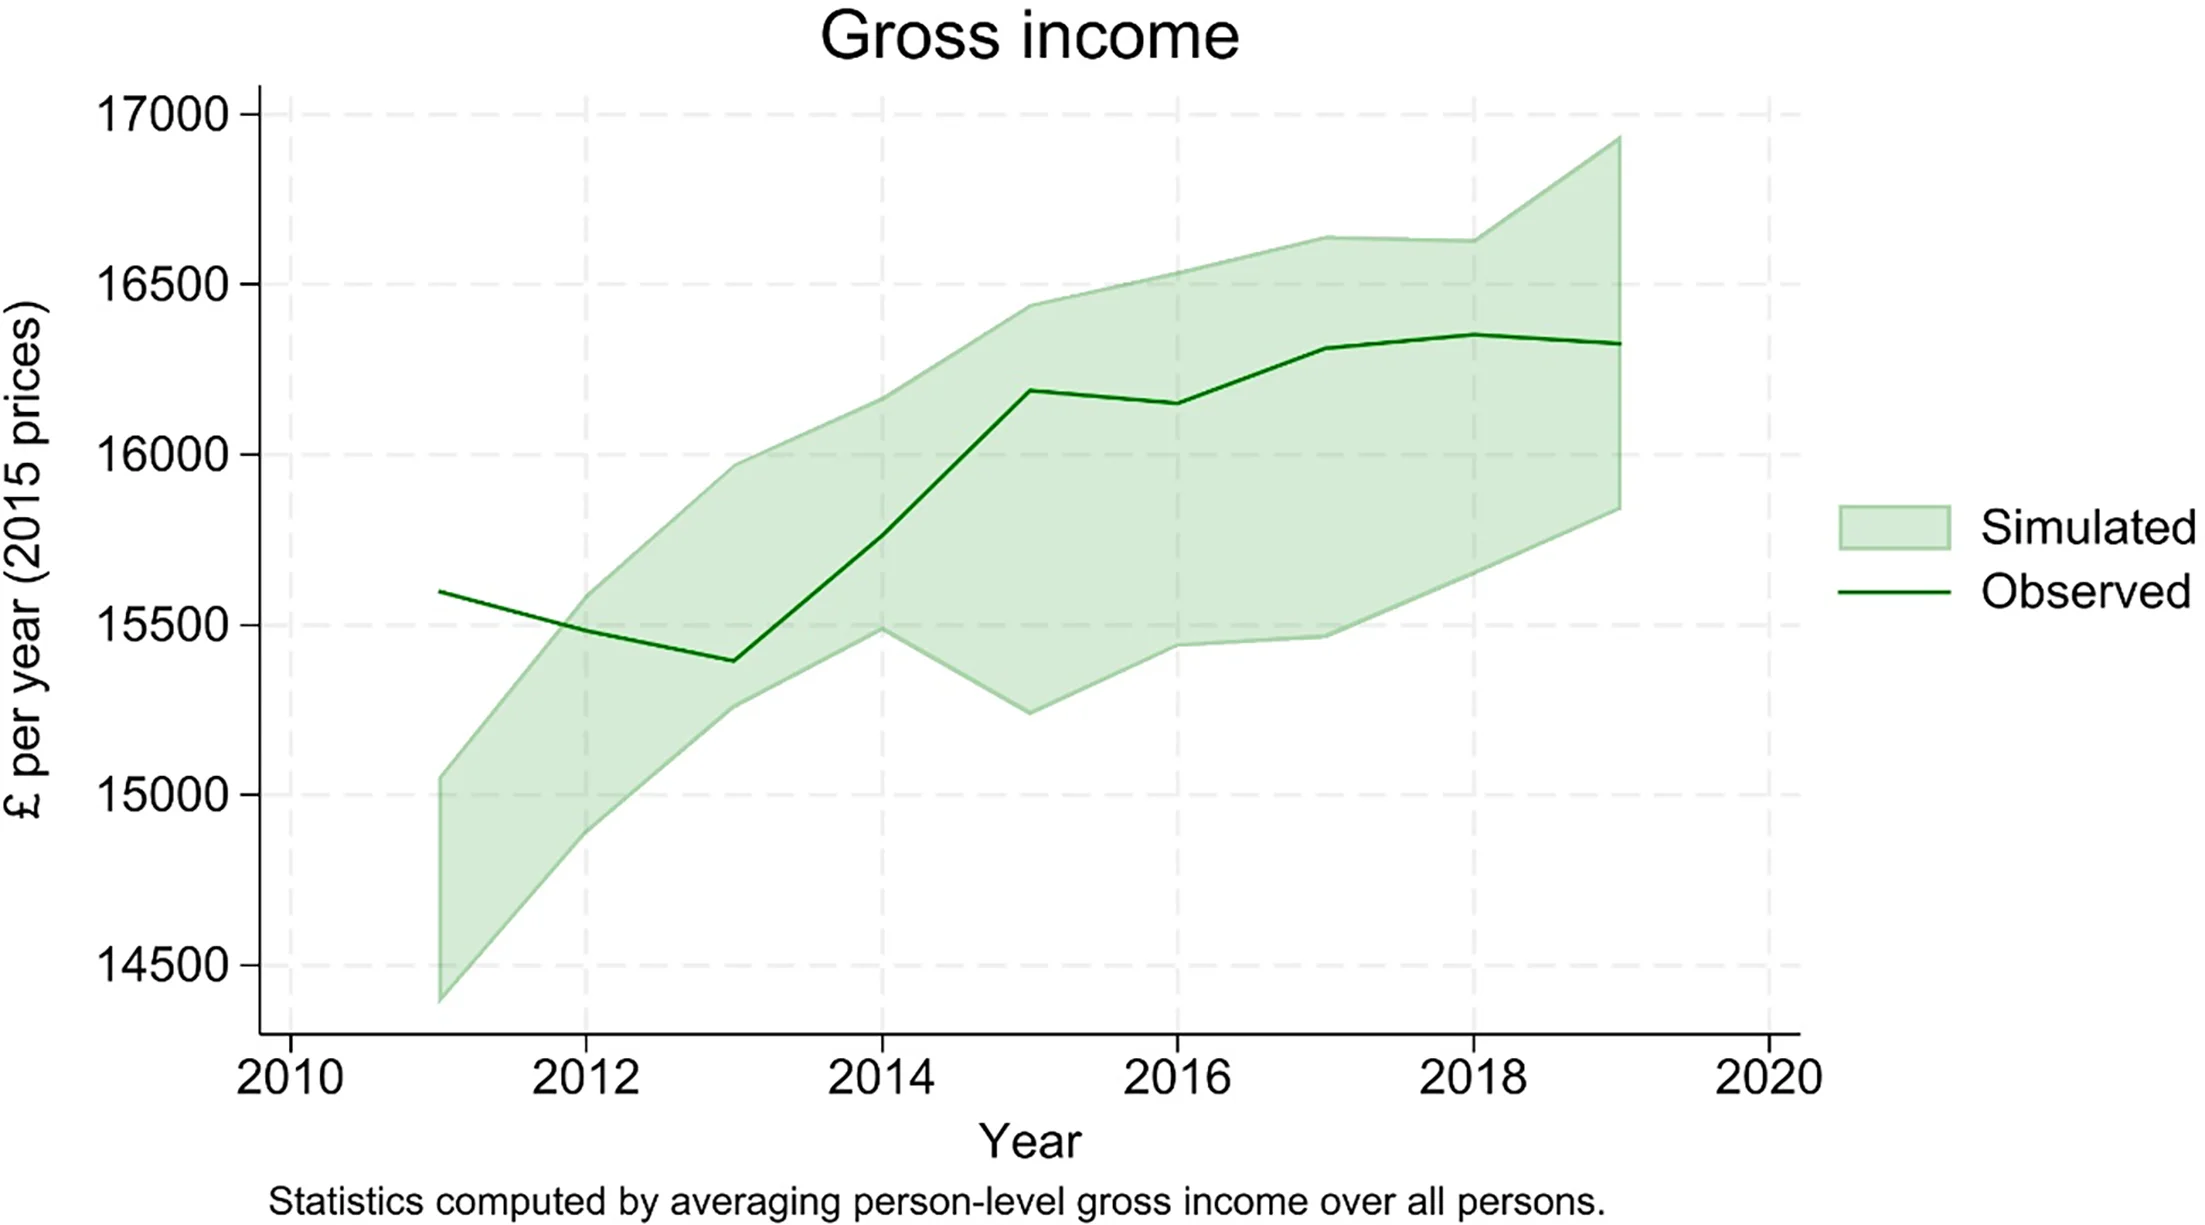
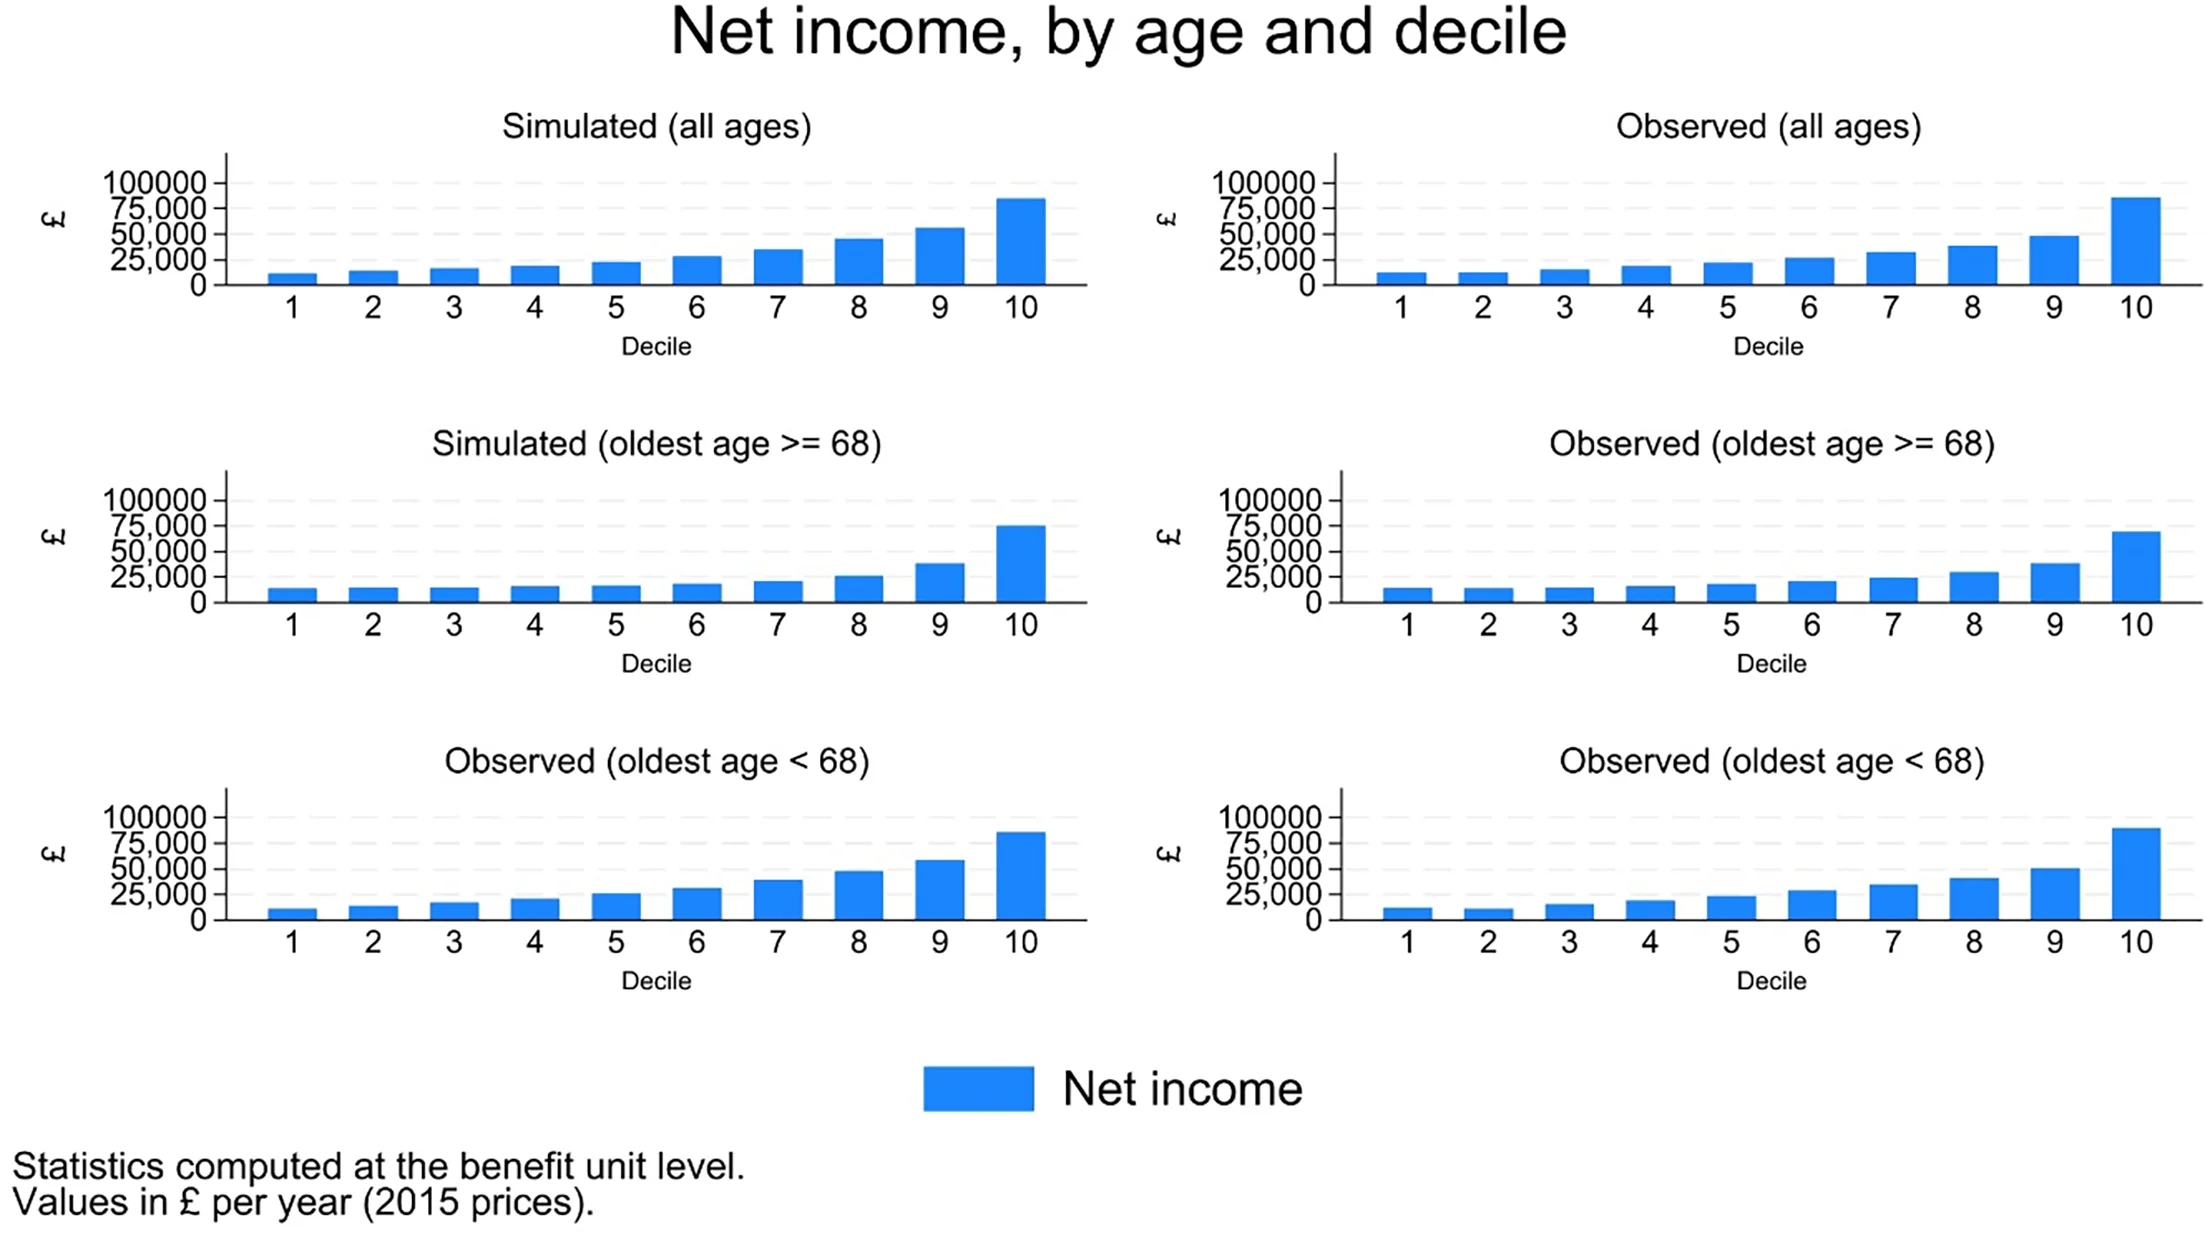
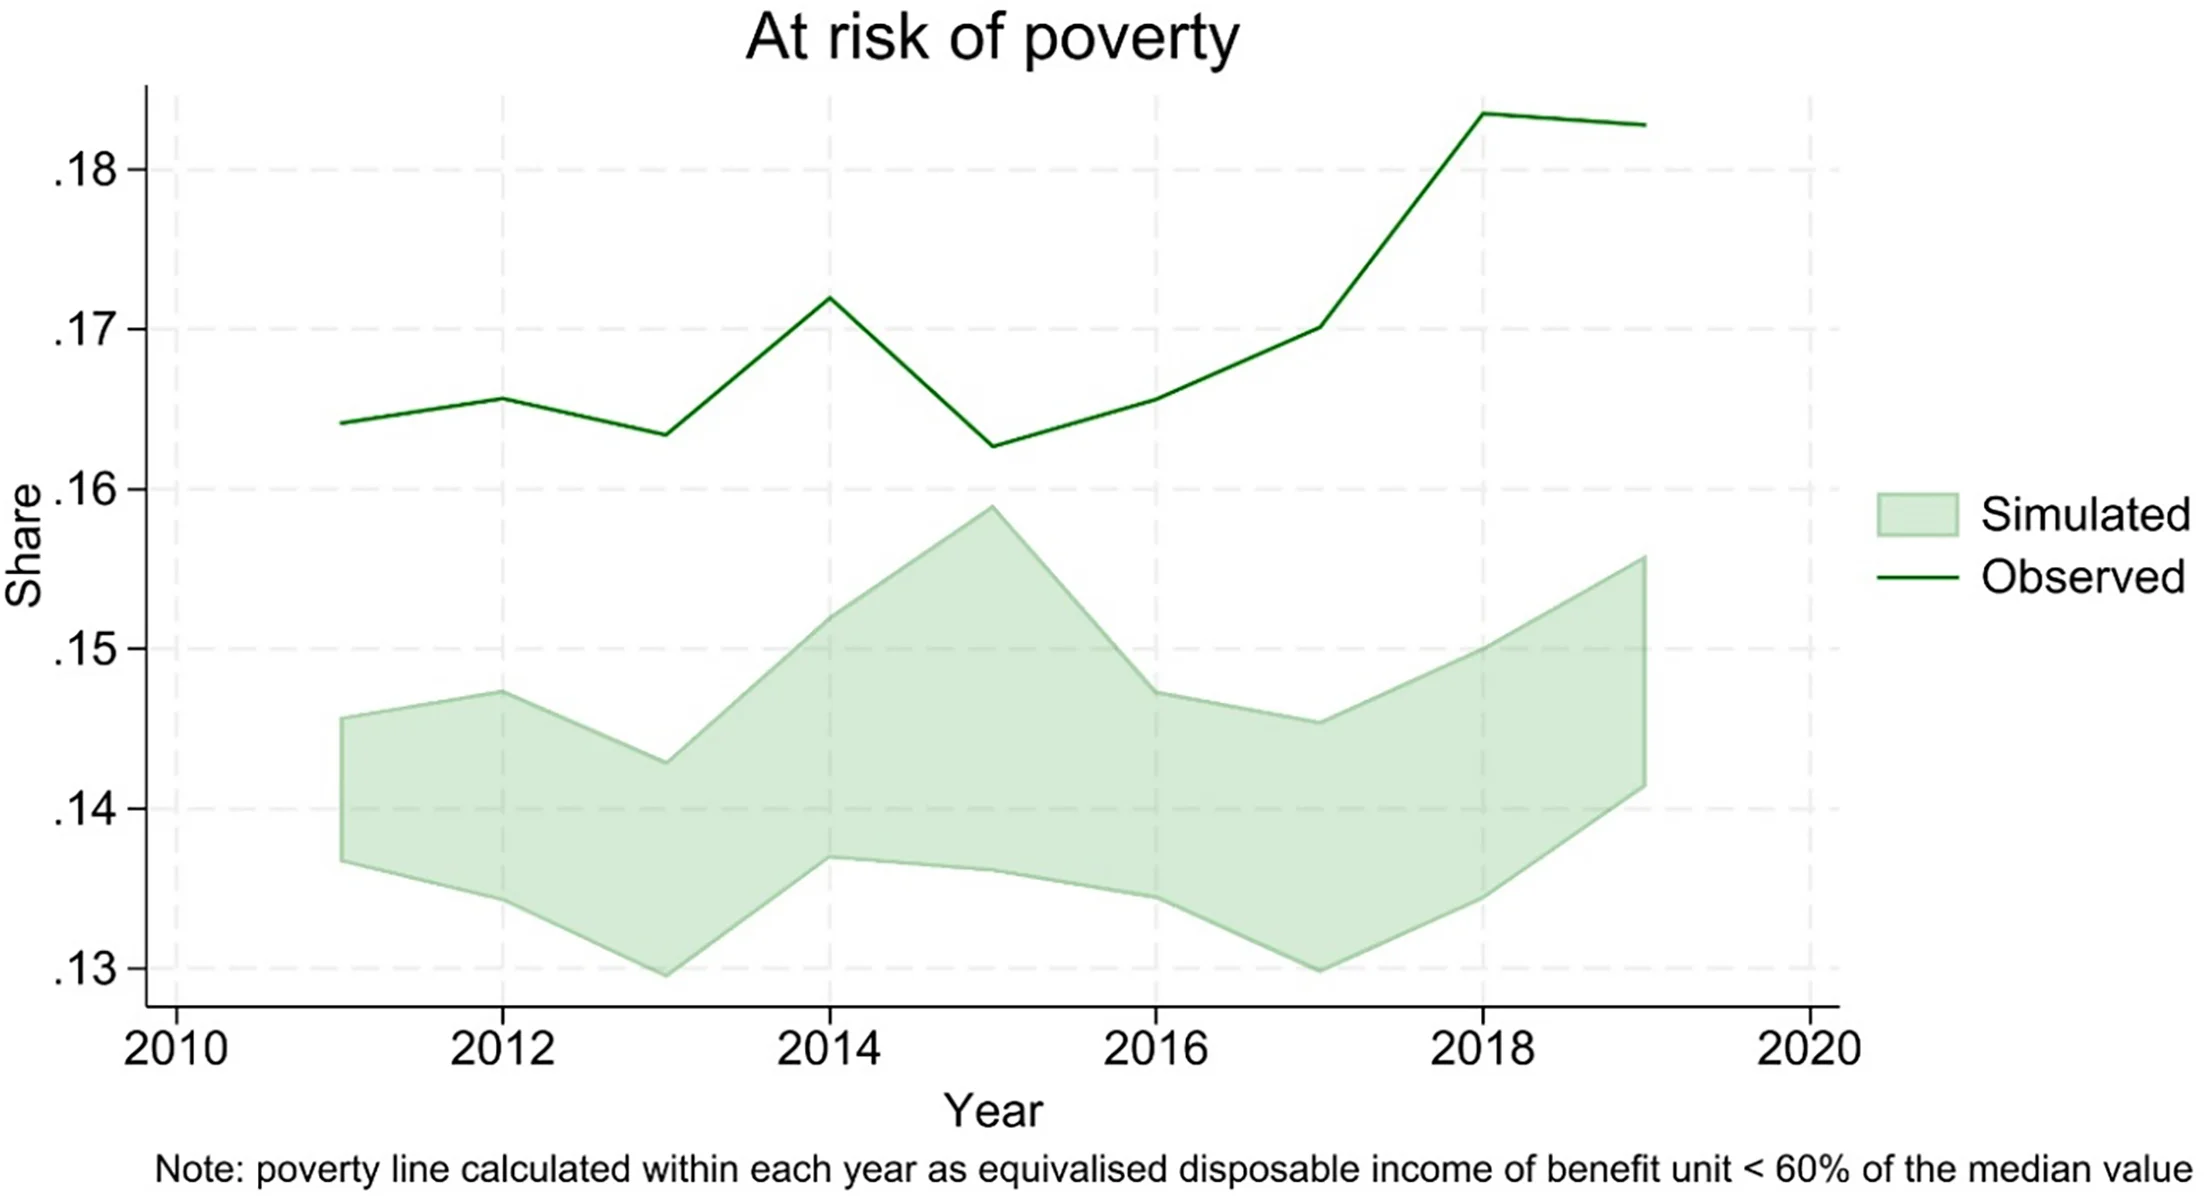
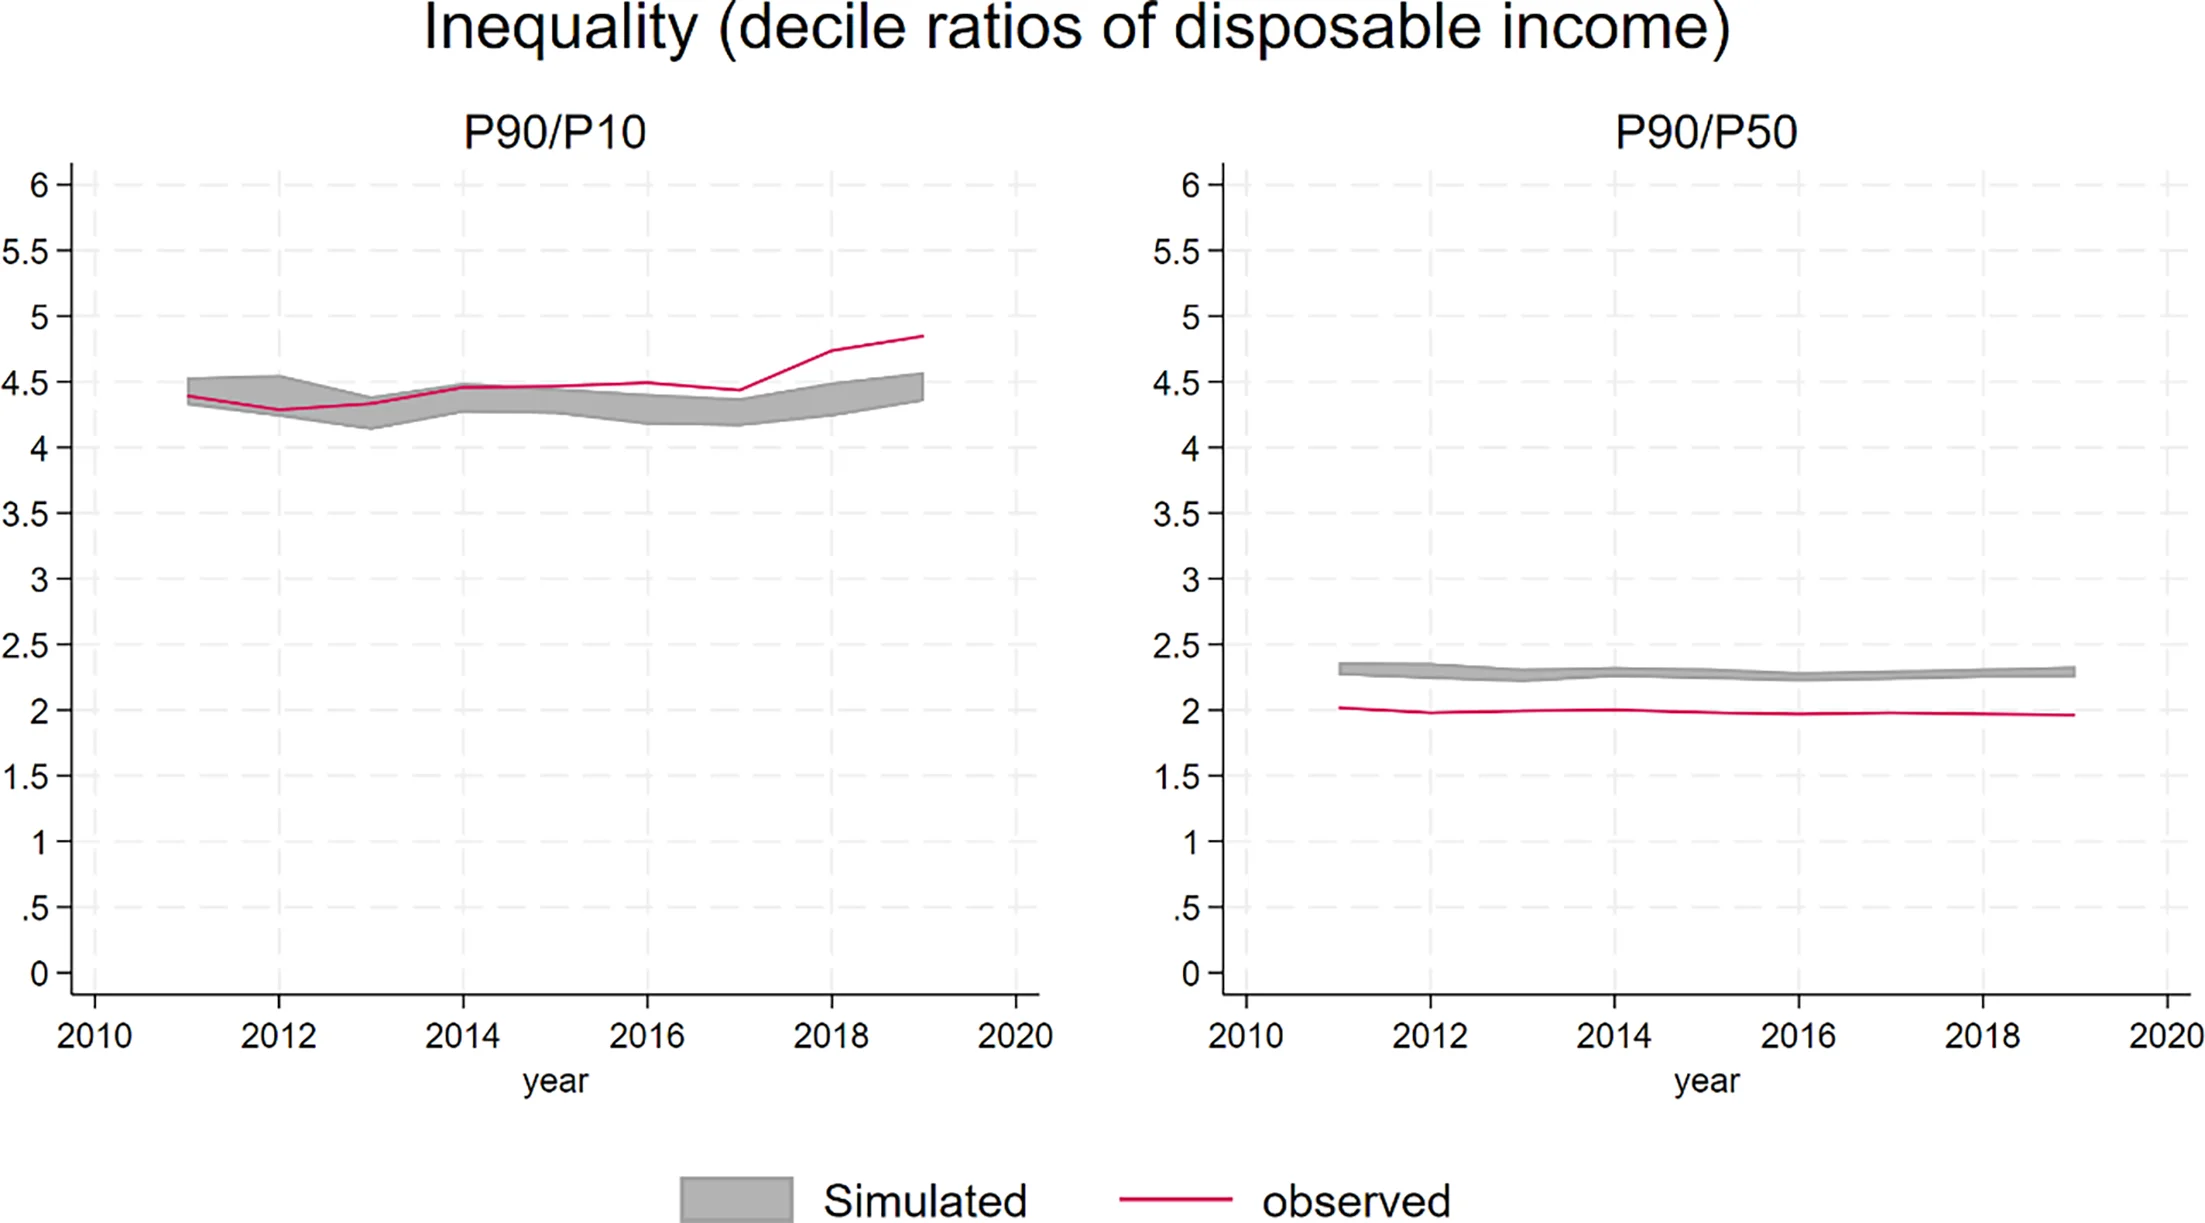
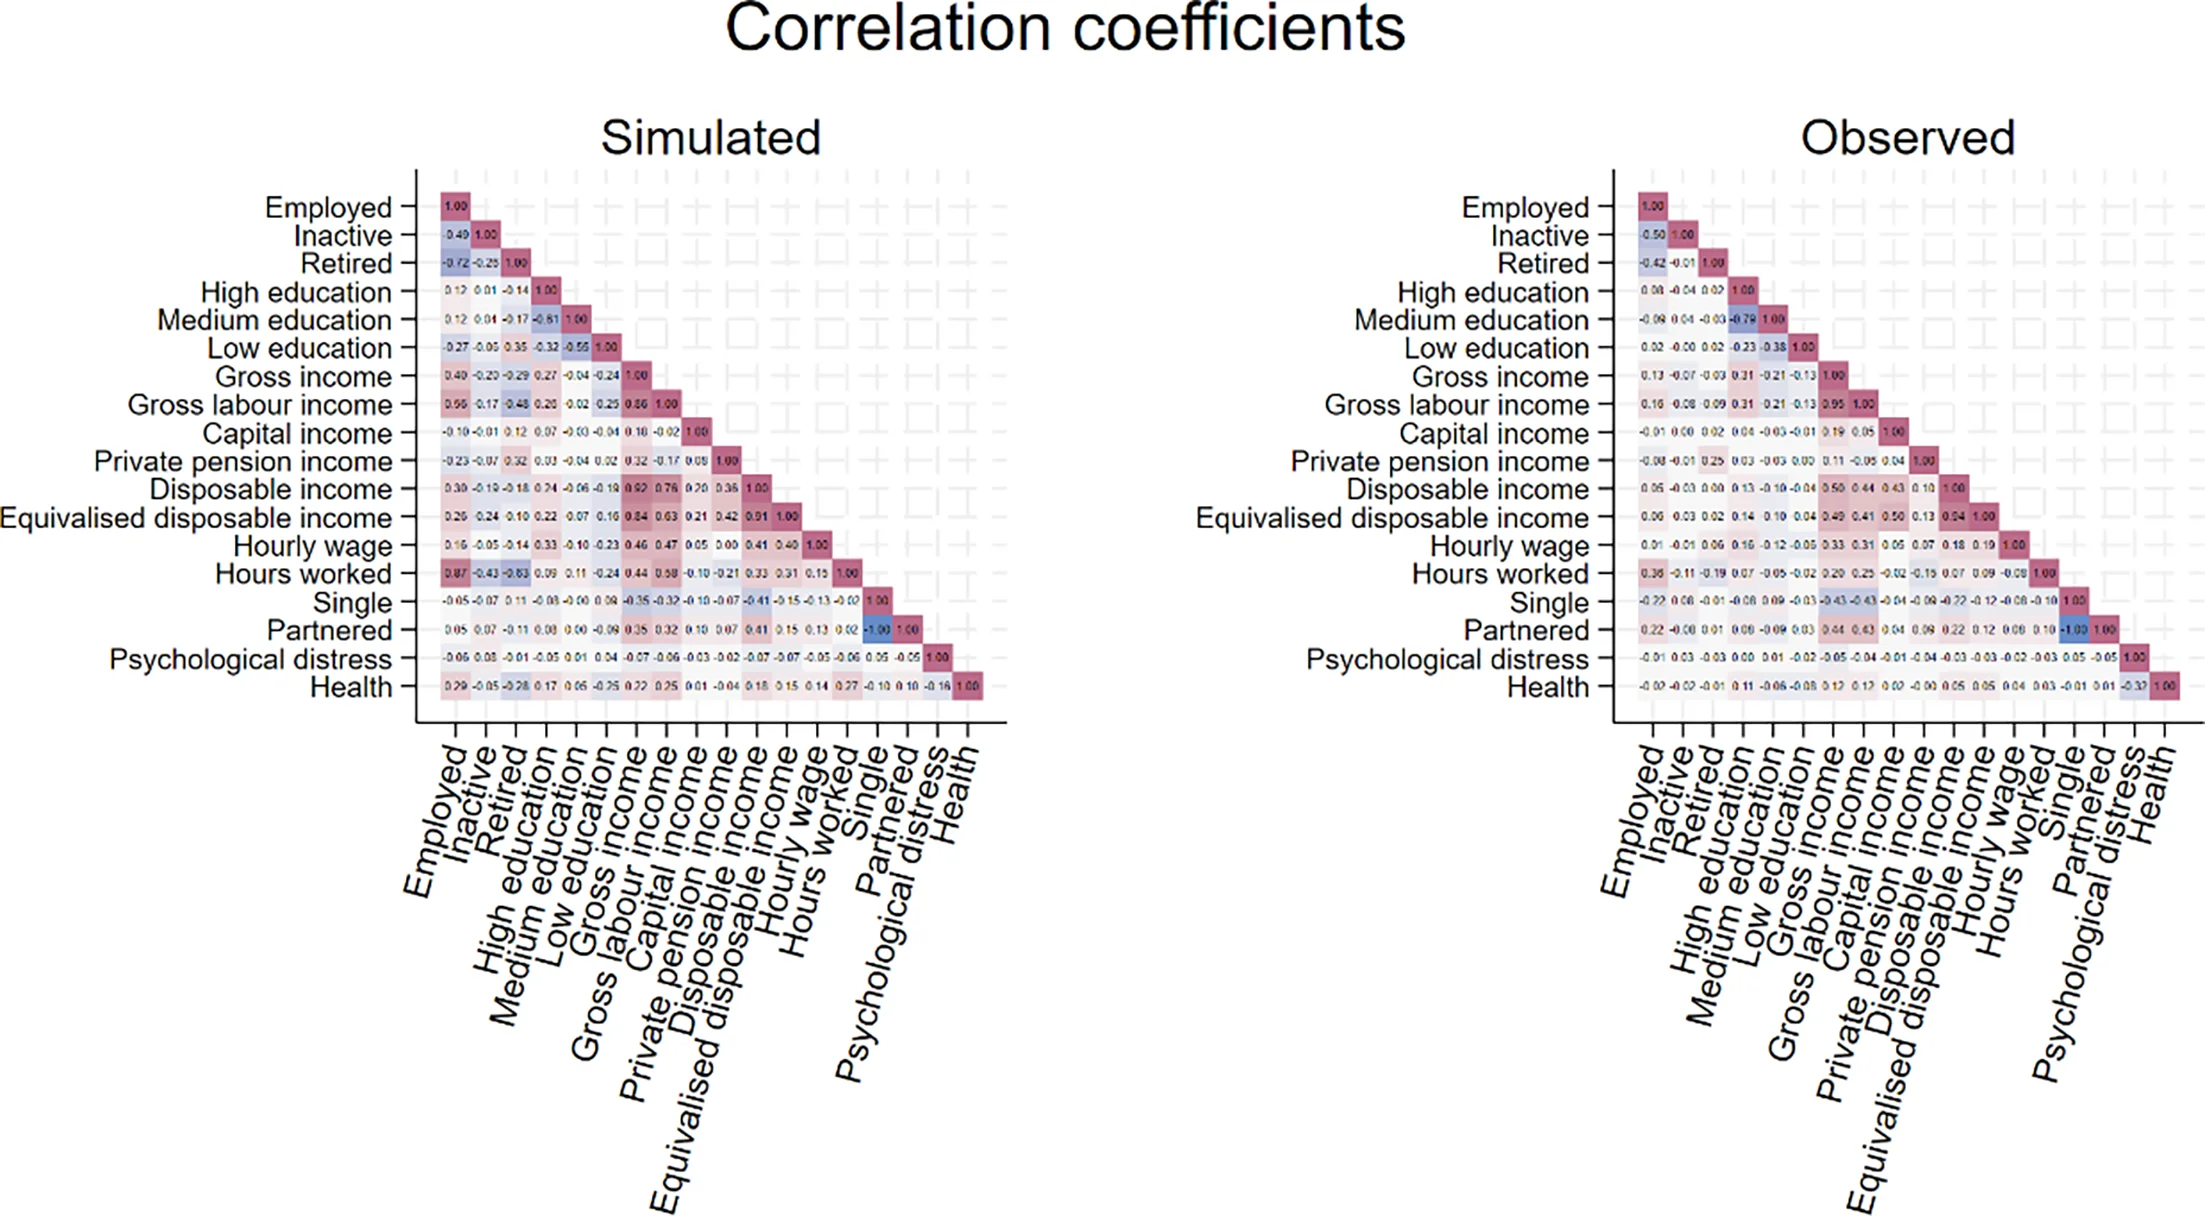
Tables
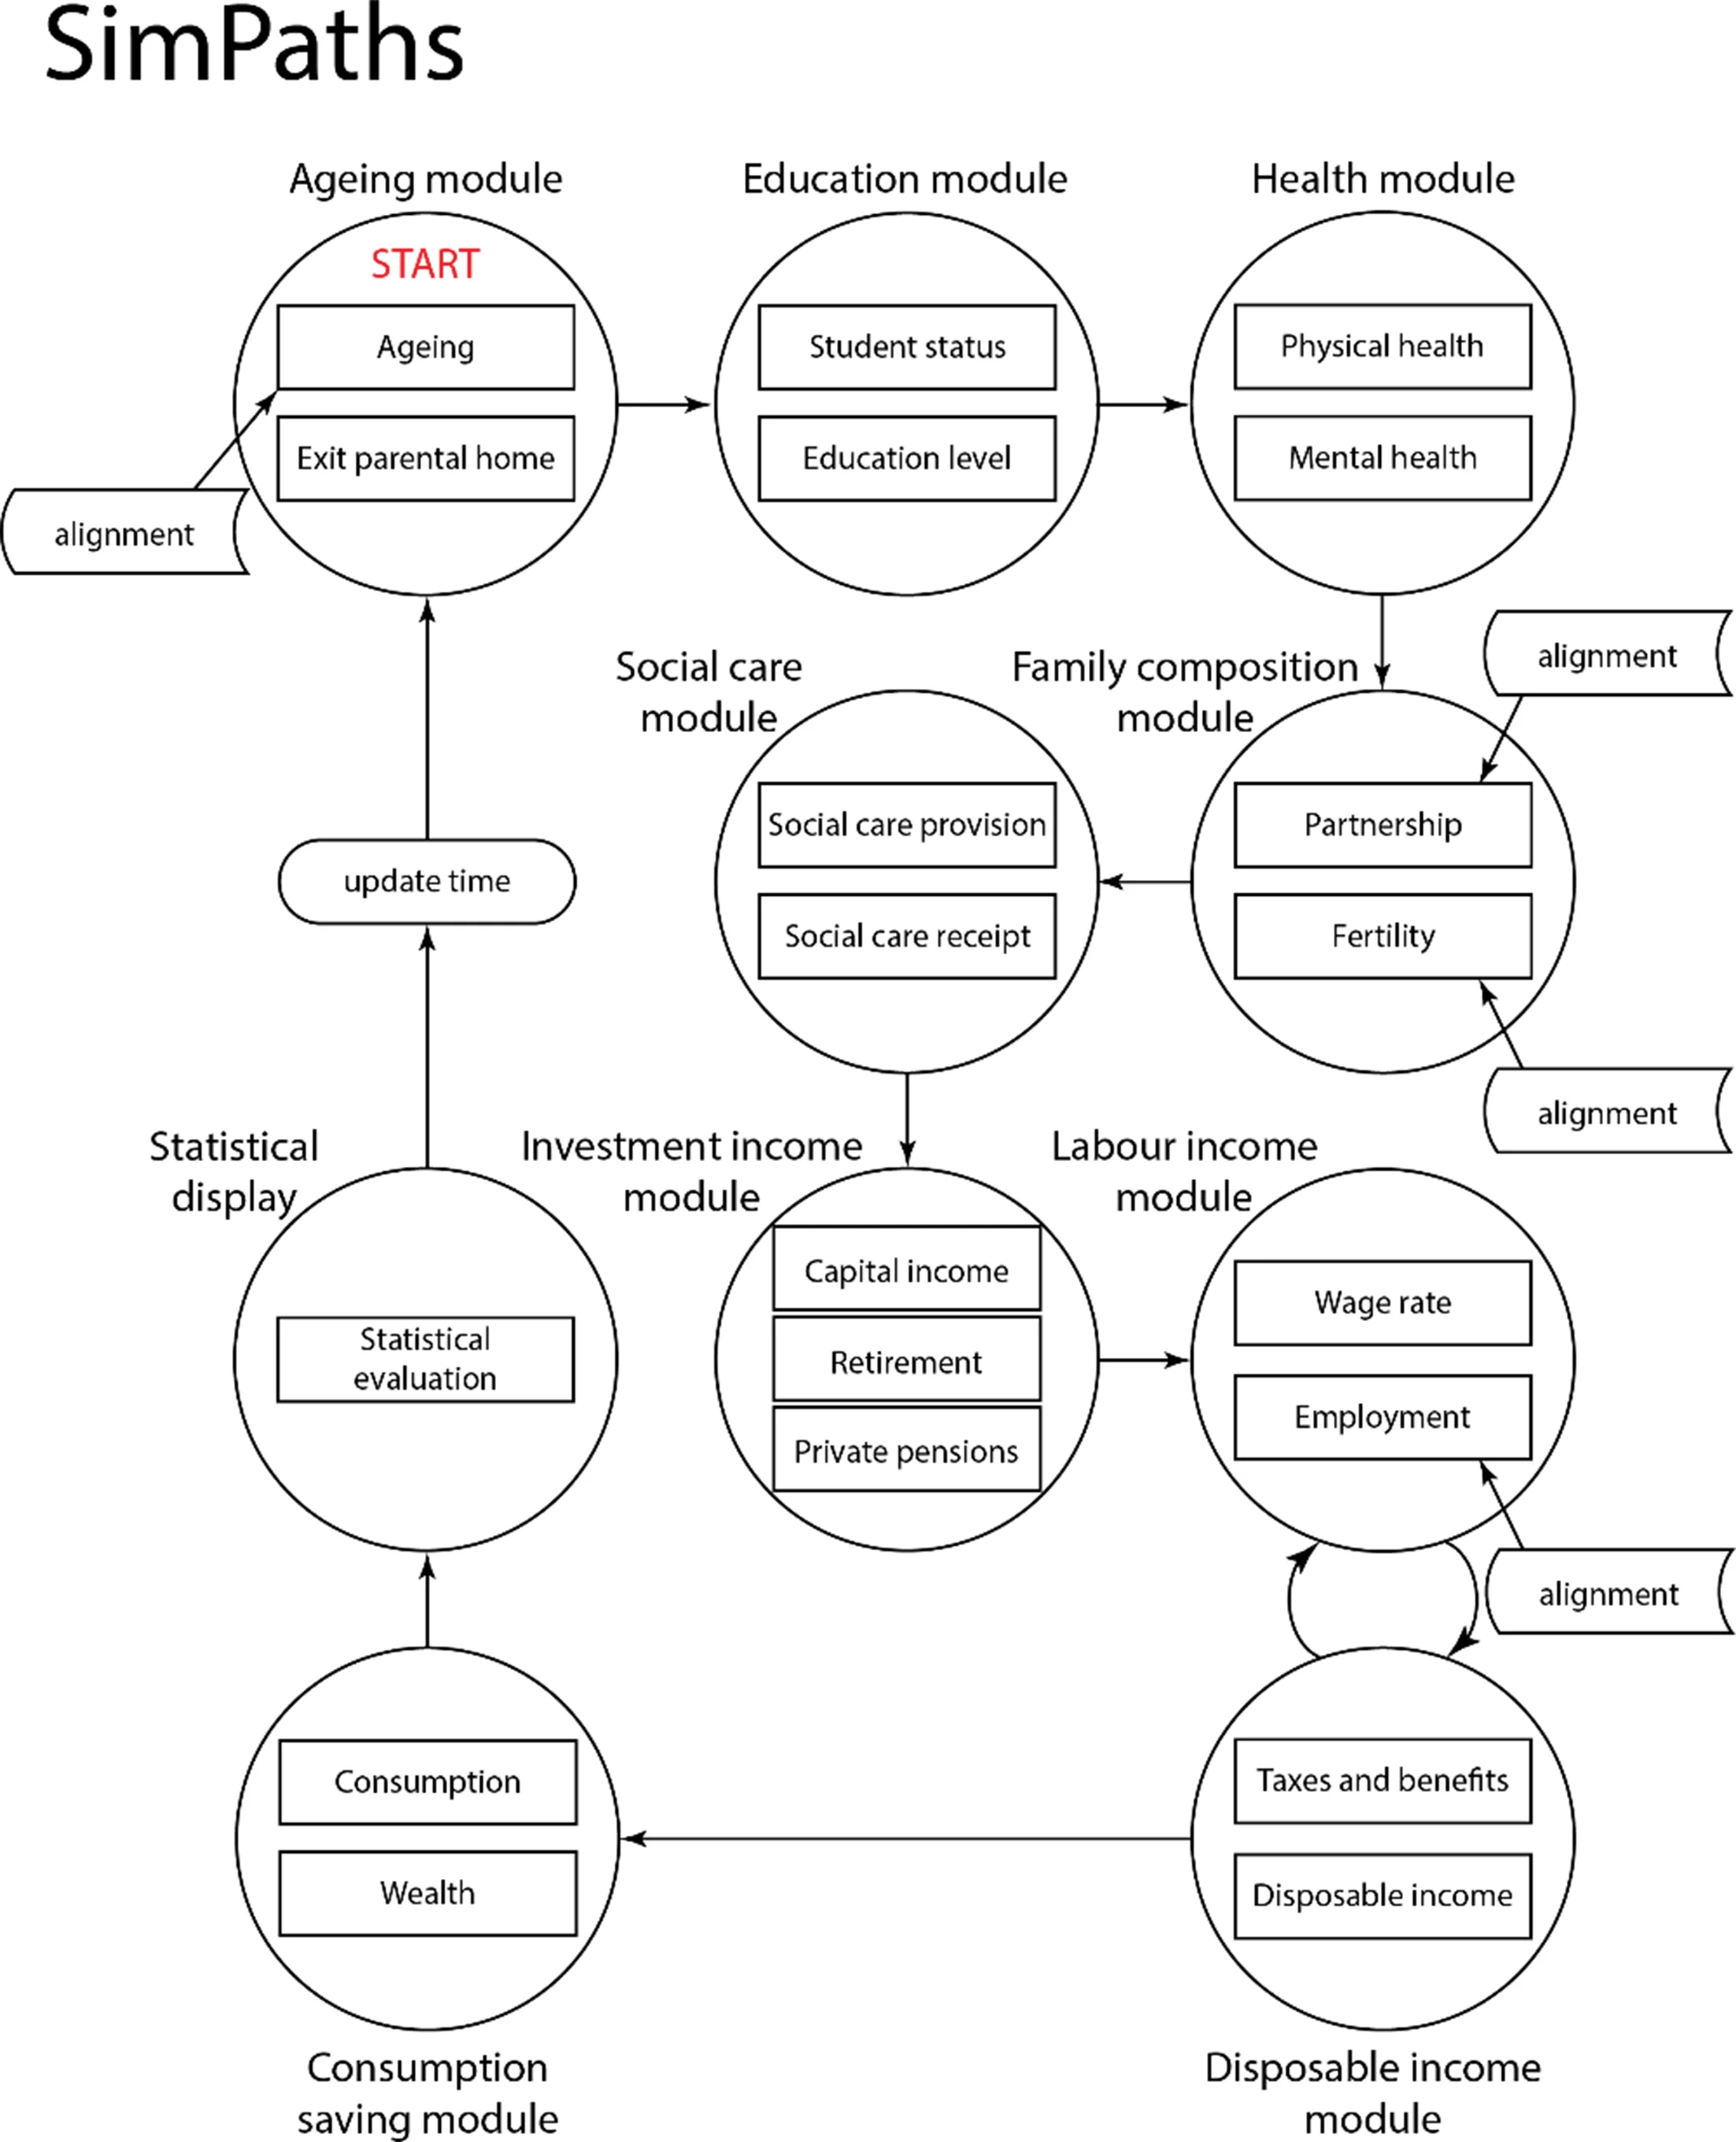
| Module | Process |
|---|---|
| Ageing | Age increases. |
| Probability of leaving the parental home for those who have left education. (Students stay in the parental home). | |
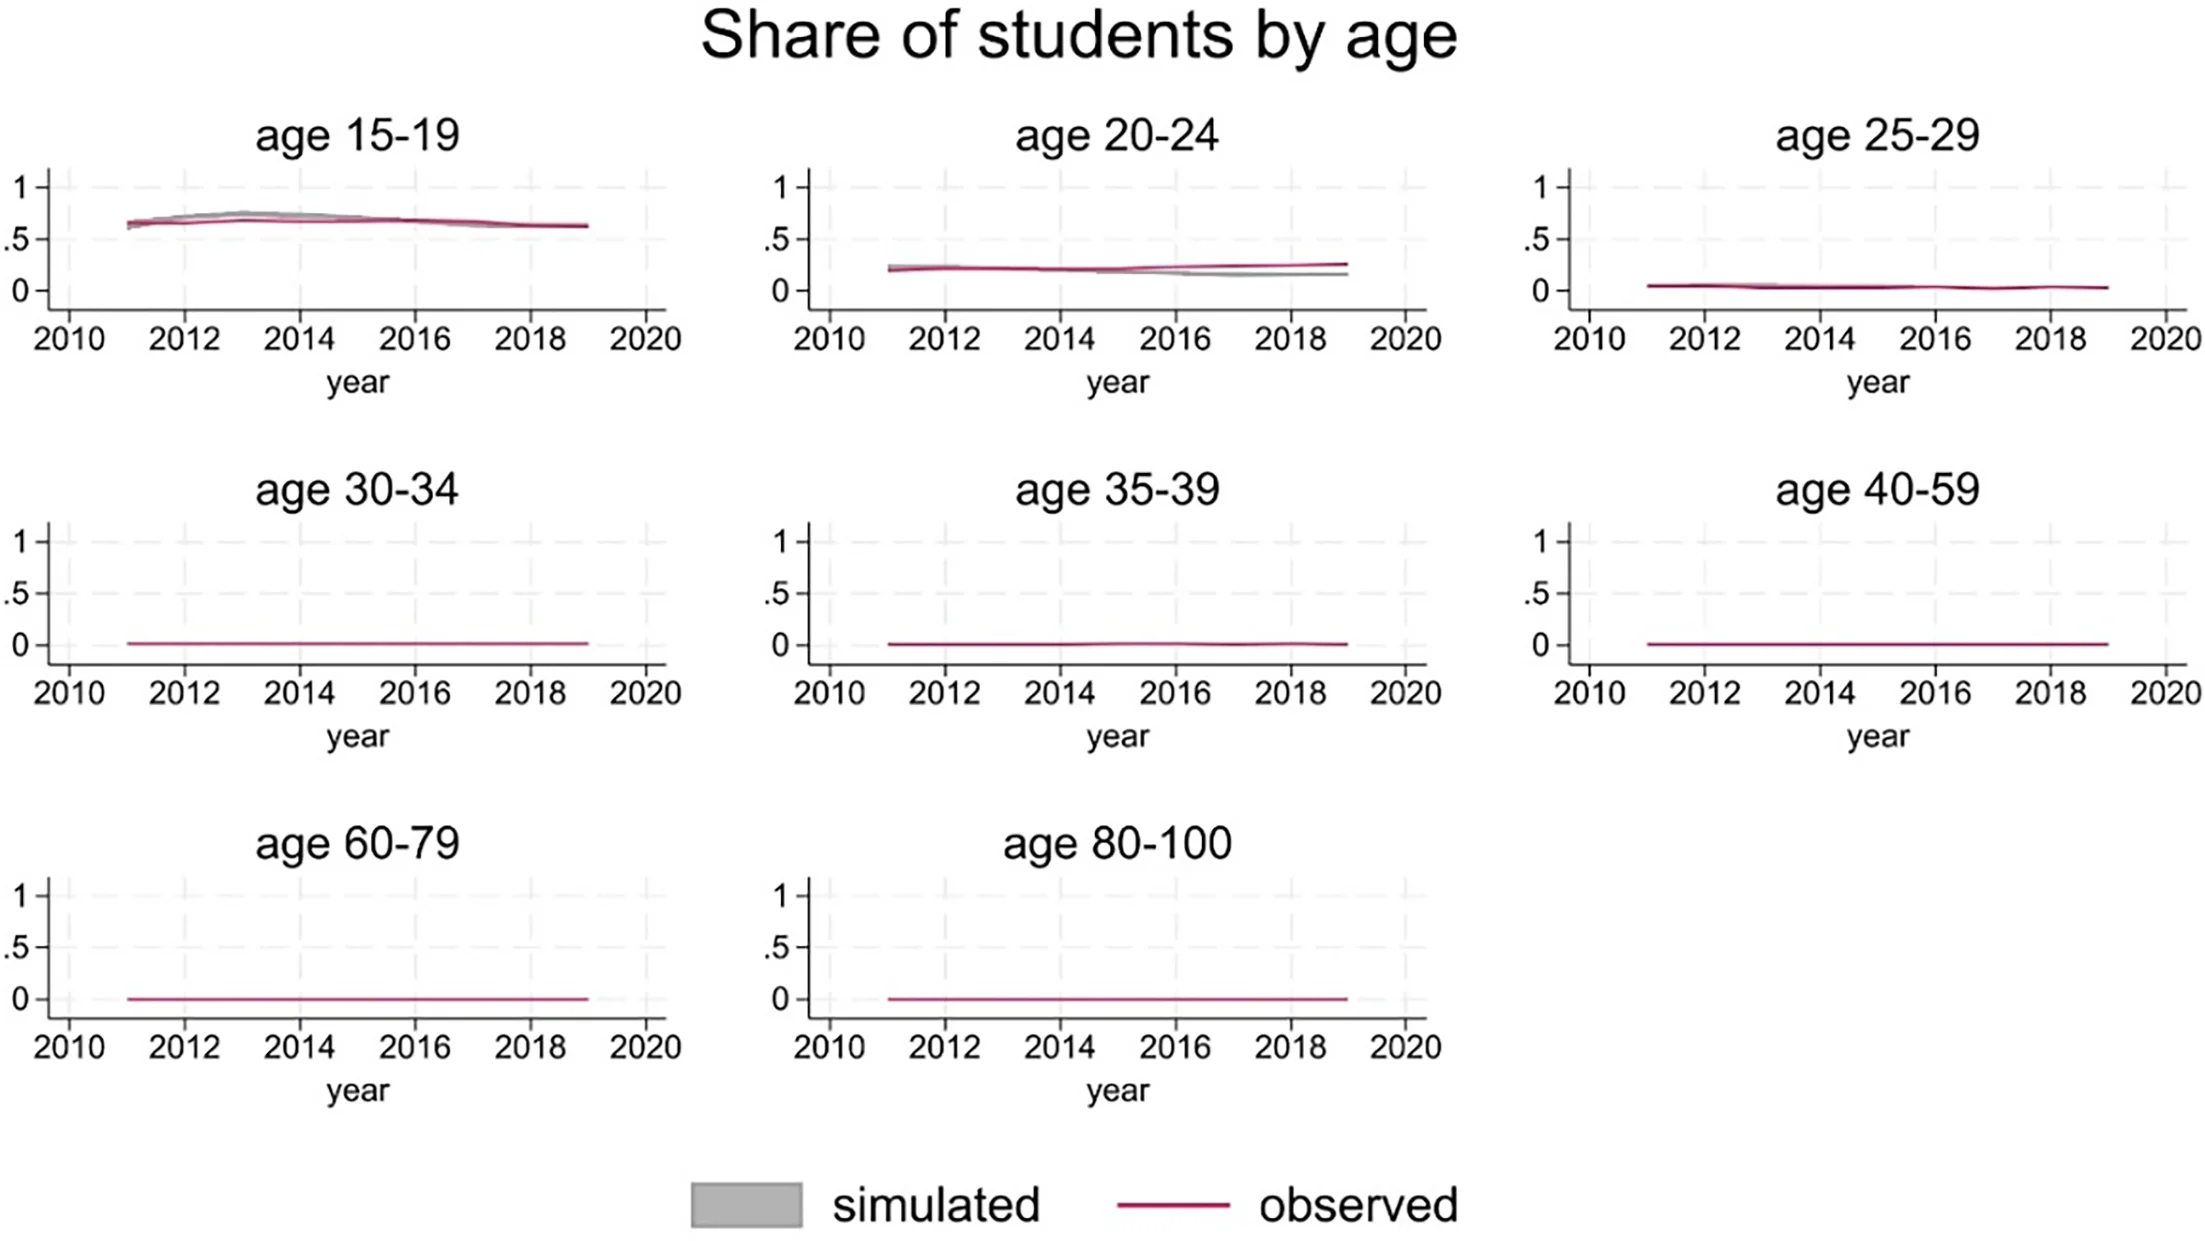
| Education | Probability of remaining in education for those who have always been in education without interruptions. |
| Probability of returning to education for those who had left school. | |
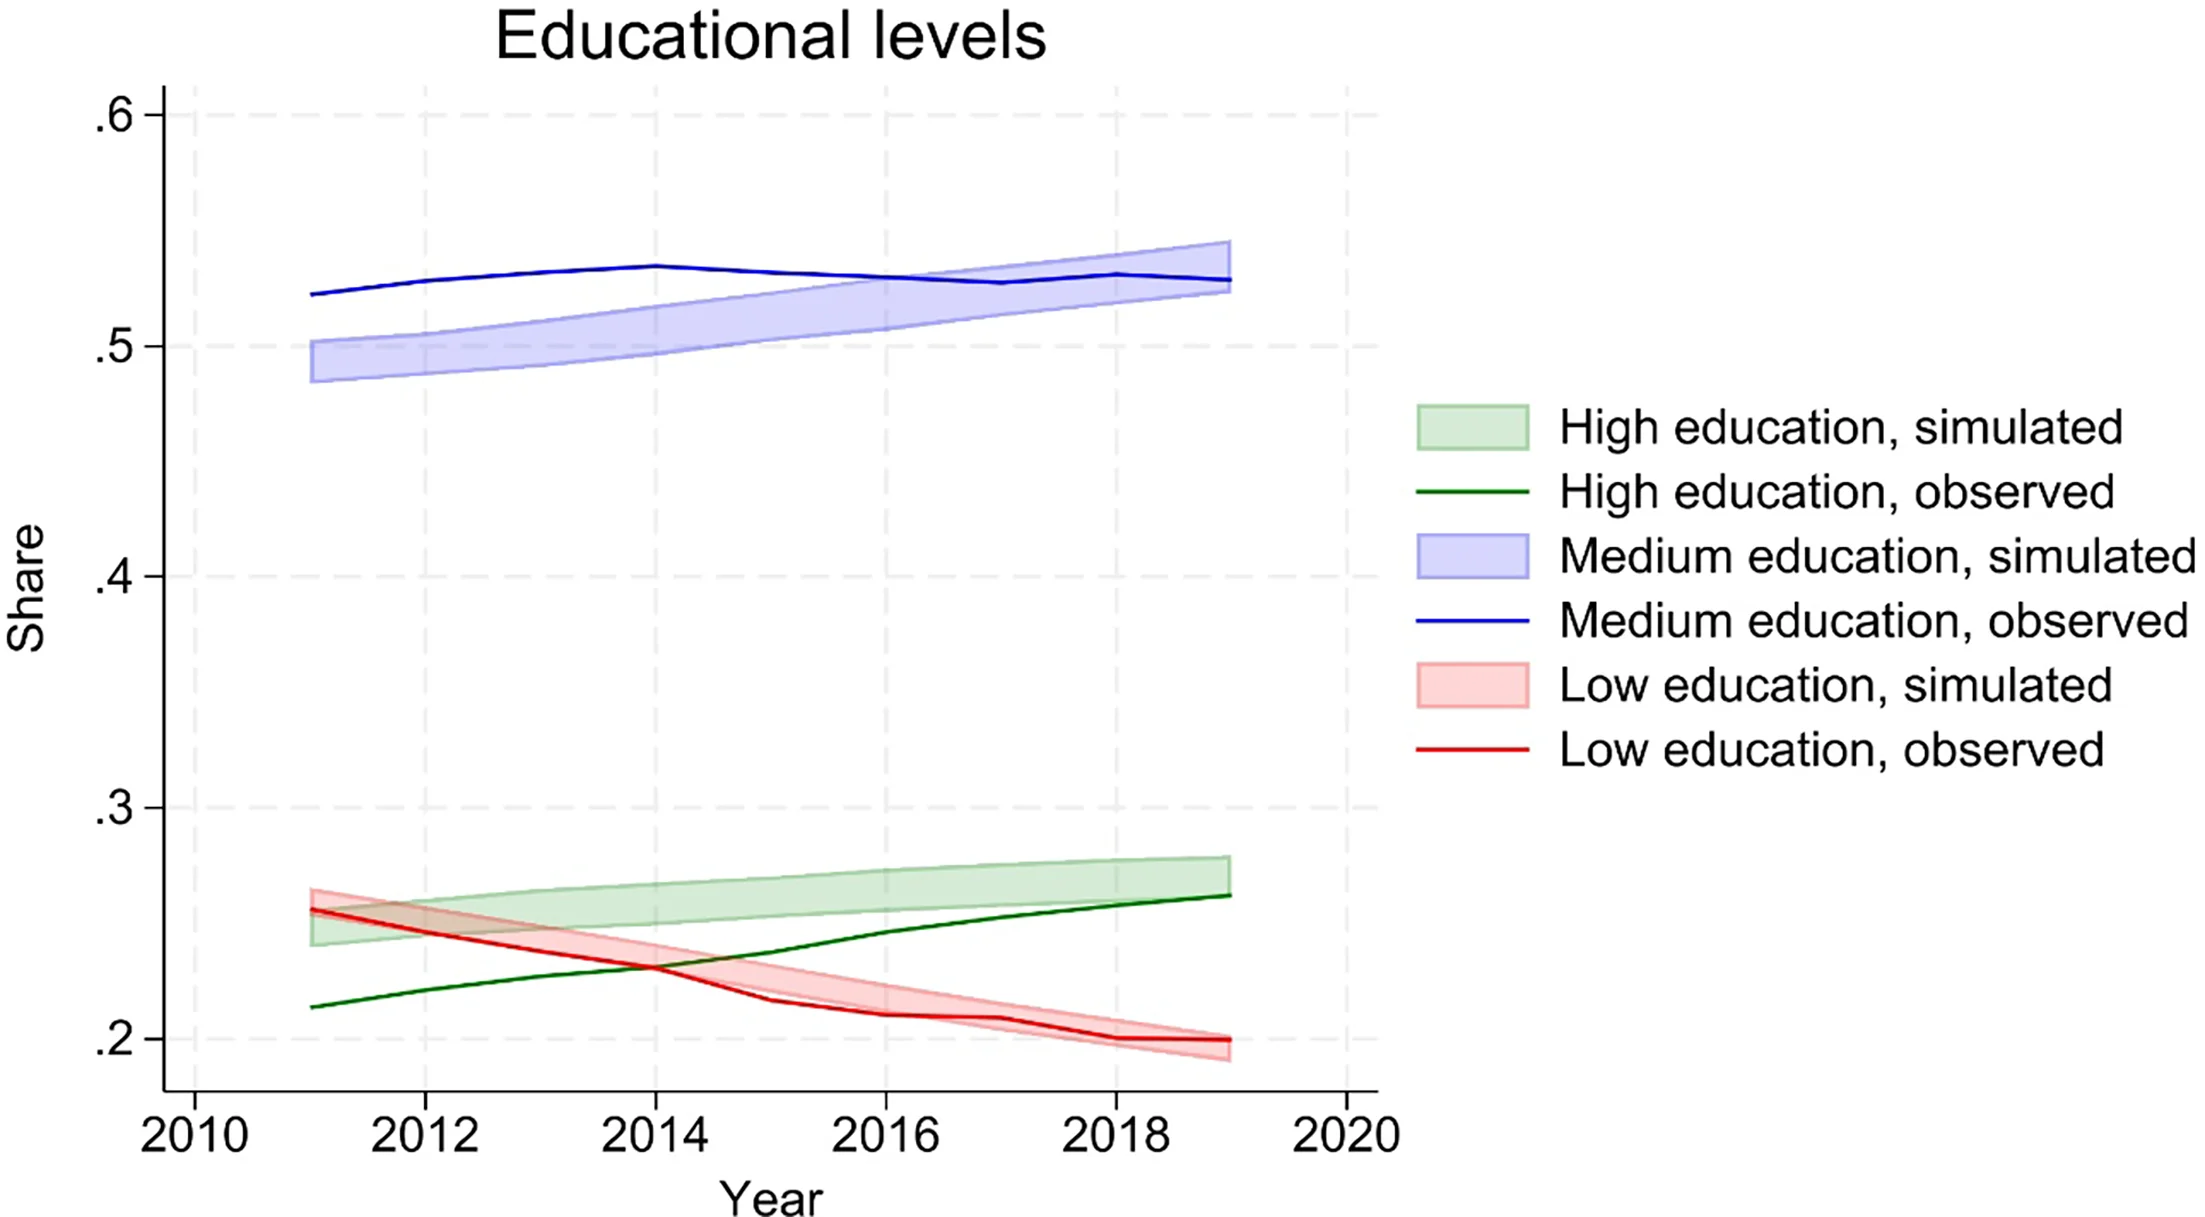
| Level of education for those leaving education. | |
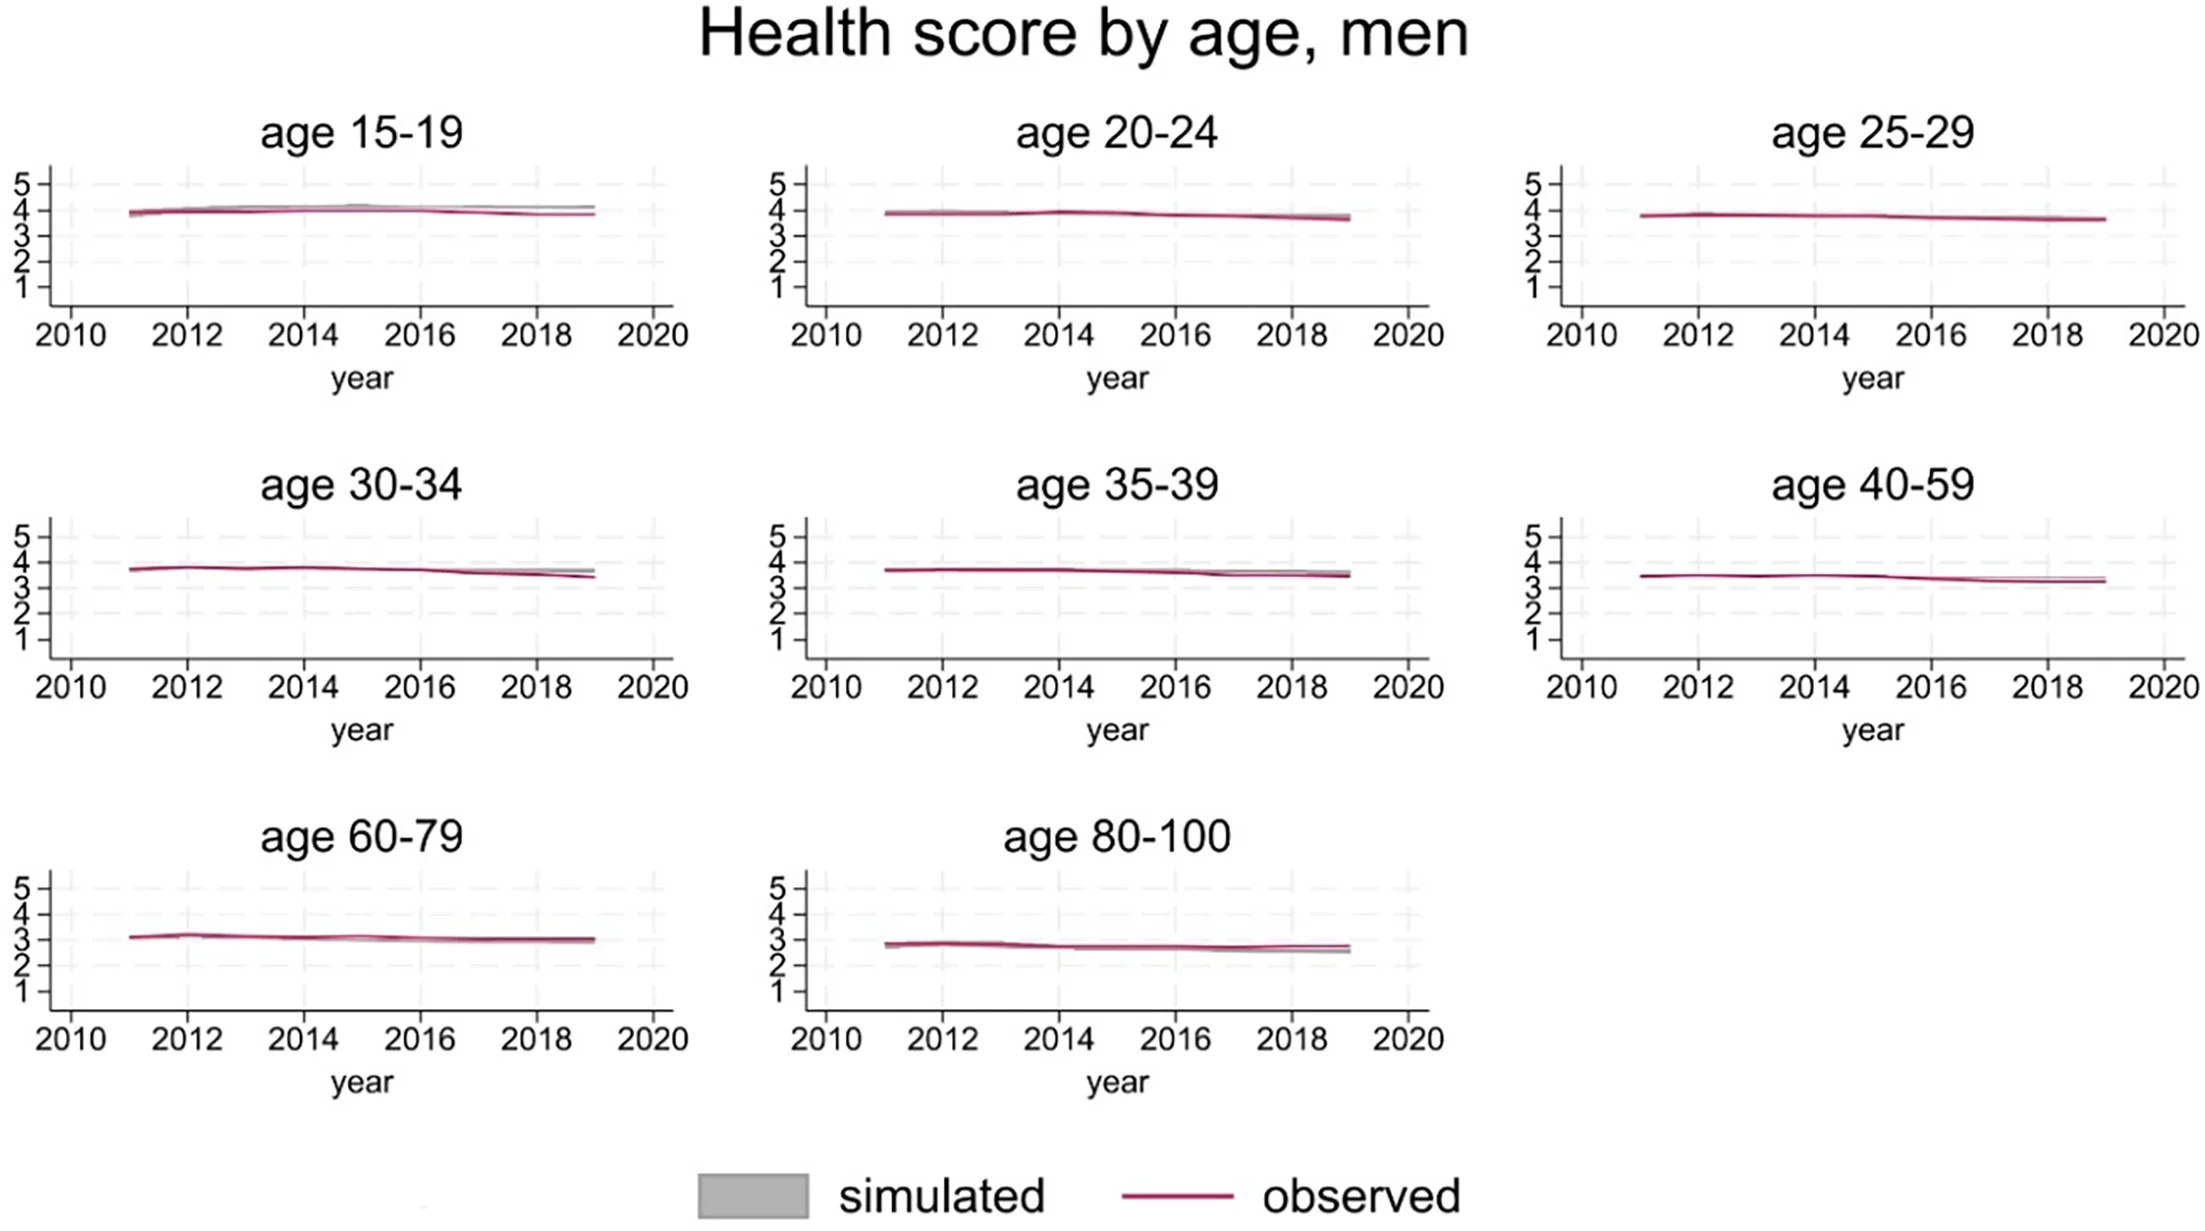
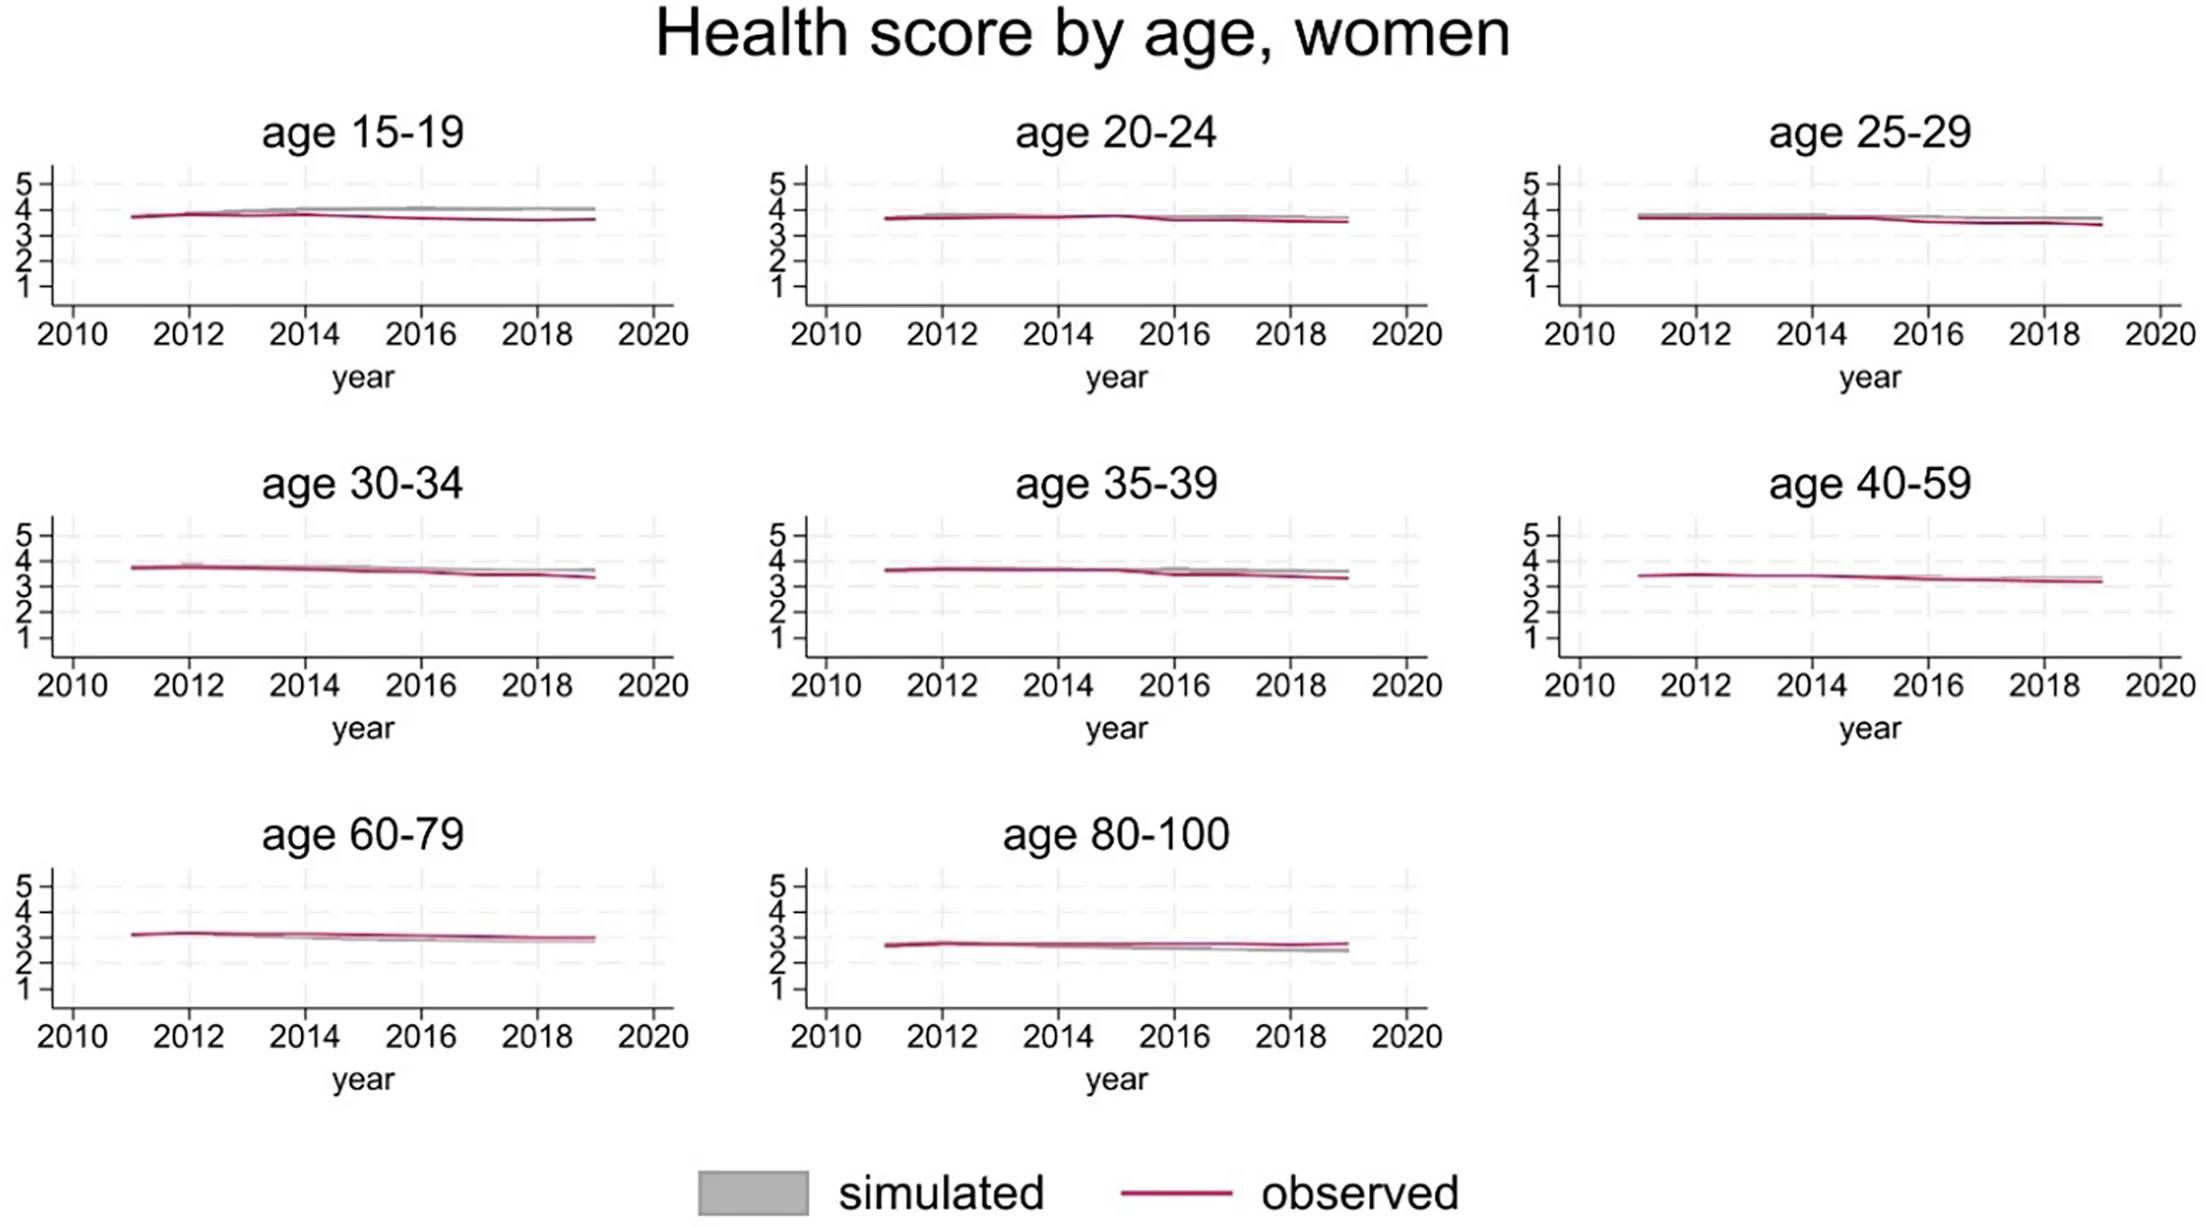
| Health | Self-rated health status for those in continuous education. |
| Self-rated health status for those not in continuous education (out of education or returned having left education in the past). | |
| Probability of becoming long-term sick or disabled for those not in continuous education. | |
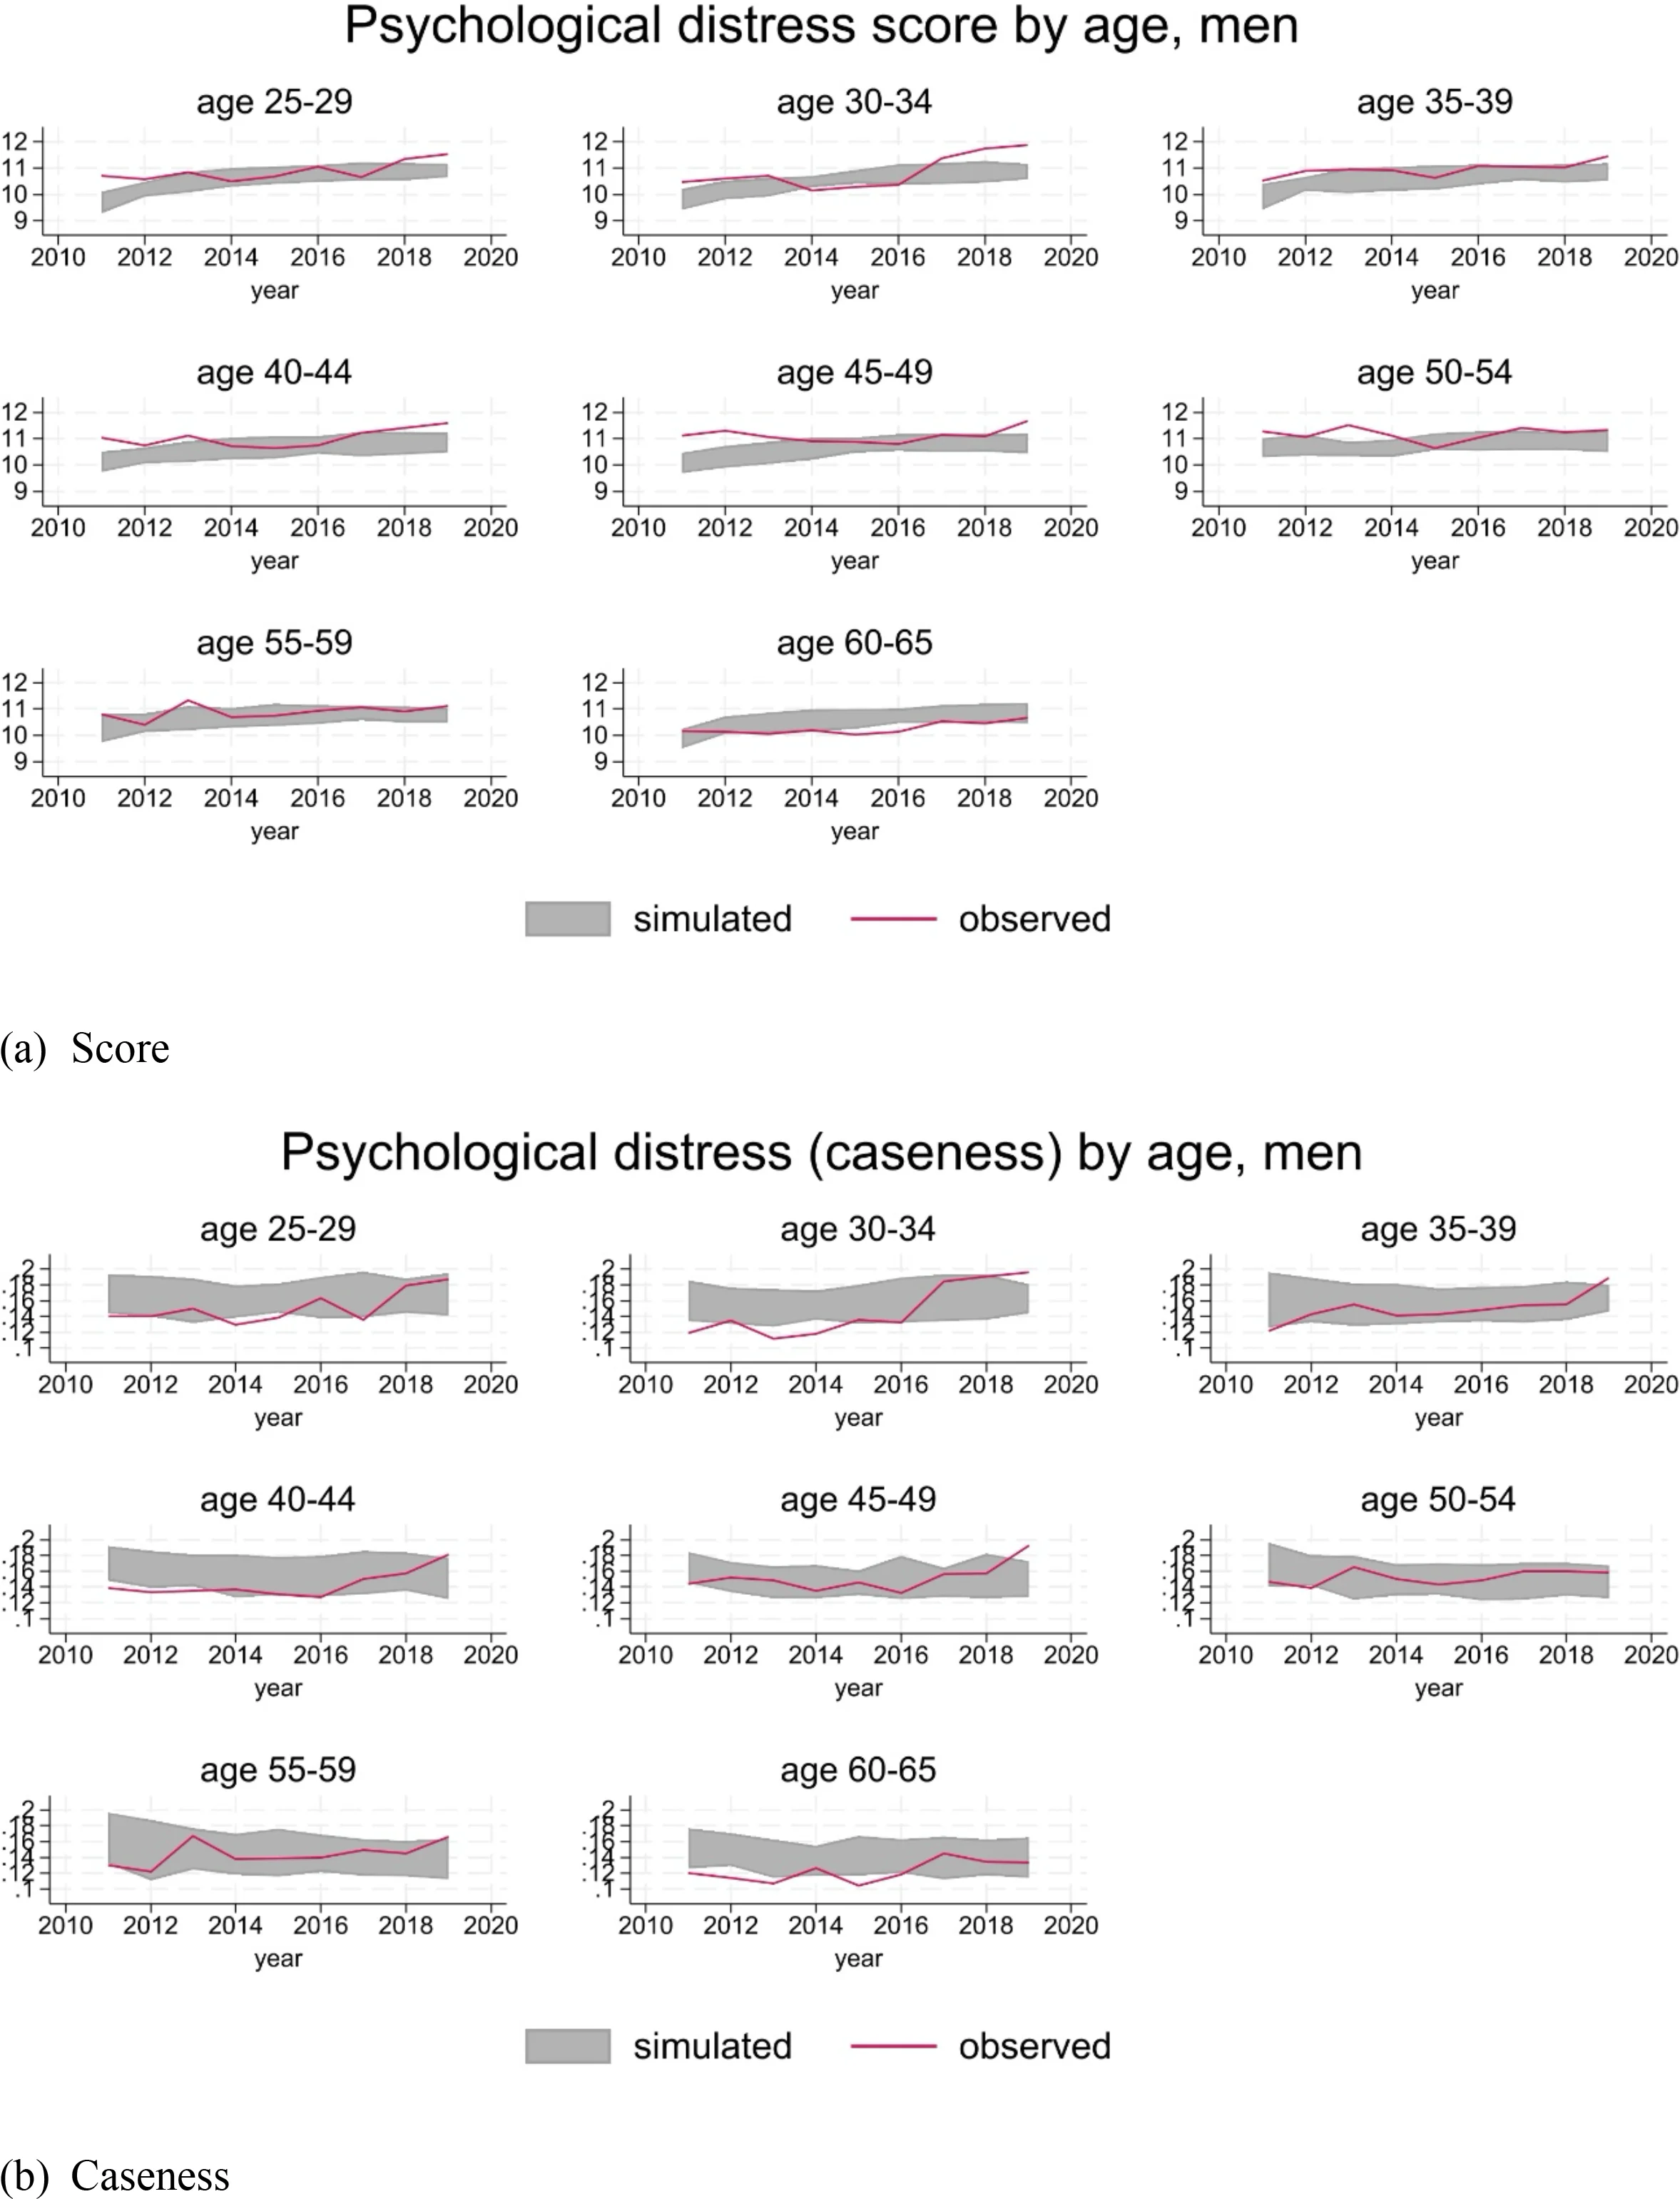
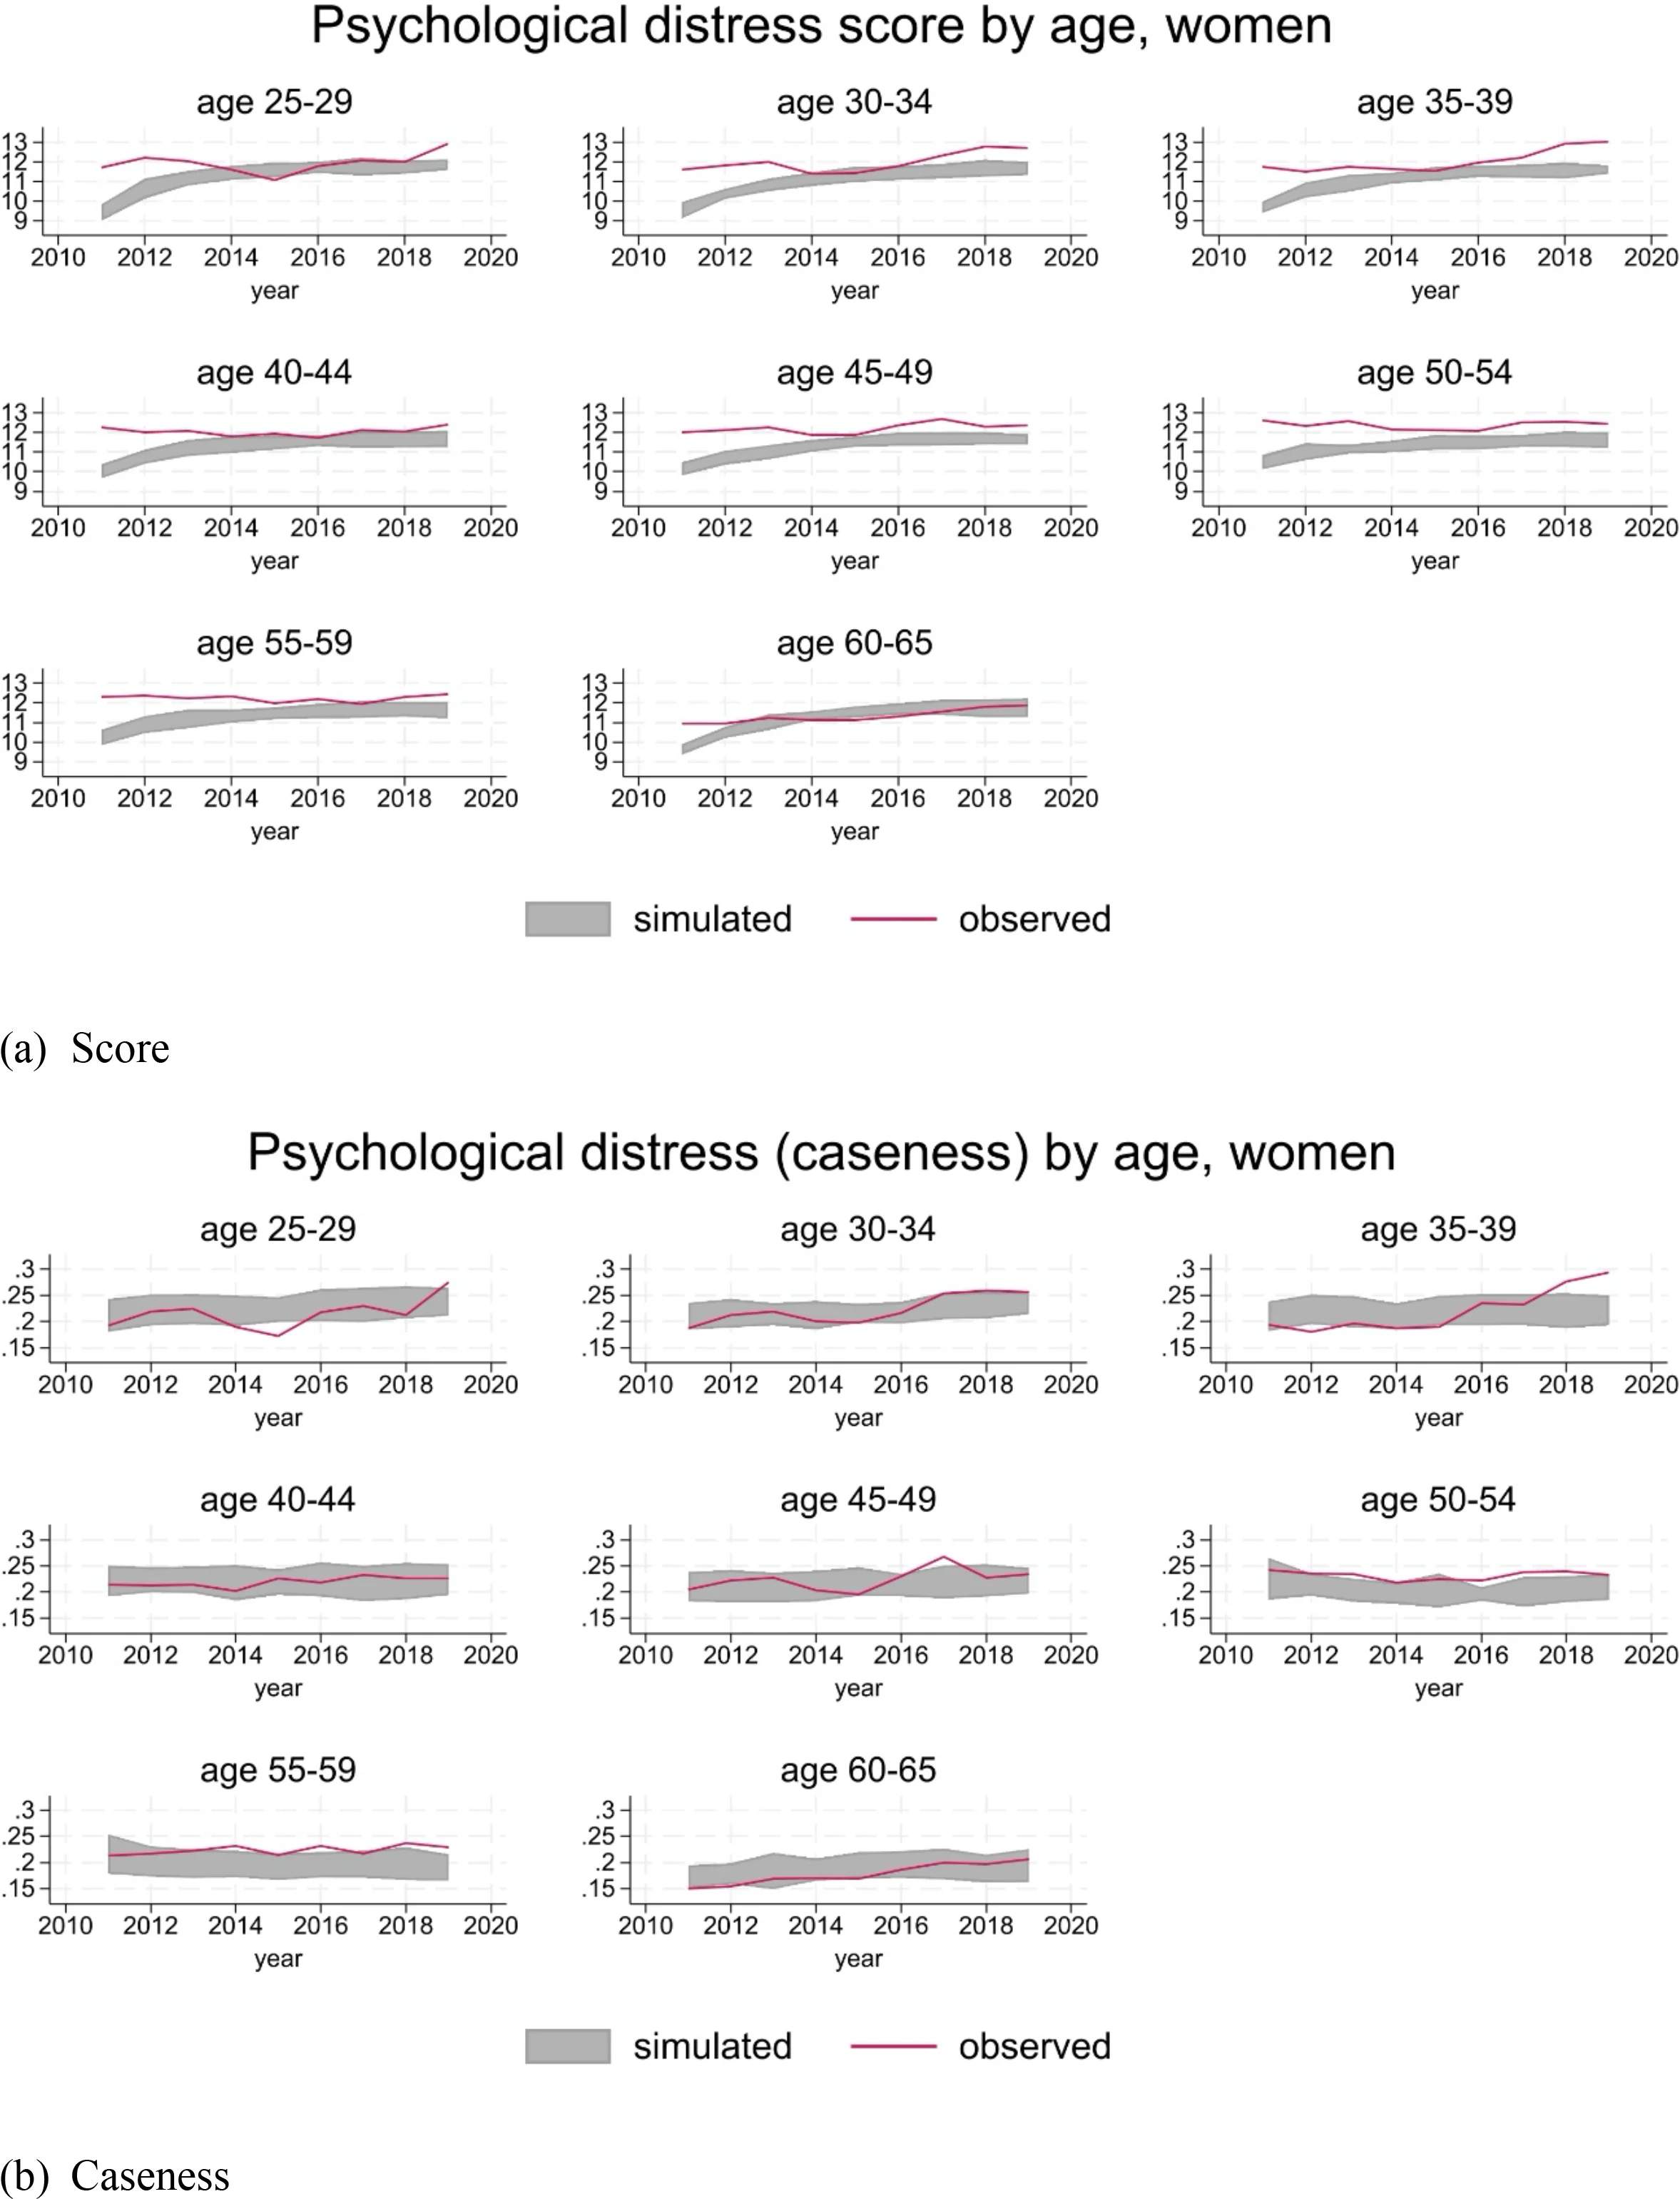
| (Mental Health (1)) Level of psychological distress on GHQ-12 Likert scale and binary case-based indicator of psychological distress. | |
| (Mental Health (2)) Effect of exposure to employment-state transitions, household income change, and poverty for individuals aged 25 – 64 on psychological distress (GHQ-12). | |
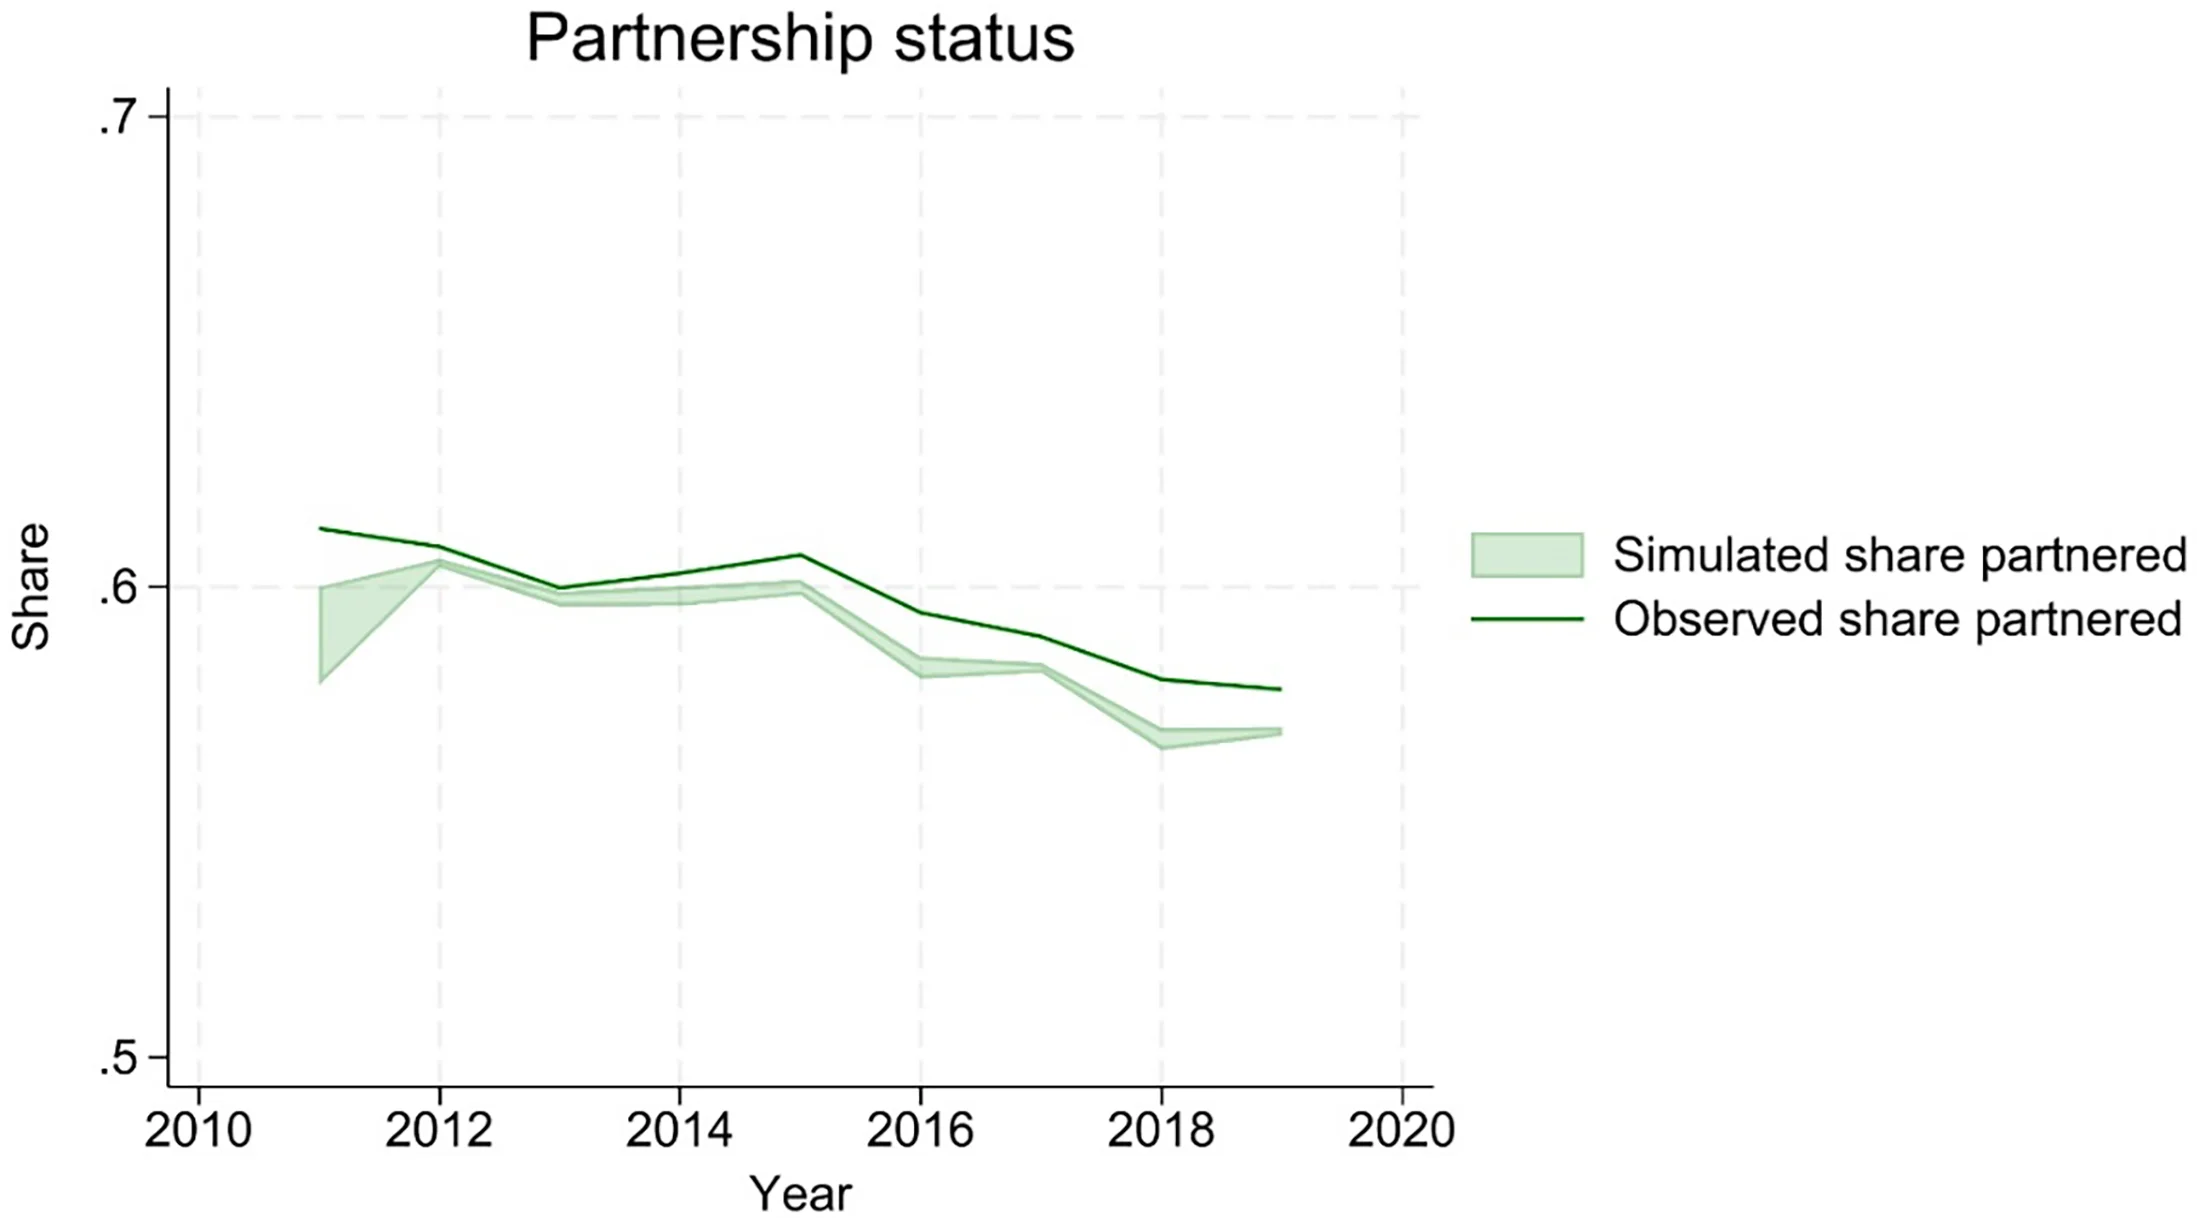
| Family composition | Probability of entering a partnership for those in continuous education. |
| Probability of entering a partnership for those not in continuous education. | |
| Probability of partnership break-up. | |
| Probability of giving birth to a child. | |
| Social care | Probability of needing care for individuals over an age threshold. |
| Probability of receiving care for individuals under an age threshold with a disability or long-standing illness or over the age threshold, distinguished by formal, partner, son, daughter, and other providers. | |
| Hours of care for those in receipt of care, and financial cost for those receiving formal care. | |
| Probability of providing informal social care. | |
| Hours of informal social care, among those providing care. | |
| Investment income | Probability of retiring for single individuals. |
| Probability of retiring for partnered individuals. | |
| Probability of receiving capital income for those in continuous education. | |
| Probability of receiving capital income for those not in continuous education. | |
| Amount of capital income for those in continuous education. | |
| Amount of capital income for those not in continuous education. | |
| Amount of pension income for those who are retired and were not retired in the previous year. | |
| Labour income | Heckman corrected wage equation; females not employed last period. |
| Heckman corrected wage equation; males not employed last period. | |
| Heckman corrected wage equation; females employed last period. | |
| Heckman corrected wage equation; males employed last period. | |
| Hours worked, single males. | |
| Hours worked, single females. | |
| Hours worked, single male adult children. | |
| Hours worked, single female adult children. | |
| Hours worked, males with dependent partner. | |
| Hours worked, females with dependent partner. | |
| Hours worked, couples. | |
| Disposable income | Benefit recipiency indicator. |
| Amount of disposable income. | |
| Consumption & saving | Consumption. |
| Home ownership. | |
| Savings and assets. | |
| Statistical display | Evaluate summary statistics for simulated population. |
| Dependent variable | |||||||||||||||||||||
|---|---|---|---|---|---|---|---|---|---|---|---|---|---|---|---|---|---|---|---|---|---|
| Control variable | student status | education level | health status | mental health | disability status | partnership status | fertility | childcare cost | home owner | retirement status | pension income (£) | capital income (£) | low wage offer | potential wage (£) | hours worked | need social care | receive social care | type of care received | amount of care received | provide social care | amount of care provided |
| gender | c | c | c | c | c | c | c | c | c | c | c | c | c | c | c | c | c | c | c | c | |
| age | c | c | c | c | c | c | c | c | c | c | c | c | c | c | c | c | c | c | c | ||
| education | l | l | c | c | c | c,l | c | c | c | c | c | c | c | c | c | c | c | c | c | c | c |
| maternal education | c | c | l | c | |||||||||||||||||
| paternal education | c | c | c | ||||||||||||||||||
| partnership status | l | c,l | l | l | c,l | c | l | c | l | l | c | c | c | c | c | c | c | ||||
| number of children | l | l | l | l | l | l | c | l | l | l | c | ||||||||||
| age of children | l | l | l | c | |||||||||||||||||
| health status | l | l | c,l | c,l | c | l | l | l | c | c | c | c | c | c | c | ||||||
| mental health | l | ||||||||||||||||||||
| disability status | l | l | l | l | c | c | |||||||||||||||
| need social care | l | ||||||||||||||||||||
| receive social care | l | ||||||||||||||||||||
| type of care received | l | c | |||||||||||||||||||
| amount of care received | |||||||||||||||||||||
| provide social care | l | c | |||||||||||||||||||
| amount of care provided | |||||||||||||||||||||
| activity status | l | l | c,l | l | l | c | l | l | l | l | l | c | |||||||||
| hours worked | c | c,l | |||||||||||||||||||
| disposable income (£) | l | c,l | l | l | l | l | c | ||||||||||||||
| employment income (£) | l | ||||||||||||||||||||
| benefit income (£) | c | ||||||||||||||||||||
| capital income (£) | l | l | l,l2 | ||||||||||||||||||
| pension income (£) | l | l | l, l2 | l,l2 | |||||||||||||||||
| potential wage (£) | l | l | l | l | |||||||||||||||||
| home owner | c | l | |||||||||||||||||||
| region | c | c | c | c | c | c | c | c | c | c | c | c | c | c | c | c | c | c | c | c | |
| year | c | c | c | c | c | c | c | c | c | c | c | c | |||||||||
Note: Each column reports the controls used to update a specific individual characteristics.