Creating a synthetic database for use in microsimulation models to investigate alternative health care financing strategies in Canada
-
Deirdre Hennessy

-
Claudia Sanmartin
-
Sabha Eftekhary
-
Laurie Plager
-
Jennifer Jones
-
Kanecy Onate
-
Neil McEvoy
-
Chantal Hicks
-
Raisa Deber
- Statistics Canada, Canada
- University of Toronto, Institute of Health Policy, Management and Evaluation, Canada
Abstract
The objective of this study was to develop a synthetic database which would be used with a microsimulation model to evaluate alternative health care financing options in Canada. The Social Policy Simulation Database (SPSD), developed by Statistics Canada, was enhanced with population-based data on health status, disability, disease status, health service use and costs from the Canadian Community Health Survey (CCHS) and other relevant data sources. The Social Policy Simulation Database and Model (SPSD/M) is a microsimulation tool designed to investigate the financial interactions between governments and individuals in Canada. Typically the SPSD/M has been used to inform policy around income tax, commodity tax, and cash transfer reform. We supplemented the model’s database with health data to enable analysis of alternative health care financing options in Canada. Data on health status, disability, disease status, health service, medication use and out-of-pocket spending on health care were drawn together from population-based surveys (including the CCHS, the Canadian Health Measures Survey (CHMS), Survey of Household Spending (SHS)), health administrative data (the Discharge Abstract Database (DAD)) and estimates of health service use and cost available in the literature. Costs of health services and drugs were assigned to individuals in the CCHS 2009/2010 (host health dataset) through imputation. The resulting health dataset was merged with the SPSD. Models using the enhanced SPSD-Health will allow health policy makers and academics to “try-out” alternative health care financing options, and consider their monetary impacts on individuals and families in Canada.
1. Introduction
Policy-makers in Canada and internationally continue to face increasing pressure to address issues related to the financing of health care services (Marchildon & Di Matteo, 2014). One of the critical issues is how to control total costs. Another issue is how to raise the necessary resources to pay for the full range of health care services, and the implications of different approaches for doing so. In Canada health care is under provincial, not national jurisdiction and the health system is a public contracting model with private delivery, known as Medicare (Deber et al., 2014). A single provincial/territorial government-run insurance plan pays for a specified set of services, with others being covered through a mix of private insurance and out-of-pocket spending. Canada’s current legislative framework mandates full public coverage for medically necessary services delivered in hospitals or by physicians. When care moves from hospitals and physicians to other providers working in the home or the community, coverage may vary by jurisdiction and client group. As one example, prescription drugs are fully covered if delivered to hospital inpatients, but may not be if the patient is treated on an outpatient basis.
As has happened in other developed countries spending on health care has increased substantially since the 1990s (Organization for Economic Cooperation and Development, 2010), with total health expenditure expected to reach $214.9 billion in 2014, representing 11% of Canada’s GDP and approximately 40% of provincial and territorial budgets (Organization for Economic Cooperation and Development, 2014). Overall, 70% of total health costs are publicly financed covering most expenditures for hospital (90%) and physician (99%) services (Organization for Economic Cooperation and Development, 2010; Canadian Institute for Health Information, 2014). The public share of services falling outside of Medicare (e.g. outpatient pharmaceuticals, dental care, rehabilitation, home-care and long-term care) varies across jurisdictions and client groups. These services are financed primarily through private sources.
Overall the private share of health expenditures in Canada has remained fairly stable at 30% since the late 1990s (Canadian Institute for Health Information, 2014). In 2012, private sector expenditures on health totalled $60.3 billion with a forecasted growth rate of 2.5% and 2.6% for 2013 and 2014 respectively, higher than public sector spending increases of 2.4% and 2.0% for the same time periods. In 2012, approximately half of private sector spending on health care was derived from out-of-pocket expenditures ($29 billion) from private households and 40% from private insurance ($24 billion). Note that, in keeping with Organization for Economic Cooperation and Development (OECD) standards, health expenditures also include non-consumption (which amounts to about 10% of private spending, and includes but is not limited to hospital non-patient revenue, capital expenditures for privately owned facilities and health research) and does not include non-professional services delivered in home and community care settings (Canadian Institute for Health Information, 2014).
Given that health care spending is one of the largest government expenditures there has been considerable discussion about alternative financing options (Marchildon & Di Matteo, 2014; Deber et al., 2014; Deber & Lam, 2011a & 2011b; Allin et al., 2011; Mallory et al., 2011; TD Bank Financial Group, 2010; Busby et al., 2014). There are several financing options being considered in Canada. One possibility is to increase the use of private insurance, with or without tax deductibility. Another is to increase the extent to which individuals pay for some or all of the care they receive, again with or without tax deductibility. Another is to increase public coverage. Another is to deem some or all of the value of the health services received to be a taxable benefit. Therefore, a clear understanding of the likely implications of these approaches for both government and individuals is essential.
While economic theory and reviews of international experiences provide some information regarding the potential impacts of these alternative financing options (Musgrove, 1996), there is currently a lack of empirical evidence regarding the potential effect of these options on the population at the individual level (e.g. with regard to equity, gainers and losers, total expenditures etc.). Furthermore, many models that have attempted to estimate the impact of various financing theories have failed to adequately account for the heavily skewed distribution of health expenditures in the population (Deber et al., 2014; Deber & Lam, 2009; Forget et al., 2008; Roos et al., 2003). One possible reason for the lack of empirical evidence is the fact that data is typically not collected on how individuals interact with the tax and health systems concurrently. These data sources are usually collected independently and used for very different types of analyses. Microsimulation is a technique that can integrate multiple and diverse data to simulate large samples of individuals in order to project economic, socioeconomic, demographic or health developments of a society in the short-term and the long-term. The explicit microanalytic foundation of these models is important in representing realistic population heterogeneities and is suitable for simulating the effects of policy interventions, like alternative health care financing options. In the field of social science, microsimulation modelling began in economics, with simulations of tax and transfer policy, where tax and transfer rules could be applied to an individual or family and the distributional effects examined (Spielauer, 2007a).
An ideal approach would be to study the long term impacts of alternative health care financing polices, however this was not possible given data constraints. Instead, a static microsimulation tool was created in order to be able to analyze policy changes in a given year. The tool begins with an existing static microsimulation database and model developed at Statistics Canada, the Social Policy Simulation Database and Model (SPSD/M), which simulates the income, expenditures, taxes and cash transfers, of a representative sample of Canadian households (Bordt et al., 1990; Hicks & Murphy, 2007). SPSD/M users can add new policy options and can customize the database to suit their policy needs. For this project, the Social Policy Simulation Database (SPSD) was enhanced with population-based cross-sectional data on health status, health service use and costs derived from a range of data sources including the Canadian Community Health Survey (CCHS), health administrative data sources and the Survey of Household Spending (SHS). This resulting database, SPSD-Health, along with custom versions of the SPSM, will allow researchers and policy makers to assess the financial impacts of alternative health care financing options on individuals and families in Canada and will allow them to examine interactions with existing medical expense tax credits. This paper describes the construction of the SPSD-Health database.
2. Methods
2.1 The SPSD/M
The SPSD/M is a microsimulation tool designed to analyse the financial interactions between governments and individuals in Canada (Bordt et al., 1990; Hicks & Murphy, 2007). Version 21.0 of the SPSD/M, database year 2009, was used for this project. It consists of two integrated parts: a database (SPSD), and a microsimulation model (SPSM).
The SPSD (database) contains over three hundred variables with basic information on demography, family structure, income, tax deductions, expenditures, employment insurance history (Statistics Canada, 2014a). It contains data for 318,712 composite individuals residing in over 100,000 households in the ten Canadian provinces. It is a synthetic database which was constructed by combining data from two surveys and two administrative files (see Figure 1).

Map of data sources used to construct the SPSD.
The host database is the Survey of Labour and Income Dynamics (SLID) collected by Statistics Canada. It is a household sample survey which excludes from its target population persons residing: in the three territories, in institutions, and on Indian reserves. Demographic and income data comes from SLID. All household members are surveyed, so results are available at the individual, family (3 definitions can be used), and household level. In 2009, there were about 50,900 person-level records available on the public-use SLID (Statistics Canada, 2009). In order to improve income tax estimates, information from administrative tax records in the form of the T1 Family File (T1FF) is imputed onto the SLID (Statistics Canada, 2009). First, the T1FF is used to impute missing deductions and tax credits onto the file. Secondly, in order to improve the estimate of total taxes, persons with high incomes on SLID are cloned and their income information is replaced by information from the T1FF.
Expenditure patterns from the Survey of Household Spending (SHS) are also imputed onto SLID records in order to model consumption taxes. Persons who receive (or are deemed likely to receive) employment insurance on SLID are cloned and Employment Insurance histories are imputed to the SPSD from administrative data on Employment Insurance.
SLID does not include the institutionalized elderly. However, because they are a policy relevant group for tax and transfer policy, they are added to the database. This is done by taking a certain number of records in SLID of elderly people who live alone and did not work the previous year. These observations are then duplicated to match the proportion in the Census by province, age and sex and are flagged as institutionalized elderly.
The techniques used to create the SPSD, which include various forms of categorical matching and stochastic imputation, are done to avoid confidential data disclosure while maintaining the coherence of the data (Statistics Canada, 2014a). While no one record on the database contains information for the same individual from the four databases, the SPSD has been constructed in such a way as to provide a micro-level representative sample of Canadians.
The SPSM (model) is the micro-simulation based model which simulates taxes and transfers for individuals in their family context. The SPSM is a static first-round impact model and is not intended to simulate how individuals’ behaviour changes in response to various policy options; rather, it simulates the immediate or short-term impact of policy changes on an individual or families holding all else constant.
The SPSD/M has been used extensively by governments, political parties, think-tanks and academics to study the impact of tax policy change on Canadians. A more detailed description of the model can be found in the following publications (Bordt et al., 1990; Hicks & Murphy, 2007; Statistics Canada, 2014a).
2.2 The health data
A number of data sources were used to supplement the SPSD with health information (see Figure 2). The imputation was done in two main steps. Firstly, the 2009/10 Canadian Community Health Survey Public Use Micro-data File (CCHS-PUMF) was used as the primary source of health information and acted as the host data for the assignment or imputation of the health care cost variables from other sources.
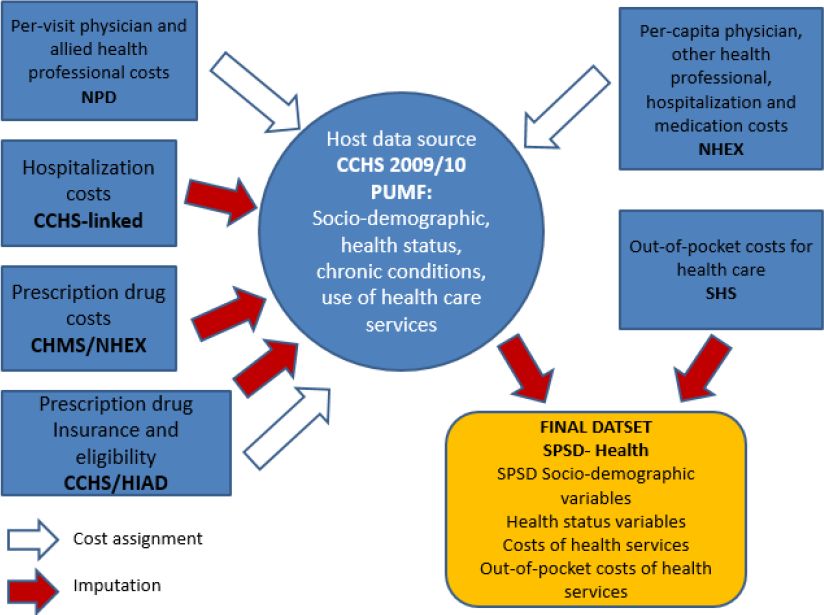
Map of data sources used to supplement the SPSD with health information.
Abbreviations: NPD = Nation Physicians Database; CCHS = Canadian Community Health Survey; PUMF = Public Use Microdata File; CHMS = Canadian Health Measures Survey; HIAD = Health Insurance Access Database; NHEX = National Health Expenditures report; SHS = Survey of Household Spending; SPSD = Social Policy Simulation Database.
The data sources and assignment/imputation methods are described in more detail below and summarized in Table 1. This was done so that the imputation of costs could use all of the health covariates that are available on the CCHS as well as to use the increased sample size of the CCHS. This resulted in a synthetic dataset with realistic, but imputed data on both health status and health expenditures. A sample of records of this dataset were then statistically matched, described in more detail in Section 2.3 below, to those in the SPSD in order to end up with synthetic records that include both detailed income and tax information as well as detailed health information.
Table of data source and methods used to impute costs of health services and out-of-pocket costs.
| Cost type | Data source | Method | Matching/ Imputation Variables | |
|---|---|---|---|---|
| 1. | Cost per visit to physicians | Schedule of costs form the NPD, publicly available from CIHI | Simple multiplication of unit cost per-visit by number of physician visits reported in the CCHS 2009/10 PUMF | n/a |
| 2. | Cos per visit allied health professionals | Schedule of costs from Association of Workers Compensation Boards of Canada (AWCBC), publicly available from AWCBC | Simple multiplication of unit cost per-visit by number and type of allied health professional visit reported in the CCHS 2009/10 PUMF | n/a |
| 3. | Hospitalization costs | CCHS 2007/08 linked to the CIHI DAD for the calendar year 2008–2009 | Annual hospitalization costs were calculated for hospitalized respondents of the CCHS 2007/08linked to the DAD 2008–2009. Hospitalization costs were imputed onto the CCHS 2009/10 PUMF using “hot-deck” methods. | Separate imputations for males and females. Age, income, chronic disease and disability status |
| 4. | Prescription drug costs | CHMS and British Colombia Drug Atlas 2nd edition. Reference population/period is the British Columbia population in 2006- Publicly available from the University of British Columbia |
Average annual cost of drugs by class is assigned to respondents of the CHMS 2007 to 2011. Drug costs are then imputed onto CCHS 2009/10 PUMF, using “hot-deck” methods. | Separate imputations for males and females. Age, income and chronic disease status. |
| 5. | Prescription drug insurance | CCHS 2007 Rapid Response | Hot-deck | Separate imputations for males and females. Age, income and chronic disease status. |
| 6. | Prescription drug insurance eligibility | HIAD | Assignment | n/a |
| 7. | Out-of-pocket costs for health care | SHS | Hot-deck | Income |
| 8. | Per-capita healthcare costs | CIHI NHEX | Assignment | n/a |
-
Abbreviations: NPD = Nation Physicians Database; CIHI = Canadian Institute of Health Information; DAD = Discharge Abstract Database; CCHS = Canadian Community Health Survey; PUMF = Public Use Microdata File; CHMS = Canadian Health Measures Survey; HIAD = Health Insurance Access Database; NHEX = National Health Expenditures report; SHS = Survey of Household Spending
2.2.1 The CCHS-PUMF
The CCHS is a cross-sectional survey that collects information related to health status, health care utilization and health determinants for the household population in Canada. This is a national survey with approximately 130,000 respondents per cycle and is designed to provide reliable estimates at sub-provincial (health region) level. The CCHS covers the population 12 years of age and over living in the ten provinces and the three territories with certain exclusions (described in more detail in Table 2). The CCHS uses a multistage stratified cluster design and has response rates over 78%. The survey is conducted through telephone and in-person interviews and all responses are self-reported. The details of the survey methodology have been previously published (Statistics Canada, 2011).
Summary of populations excluded from the health surveys.
| Data source | Data type | Exclusions |
|---|---|---|
| CCHS | Population-based survey | • Children younger than 12 years • Persons living on reserves and other Aboriginal settlements. • Full-time members of the Canadian Armed Forces. • Residents of institutions including institutions for the elderly and prisons. • Some remote areas of Quebec |
| CHMS | Population-based survey | • Cycle 1 excluded children under 6 years • Cycle 2 excluded children under 3 years • Persons living in the 3 territories, Yukon, Northwest Territories and Nunavut. • Persons living on reserves and other Aboriginal settlements. • Full-time members of the Canadian Armed Forces. • Residents of institutions including institutions for the elderly and prisons. • Some remote areas of Canada. |
-
Abbreviations: CCHS-Canadian Community Health Survey; CHMS-Canadian Health Measures Survey.
The CCHS-PUMF is a publicly available version of the CCHS microdata file that has been modified for confidentiality reasons to allow public release. Modifications include categorization of continuous variables (such as age and income), collapsing of variable categories, suppression of individual values and stripping of certain variables from the dataset. The CCHS-PUMF was used in this project so that it could be merged with the already non-confidential SPSD, and released from Statistics Canada for use by external researchers and government officials.
For this study, we used the 2009/10 CCHS-PUMF as it was collected in the same timeframe as the underlying income and expenditure data contained in the SPSD. We retained limited data fields from the CCHS-PUMF including socio-demographic variables (province, age group, sex, marital status, income category, housing tenure and household size) to enable matching to the SPSD. As well, we included information on health status and disability measured both by self-report and the Health Utilities Index (HUI), presence of one or more chronic diseases, self-reported visits to physicians and allied health professionals and the survey weight; see Table 3 for the data dictionary. Data from residents of the Yukon, Nunavut and the Northwest Territories were excluded because these territories were not covered by the SPSD. The population of these territories was approximately 108,000 in 2009, which composed 0.003% of the total Canadian population (Statistics Canada, 2014b). The final un-weighted sample size of the CCHS-PUMF data used was 124,188.
Data dictionary of the SPSD-health.
| Variable description | Data source | Variable type | Categories |
|---|---|---|---|
| Chronic health condition | CCHS | Numeric | 0-None, 1-One, 2-Two + |
| Disability flag | CCHS | Categorical | 0-No- 1-Yes |
| Imputed prescription drug insurance status | CCHS | 0-No- 1-Yes |
|
| Self-perceived health | CCHS | Categorical | 0-poor-4-excellent, 5 not stated |
| Self-perceived mental health | CCHS | Categorical | 0-poor-4-excellent, 5 not stated |
| Health Utility Index, category | CCHS | Categorical | 0-None, 1-Mild, 2-Moderate, 3-Severe |
| Annual cost per capita for any doctor | NHEX | Numeric-dollars | 0-max |
| Annual cost per capita of hospital stay | NHEX | Numeric-dollars | 0-max |
| Annual cost per capita of other professionals | NHEX | Numeric-dollars | 0-max |
| Annual cost per capita of drugs | NHEX | Numeric-dollars | 0-max |
| Annual cost for visits to family doctor | CCHS | Numeric-dollars | 0-max |
| Annual cost for visits to specialist doctor | CCHS | Numeric-dollars | 0-max |
| Annual cost for visits to eye doctor | CCHS | Numeric-dollars | 0-max |
| Annual cost for visits to physio | CCHS | Numeric-dollars | 0-max |
| Annual cost for visits to SAOT | CCHS | Numeric-dollars | 0-max |
| Annual cost for visits to PSYCH | CCHS | Numeric-dollars | 0-max |
| Imputed annual cost of hospital stay | DAD | Numeric-dollars | 0-max |
| Imputed annual cost of drugs | CHMS | Numeric-dollars | 0-max |
| Annual OOP costs for prescribed drugs | SHS | Numeric-dollars | 0-max |
| Annual OOP costs for other medicines and pharmaceutical products drugs | SHS | Numeric-dollars | 0-max |
| Annual OOP costs for healthcare supplies | SHS | Numeric-dollars | 0-max |
| Annual OOP costs for physician care | SHS | Numeric-dollars | 0-max |
| Annual OOP costs for eye care goods and services | SHS | Numeric-dollars | 0-max |
| Annual OOP costs for dental services | SHS | Numeric-dollars | 0-max |
| Annual OOP costs for hospital care | SHS | Numeric-dollars | 0-max |
| Annual OOP costs for healthcare practitioners | SHS | Numeric-dollars | 0-max |
| Annual OOP costs for other medical services | SHS | Numeric-dollars | 0-max |
-
Abbreviations: CCHS-Canadian Community Health Survey; NHEX-Nation Health Expenditures Survey; DAD-Discharge Abstract Database; CHMS-Canadian Health Measures Survey; SHS-Survey of Household Spending; OOP-Out-of-pocket; SAOT-Speech language pathologist, audiologist or occupational therapist; PSYCH-Psychologist
2.2.2 Assignment of per-visit costs of physicians and allied health professionals
The data sources and methods used to assign per-visit costs of physicians and allied health professionals are summarized in Table 1. The cost per-visit to family physicians and specialist physicians was obtained from the National Physician Database 2009–2010, available from the Canadian Institutes for Health Information (CIHI) (Canadian Institute of Health Information, 2011a). In the CCHS visits to physicians were self-reported in three categories: family physicians, specialist physicians and eye-doctors. Physician costs were calculated by multiplying the annual number of self-reported visits per-individual, to a physician (by type) by the cost per-visit (by type). Because fee schedules are set on a provincial basis, cost per-visit will differ by province; therefore, different costs for each physician category were applied to respondents by province. If respondents had more than one type of physician visit per-year then the costs for all visits were summed to get an annual cost by type of physician.
The cost per-visit to allied health professionals was obtained from a schedule of health care costs publicly available from the Workers Compensation Board of Canada in 2013 (Association of Workers Compensation Boards of Canada, 2013). A comprehensive schedule of costs by province was not available in earlier years. Annual numbers of visits to speech language therapists, audiologists, occupational therapists (reported as 1 group), physiotherapists, chiropractors, and psychologists, were self-reported in the CCHS. Costs were calculated by multiplying the number of self-reported visits per-individual to a health professional by the cost per-visit. If respondents had more than one visit to an allied health professional per-year then the costs for each visit were summed to get an annual cost. The list of health professionals above is not exhaustive and visits to other professionals, for instance dentists, social workers and counsellors were also self-reported in the CCHS; however, costs per-visit to these professionals were not available. In the absence of reliable cost estimates, costs for these health professionals were not assigned in this iteration of the model. Note that such costs are almost entirely privately paid in Canada.
This approach has some limitations. The accuracy of these cost estimates relies on the self-reported number of visits. If the numbers of visits are under-reported then assigned costs will under-represent true costs. Studies which have looked at the correspondence between self-reported and routinely collected health care utilization data have shown inconsistent results. For example, an Ontario study which investigated agreement between self-reported and routinely collected health care utilization data among seniors found near perfect agreement between contact utilization measures. Seniors tended to over-report their contacts with General Practitioners but under-report their contacts with other medical specialities (Raina et al., 2002). Alternatively, an American study of women with co-occurring disorders concluded that self-reporting provides reliable data on service quantity and is adequate for economic evaluations (Chung et al., 2008). Other characteristics can also affect ones’ ability to accurately report health care system contacts. In general, males aged 75 or older, of lower socio-economic status, and in poorer health have more difficulty accurately recalling health service use (Raina et al., 2002; Chung et al., 2008). In addition the CCHS represents community-dwelling Canadians, who are in general healthier than those living in institutions. In the absence of detailed information about health care use in institutionalized populations the information on the CCHS was statistically matched on to institutionalized people in the SPSD. We discuss this limitation of the model in more detail below. Only information about the costs of physician by type were added to the SPSD during statistical matching, information on the number of visits by individuals were not included.
2.2.3 Imputation of hospitalization costs
The data sources and methods used to impute hospitalization costs are summarized in Table 1. Hospitalization costs were obtained from the CIHI Discharge Abstract Database (DAD), which is a national database containing demographic, administrative and clinical data on hospital discharges across Canada, excluding the province of Quebec. CIHI receives data directly from participating hospitals. These include all public hospitals in every province and territory, except Quebec. Periodic re-abstraction studies which compare what is contained in the patient’s health records with what exists in CIHI’s DAD consistently find that most non-clinical data elements are of a high quality and that the diagnoses and interventions captured by the DAD are consistently reported (Canadian Institute of Health Information, 2010). Discharge records of inpatients in acute care hospitals and some psychiatric, chronic and rehabilitation hospitals across Canada are included, as are some day surgery records.
The DAD was probabilistically linked to the CCHS at Statistics Canada using individual level information common to both data sets including birth date, sex, postal code and Health Information Number (HIN). Only those respondents who agreed to share and link their data were included in the linkage. More information regarding the linkage of the CCHS to DAD is provided elsewhere (Rotermann, 2009).
We calculated the annual hospital costs of respondents in the CCHS 2007 whose survey record was linked to one or more DAD records in the 2008–2009 calendar year, the most recent year of linked survey data available at the time of analysis. Hospital costs were obtained by multiplying the Resource Intensity Weight (RIW) and the Cost Per Weighted Case (CPWC) for each hospital admission. If the individual had more than one hospital admission then the costs for all admissions were summed to get an annual cost.
The RIW is calculated and added to the DAD file by CIHI and represents the anticipated relative resource use of each patient within a clinically similar group of patients, known as a Case Mix Group (CMG). RIWs are not the actual cost of services the patient received but are the best available source to be able to adjust the relative costs of those services. Additional details about RIWs and/CMG+ methodology are available in published reports (Canadian Institute of Health Information, 2011b; Canadian Institute of Health Information, 2007; Wodchis et al., 2013). The CPWC is obtained from the CIHI Management Information System (MIS) database which contains financial information on how money is spent on health care services in inpatient acute care hospitals in Canada. The CPWC at the provincial/territorial level represents the average cost of one patient receiving service in a hospital within that province/territory. For more information on the CPWC methodology see CIHI’s published reports (Canadian Institute of Health Information, 2011b; Canadian Institute of Health Information, 2007; Wodchis et al., 2013).
Once annual hospital costs were calculated for respondents to the CCHS 2007, hot-deck imputation was used to assign these costs to similar respondents in the CCHS 2009/10 PUMF. These methods, used in survey research and microsimulation to impute missing items or missing variables, have been previously used to impute risk exposure, such as blood pressure and cholesterol, into individuals’ profiles for microsimulation (Hennessy et al., 2011). Hot-deck imputation randomly assigns an actual value of the variable from donor data within imputation classes; these classes are constructed based on cross-classifications of fully observed variables common to both data files (for instance age group and sex). The resulting imputed values should have the same distributional shape as those in the donor survey (Hennessy et al., 2011; Durrant, 2005).
In order to choose the variables useful for imputation, we first completed a descriptive analysis of hospital costs in the CCHS 2007 by socio-demographic and health variables such as age group, sex, income category, marital status, chronic disease status, disability status, smoking status and obesity status. Further multivariate regression analysis revealed important differences in hospital costs by sex, age group, income category, chronic disease status and disability status. To ensure that the distribution of costs was adjusted for the main socio-demographic variables (age, sex and income) that would be available to match records with the SPSD, we did separate hot-deck imputations for males and females and then used age group, income category, chronic disease status and disability status as matching variables in the hot-deck imputation between the CCHS 2007 and CCHS 2009/10.
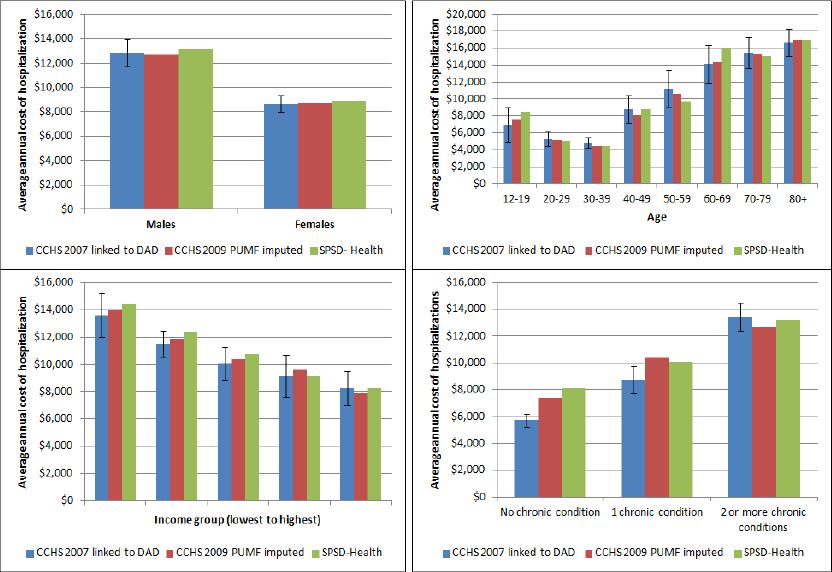
A validation of the hot-deck imputation was completed by comparing the distribution of the actual to imputed hospital costs by important socio-demographic factors including sex, age group, income category and chronic disease status. Figure 3 compares mean hospital costs for the original source data (CCHS 2007 linked to DAD) to the imputed data (CCHS 2009/10 PUMF) and also to the results obtained from the fully assembled SPSD-Health data.

Validation of imputed hospitalization costs.
Abbreviations: CCHS-Canadian Community Health Survey; SPSD-Health-Social Policy Simulation Database-Health.
This approach has some limitations. Estimated costs produced from multiplying RIWs by CPWCs are not actual costs but those based on statistical models, which used unit cost information derived from only two Canadian provinces, Ontario and Alberta (Wodchis et al, 2013). Total inpatient hospitalization estimates include only hospitalizations in which the patient was admitted to an acute-care facility. In addition, the CPWC estimates exclude all fee-for-service physician remuneration for in-hospital care, although many of these billings would be captured in the physician cost estimate. Finally, although hospital costs were not available for Quebec the hot-deck imputation assigned costs to CCHS respondents in Quebec, making the assumption that costs in this province were similar to those in other provinces.
2.2.4 Imputation of prescription medication costs
The data sources and methods used to impute medication costs are summarized in Table 1. No single national database exists in Canada that provides comprehensive information regarding prescription drug use, costs and socio-demographic and health status information of prescription drug users at the population level. As a result, data on prescription drug costs was generated from two different sources. First, the Canadian Health Measures Survey (CHMS), which provides national level information on the prevalence of prescription drug use for specific drug types was used to identify individuals in the population using prescription medication (Tremblay et al., 2007). Second, the British Columbia (BC) Drug Atlas 2nd Edition was used to provide an average annual expenditure by class of drug (Morgan et al., 2009). Note that this excludes over-the-counter medications, which are entirely paid for out-of-pocket in Canada.
The CHMS is conducted by Statistics Canada in partnership with the Public Health Agency of Canada and Health Canada. Data collection is completed in two steps: an interview at the respondent’s home and a visit by the respondent to the CHMS mobile examination centre where physical measures were taken. The survey represents Canadians living in private dwellings with certain exclusions (see Table 2 for more details). Cycle 1 took place from March 2007 through February 2009, and collected information from respondents aged 6 to 79 living in private households in 15 locations across Canada. Cycle 2 took place from August 2009 through November 2011, and collected data from respondents aged 3 to 79 living in private households in 18 locations (Giroux et al., 2013). The total sample from Cycle 1 and 2 was 11,999. Information about prescription drug use was collected by asking respondents to produce the medication they were currently taking. Drug identification numbers (DINs) were collected from medication containers during the household interview and verified during the mobile examination centre visit. Current medication use was defined as any medication taken by the respondent on either the day of the household interview or the previous day; up to 15 medications were recorded for each respondent. Each DIN has a World Health Organization (WHO) Anatomical Therapeutic Chemical (ATC) classification code assigned by Health Canada (WHO, 2014). The ATC structure divides active substances into groups according to the organ or system on which they act and their therapeutic, pharmacological and chemical properties. The leading prescription medication classes are commonly defined using level-3 ATC codes, which represent major therapeutic or pharmacological subgroups. Information on prescription medication use was obtained from 11,999 CHMS respondents aged 3 to 79. Prescription medication information from the CHMS was found to produce similar patterns of drug use at the population level, compared with other Canadian and American studies (Rotermann et al., 2014; Stagnitti, 2004).
The cost of prescription drugs were derived from the BC Drug Atlas. In Canada limited information exists about prescription medication costs. Among the provinces only BC collects comprehensive administrative data (Morgan et al., 2009). The Atlas included a measure of the “spending per-user of treatment in BC” representing the annual cost of the specific medication. The medications reported by respondents to the CHMS were classified into the same broad classes available in the BC Drug Atlas, and the figure for “spending per-user of treatment in B.C” was applied to each drug class available. If CHMS respondent took more than one drug they received more than one cost, which were added up across respondents. If there was no cost available for the drug (which was the case for approximately 30% of drugs reported in the CHMS) then respondents with missing values received an age-specific per-capita cost representing an average annual cost for all prescription medications obtained from the National Health Expenditures Report produced by CIHI for the year 2009 (Canadian Institute for Health Information, 2014).
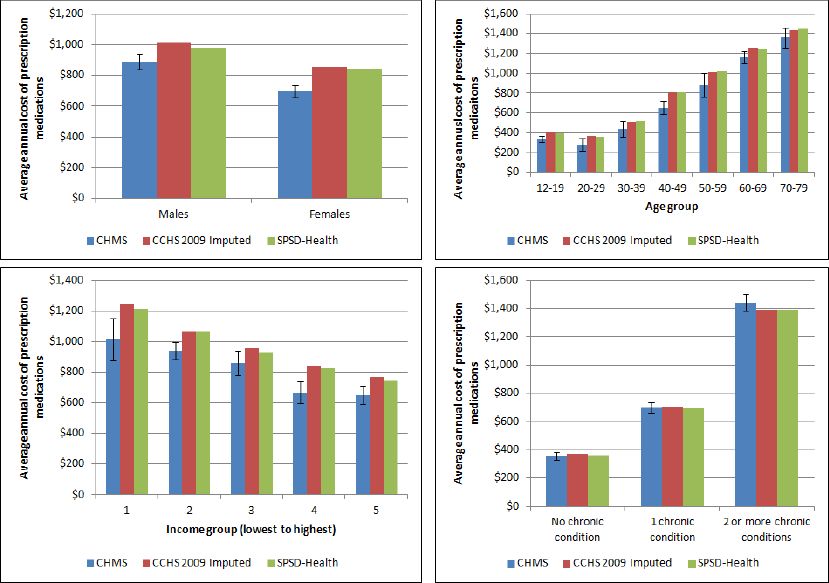
Once prescription drug costs were assigned to CHMS respondents’, hot-deck imputation, as previously described, was completed to assign drug costs to similar respondents in the CCHS 2009/10 PUMF. Descriptive and regression analysis revealed important differences in drug costs by sex, age group, income category and chronic health status. We did separate hot-deck imputations for males and females and then used these variables to match respondents on the CHMS 2007/2011 and CCHS 2009/10. While other variables were also important we were concerned about getting the distribution of costs correct by the main socio-demographic variables (age group, sex and income category) in order to match records with the SPSD. A validation of the hot-deck imputation was completed by comparing the actual to imputed drug costs by important socio-demographic factors including sex, age group, income category, chronic disease status and disability status. Figure 4 compares mean prescription drug costs for the original source data (CHMS 2007–2011) to the imputed data (CCHS 2009/10 PUMF) and also to the results obtained from the fully assembled SPSD-Health data.

Validation of imputed medication costs.
Abbreviations: CCHS-Canadian Community Health Survey; SPSD-Health-Social Policy Simulation Database-Health.
This approach has limitations. Obtaining complete costing data for every drug reported in the CHMS was extremely challenging and therefore our estimates likely underestimate the total costs of medications used. Although we combined two cycles of the CHMS, the total number of records available for imputation was small (approximately 5,000 individuals taking prescription medications). This discrepancy in sample sizes could lead to less variability than realistic in the imputed values. In addition the CHMS likely represents a healthier sample of the Canadian population, given that respondents must be living in the community to be sampled for the survey and must be able to leave home to attend a clinic visit. As well the CHMS does not represent individuals living in institutions, who are likely heavier users of medications. This survey, although comprehensive, only provides a snapshot of medication use in time therefore we likely underestimated the true cost of medications because cross-sectional data collection underestimates use of medication overall. Another limitation of this approach was using BC as the sole source of the costing information. The BC drug Atlas provides the most comprehensive picture of drug spending of any province in Canada however analysis in 2 consecutive versions of the Canada Drug Atlas found that BC also has some of the lowest costs for drugs across the country (Morgan et al., 2013; Morgan et al., 2008).
2.2.5 Imputation of prescription drug insurance status and eligibility
Unlike hospital and physician care, prescription medications (other than those provided in hospital) are not covered by a universal public insurance plan in Canada. All Canadian provinces provide some degree of publicly funded drug insurance for certain segments of the population (i.e. seniors and those on social assistance), but provinces differ in their coverage of prescription medications for other patient groups. For many Canadians, prescription medications are financed primarily through private insurance and out-of-pocket expenditures (Canadian Institute for Health Information, 2014; Luffman, 2005). CIHI reports that out-of-pocket expenditures made up 34.3% of total spending on prescription medications in 2010 (Canadian Institute for Health Information, 2014). Using two different data sources we imputed prescription drug insurance status and assigned eligibility for public insurance (e.g. insurance paid for by the government). The data sources and methods used to impute/assign drug insurance status and eligibility are summarized in Table 1.
Status
Prescription drug insurance (PDI) status was obtained from a CCHS 2007 rapid response module. This questionnaire asked respondents “Do you have insurance that covers all or part of the cost of your prescription medications? Please include any private, government or employer-paid plans”. This question was asked of approximately 10,000 respondents.
Hot-deck imputation, as previously described, was used to assign PDI to similar respondents in the CCHS 2009/10 PUMF, using sex, age group, income category and chronic health status as the matching variables. A validation of the hot-deck imputation was completed by comparing the original to imputed PDI by important socio-demographic factors including sex, age group, income category, chronic disease status and disability status. Figure 5 compares the percentage with prescription drug insurance in the original source data (CCHS 2007) to the imputed data (CCHS 2009/10 PUMF) and also to the results obtained from the fully assembled SPSD-Health data. Compared to the size of the CCHS 2009/10 PUMF (over 100,000 respondents) there were only a small number of donor records available for hot-deck imputation, approximately 10,000. This discrepancy in sample sizes could lead to less variability than realistic in the imputed values. In addition, the question in the CCHS 2007 asked about both private and public insurance plans combined. In reality this subset of individuals represents a mix of those who are eligible for public insurance and those who can pay for private insurance.

Validation of imputed drug insurance status.
Abbreviations: CCHS-Canadian Community Health Survey; SPSD-Health-Social Policy Simulation Database-Health.
Eligibility
Prescription drug insurance eligibility (PDIE) was obtained from the Health Insurance Access Database (HIAD). This database was created by Dr. Quesnel-Vallee at McGill University and qualitatively details public drug insurance plans across Canada from 1990 to 2010 (Quesnel-Vallee, 2014). Based on information extracted from the HIAD a flag was created in the SPSD to assign PDIE to all individuals over 65 years of age and to those receiving social assistance. This was the common minimum level of PDIE across all the provinces in Canada in 2010. Many of the provincial rules detailed in the HIAD depended on being in specific care-settings, like long-term care, or suffering from a variety of disabling diseases. Unfortunately, the SPSD-Health data does not contain information about care-settings or specific chronic diseases; therefore, it was impossible to incorporate all of the rich detail available in the HIAD.
2.2.6 Imputation of out-of-pocket costs for health care
The data sources and methods used to impute out-of-pocket costs for health care services and products are summarized in Table 1. Out-of-pocket spending on health care services and products, including prescription drugs, physicians and hospitals was obtained from the 2009 Survey of Household Spending (SHS). The SHS is conducted annually among private households in Canada to collect information on annual household expenditures for a range of services and products including health care services; the SHS does not contain information regarding use of health care services. The SHS is conducted in all 10 provinces and excludes residents of institutions, members of the Canadian Forces living in military camps and people living on reserves. In all, these exclusions make up about 2% of the population of the 10 provinces. Total household expenditures for health care services includes direct expenditures for a range of services including dental care, eye care and prescription medications. Direct expenditures are defined as those not covered by insurance such as exclusions, deductibles and expenses over limits and exclude payments for which individuals have been or will be reimbursed (Statistics Canada, 2010).
The SHS differs from the CCHS in that the unit of collection and analysis is the household not the individual. This presented a challenge when assigning out-of-pocket expenses to individuals in the SPSD. Assumptions about how the out-of-pocket expenses were distributed within the household had to be made and were described in more detail below. Although these assumptions may not always reflect the reality of household spending on healthcare they are amenable to change within the model. Moreover the SPSD/M is flexible enough to produce output using various units of analysis (individual, census family, economic family and household).
Hot-deck imputation, as previously described, was used to assign household out-of-pocket expenses to households in the already assembled SPSD-health data. That is, after the CCHS 2009/10 PUMF and imputed health cost data was merged with to SPSD, see Section 2.3. Household income was used as the matching variable for hot-deck imputation because it was the only household level variable on the CCHS. Out-of-pocket expenses for drugs were imputed separately onto households with drug users (who had been assigned drug costs in previous imputations), while all the other out-of-pocket health care expenses were imputed as a vector. That is, all the other expenses were taken from one donor record, on the SHS and given to appropriate donee records on the SPSD-Health.
Once the data had been statistically matched to the SPSD, household expenses were split among household members based on a number of assumptions that are easily changed within the model. In this iteration of the model we assumed that out-of-pocket health care expenses tend to increase with age, therefore 50% of total household health care expenses (except prescription drugs) were assigned to household members over 65 years. If the household was entirely elderly people or there were no elderly individuals, the health care expenses are shared equally among the members. If the household was a mix of elderly and non-elderly, half of the health care expenses for the household were shared equally among the number of elderly and the other half were shared equally among the non-elderly.
Out-of-pocket (OOP) expenses for prescription drugs were treated differently. Only individuals within households with an imputed drug cost (which is originally based on drug use from the CHMS 2007–2011) were assigned out-of-pocket prescription drug expenses. Expenses were split evenly by the number of individuals with imputed drug-costs within the household, regardless of age. Validation of the hot-deck imputation was completed by comparing the distribution of out-of-pocket expenses in the original (SHS 2009) and imputed data (SPSD-Health). Figure 6 compares the mean across all the categories of expenditures. Overall the imputation performed well in replicating the distribution of expenditures.

Validation of out-of-pocket costs for health services.
Abbreviations: SHS-Survey of Household Spending; SPSD-Health-Social Policy Simulation Database-Health.
This approach has limitations. Compared to the size of the SPSD (over 100,000 households) there were only a small number of donor records available for hot-deck imputation in the 2009 SHS, approximately 11,000 records – though far less than that have out-of-pocket costs for health services. This discrepancy in sample sizes could lead to less variability than realistic in the imputed values. In addition, the SHS collects information on households, not individuals. Although we made explicit assumptions (outlined above) in dividing household expenditures among household members, this may not reflect reality. These assumptions can be modified in future iterations of the model.
2.2.7 Assignment of per-capita costs of physicians, other health professionals, hospitals and medications
We added a measure of per-capita costs for health care contacts and medications to the database in addition to the costs described above to enable sensitivity analyses. The physician, hospital and prescription medication costs described previously reflect costs derived at the individual level among users of services only. Per-capita costs reflect an average individual level cost that includes non-users of services. This measure is often used to estimate health care costs and evaluate the impact of financing options but does not account for the skewed nature of health care expenditures.
Per-capita costs of health care services, including physicians, other health professionals, hospitals and medications were obtained for 2009 from the National Health Expenditures report published by CIHI (Canadian Institute of Health Information, 2014). CIHI produces average health care costs per-capita by age group and sex. The per-capita costs were simply assigned to CCHS 2009/10 PUMF respondents by age group and sex.
This approach has limitations. The assignment of per-capita costs does not reflect the reality of skewed health care use, where many individuals have little or no costs, while a small minority have high costs (Deber et al., 2014). Another limitation of per-capita physician costs is the fact that it includes visits to all types of doctors combined, including family physicians and specialists (Canadian Institute of Health Information, 2014).
2.3 Statistically matching the SPSD and health data
The SPSD-Health was created by statistically matching the SPSD and CCHS at an individual level. The method used was based on the categorically constrained matching with weight-split which is described elsewhere (Kovacevic & Liu, 1994; Liu & Kovacevic, 1997; Liu & Kovecevic, 1998).
This method has the benefit of taking into account the weights of the records in both samples and preserves the conditional distribution of the health information.
Briefly, records in the CCHS 2009/10 PUMF (n = 124,188) and the SPSD (n = 318,712), are split into bins which are defined by variables which are common to both datasets. Once these bins are formed, CCHS records are duplicated to match the number of records in the SPSD (the weights of the CCHS records are taken into account when choosing which records to duplicate) and the information from the CCHS is statistically matched onto the SPSD.
The bins were defined using an iterative method using classification variables that are common to both datasets such as sex, age group, and income category. The databases are first split by sex. Then, for each sex, a regression is run to assess which of the remaining classification variables is most explanatory of the differences in consumption of health services (See Figure 7). The bin is split by that variable, and the process is repeated until there are no remaining common variables or until a split would result in a bin with fewer than 25 records.
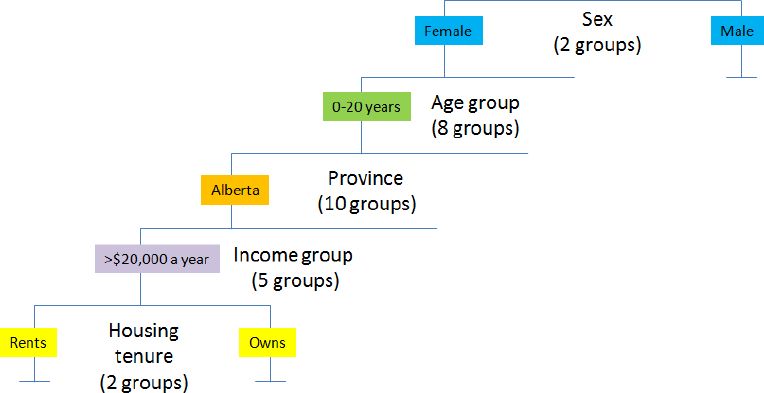
Schematic diagram of the variables used to statistically match the CCHS 2009/10 PUMF to the SPSD.
Notes: This diagram illustrates an example split by following a theoretical case through the split macro
Validation of the statistical match was completed by comparing the original to imputed health status variables and health care costs assembled from all the different data sources by important socio-demographic factors including sex, age group, income category, chronic disease status and disability status. Validation of the statistical match is shown in Tables 4.1 and 4.2
Validation of match merging of SPSD-Health to CCHS.
| Health care cost type | % with family doctor cost | % with specialist doctor cost | % with eye doctor cost | % with hospital cost | % with medication cost | |||||
|---|---|---|---|---|---|---|---|---|---|---|
| Data source | CCHS | SPSD-H | CCHS | SPSD-H | CCHS | SPSD-H | CCHS | SPSD-H | CCHS | SPSD-H |
| Weighted % (percent) | 76.8 | 75.7 | 29.8 | 28.8 | 39.7 | 40.6 | 6.5 | 6.0 | 57.1 | 54.2 |
| Average cost ($) | 134 | 131 | 180 | 179 | 92 | 90 | 10,129 | 10,242 | 925 | 899 |
| Median cost ($) | 89 | 89 | 108 | 108 | 75 | 75 | 4,451 | 4,537 | 669 | 578 |
| Minimum cost ($) | 27 | 27 | 51 | 51 | 42 | 42 | 578 | 578 | 48 | 48 |
| Maximum cost ($) | 1,584 | 1,584 | 1,008 | 1,008 | 1181 | 1,181 | 613,342 | 537,324 | 5,375 | 5,375 |
-
Abbreviations: SPSD-H Social Policy Simulation Database-Health; CCHS-Canadian Community Health Survey
Validation of match-merging of SPSD-Health to CCHS.
| Health care cost type | % with prescription drug insurance | % with physiotherapy cost | % with chiropractic cost | % with speech language pathologist/audiologist/occupational therapist cost | % with psychologist cost | |||||
|---|---|---|---|---|---|---|---|---|---|---|
| Data source | CCHS | SPSD-H | CCHS | SPSD-H | CCHS | SPSD-H | CCHS | SPSD-H | CCHS | SPSD-H |
| Weighted % (percent) | 73.3 | 72.6 | 9.6 | 9.2 | 11.5 | 11.3 | 2.5 | 2.5 | 3.5 | 3.7 |
| Average cost ($) | n/a | n/a | 347 | 340 | 287 | 281 | 142 | 150 | 659 | 681 |
| Median cost ($) | n/a | n/a | 216 | 215 | 189 | 189 | 79 | 79 | 433 | 519 |
| Minimum cost ($) | n/a | n/a | 31 | 31 | 27 | 27 | 33 | 33 | 86 | 86 |
| Maximum cost ($) | n/a | n/a | 1,992 | 1,992 | 1,627 | 1,627 | 1,075 | 1,075 | 2,433 | 2,433 |
-
Abbreviations: SPSD-H Social Policy Simulation Database-Health; CCHS-Canadian Community Health Survey
This approach has some limitations. First, the method used preserves the sample size of the SPSD (n = 318,712) which maintains fast simulation times. However, it is possible that not all of the CCHS records are used, which means that some of the health data may be lost. Secondly, the method used provides no guidance on the possible variability or error that is derived from the match.
3. Discussion
This project represents an innovative use of an existing social policy microsimulation model, with comprehensive income and taxation information, and available health care cost information. Using a range of available health data sources, including national health surveys and administrative data, imputation methods were used to add health status and health care costs to the SPSD. Results of the validation process indicate that the imputation and statistical matching processes conducted resulted in representative distributions of health care costs within the Canadian population as observed in the original health data sources, see Figures 3–6 and Table 4.1/4.2.
In the quest to contain health system costs policy makers require tools to evaluate the potential impacts of alternative health care financing scenarios (Marchildon & Di Matteo, 2014; Organization for Economic Cooperation and Development, 2010). The SPSD-Health, along with customized versions of the SPSM, is one such tool and is unique in Canada in its ability to integrate data related to health and health system costs with detailed income and tax information. By extending an existing social policy database and model (the SPSD/M) we have incorporated the ability to do comprehensive analyses of tax implications at both provincial and the federal levels of government, as well as among individuals, families and households. Other Canadian microsimulation models such as the Population Health Model (POHEM) and Cancer Risk Management Model, both developed at Statistics Canada, are primarily focussed on projecting cases of disease and the impact of health policies in relation to prevention or treatment (Wolfson, 1991; Evan et al., 2013). However, these models do not include detailed health care costs or enough tax data to address the implications of alternative financing options (Spielauer, 2007b; Decarie, 2011). Internationally, several social policy microsimulation models such as DYNASIM3 and CORSIM, both developed in the US, include selected measures of health status, such as disability, and the need for institutional care but have limited functionality in terms of health care costs and implications of different financing options (Spielauer, 2007b; Urban Institute, 2015). More recently Parente and colleagues have assessed uptake of private health insurance and Medicaid following the United Stated Supreme Court decision to uphold the Affordable Care Act. These researchers supplemented employer data with information about Medicaid eligibility and costs of health care services to project future increases in insurance coverage (Parente & Feldman, 2013).
The SPSD-Health has some limitations. The intention of this project was to assemble data to be used in a microsimulation model that tests alternative scenarios of health care financing. This data should not be treated as an actual microdata source but rather a synthetic database created through a series of imputations. Models using this data should not be used to estimate health services use or total health care costs. In Canada better sources of data exist to accurately estimate health services use and total costs, such as the CCHS series of surveys and CIHI’s health administrative data.
The limitations of each data source used to impute health care costs have been discussed in the preceding sections. Furthermore, three significant data issues remain to be discussed. First the institutionalized elderly population, although represented in the SPSD, is not represented in the CCHS 2009/10 PUMF, the linked hospital or drug use data from the CHMS. Essentially health status and health care costs of the community dwelling non-institutionalized population were assigned to the institutionalized population. This limitation may be overcome in the future when better sources of cost information are available nationally that represent the institutionalized population. Second, while children are represented in the SPSD they are not well represented in the health data. The CCHS 2009/10 PUMF represents children only 12 and over, while the CHMS represents only children 3 and over. Although age is an important criteria used in the statistical match, all individuals under age 20 are grouped together in the imputation. Health care costs are very variable in this age group, with children under 1 year old having considerable costs, mainly due to hospitalization for birth (Canadian Institute for Health Information, 2014). Third, individuals that died are not represented in the SPSD, neither is this very important and costly subpopulation specifically represented in the health survey data. Health care costs increase substantially with proximity to death (Tanuseputro et al., 2015), however the SPSD-Health data is not capturing this interesting phenomenon.
Finally, health care costs are highly skewed in the Canadian population, with a small proportion of Canadians using the majority of resources (Deber et al., 2014). The development of health care cost estimates using a “bottom-up” approach based on individual level data versus per-capita or average expenditures is expected to more accurately reflect the skewed distribution of health care costs. Despite best efforts to replicate these distributions at the population level, the resulting health costs data added to the SPSD may reflect reduced variability in health care costs. This may be a result of two factors. First, the lack of representation of sub-populations known to be high users of health care (i.e. the institutionalized population, young children and those who died (discussed above)) in the donor data would result in the exclusion of those high costs estimates. Second, the use of imputation may also reduce the variability in the imputed data compared to the source data, with, for example, extremely high values not fully represented. Hot-deck imputation was the method of choice in this application because it had been used previously, performed well and was easily implemented in SAS (Hennessy et al., 2011). Many other statistical matching techniques, including multiple imputation (Rässler, 2002; Rubin and Schenker, 1991), are available and would likely perform equivalently compared to the hot-deck. With regard to the hot-deck method, the quality of the imputation is also influenced by the number of donor data points available. In the case of the CHMS and the CCHS 2007 (rapid response component for prescription drug insurance) a small number of donors were available compared to the number of observations in the CCHS 2009/10 PUMF.
Custom versions of the SPSD/M, used in conjunction with the newly developed SPSD-Health, have the potential to be applied to a wide range of policy questions around alternative health care financing scenarios, including those that are currently being considered for the Canadian health care system. Such as the introduction of medical savings accounts (MSAs) to finance selected out-pocket costs and health care services (Eftekhary et al. 2014). In this case various methods of implementing MSAs can be examined, including MSAs administered by governments and employers. As well, the impact of using MSAs to cover out-of-pocket costs for prescription drugs and health services currently covered under Medicare (like physician services) can be interrogated. The MSAs administered by government and employers would be subject to different tax-treatments, resulting in downstream effects on the disposable income of individuals and families.
Beyond this specific application, the model could be used to address the following questions: What are the potential short term implications of a broad range of funding options, including new revenue sources (i.e. tax revenues, payroll taxes and user fees) and different insurance models (i.e. social health insurance)? How does the financial impact of these options affect various population groups (by income category, by health expenditure category, etc.)? What are the revenue implications for governments of making health care service use a taxable benefit?
References
-
1
Financing models for non-Canada health act services in Canada: Lessons from local and international experiences with social insurance, CHSRF Series of Reports on Financing Models, Paper 2Financing models for non-Canada health act services in Canada: Lessons from local and international experiences with social insurance, CHSRF Series of Reports on Financing Models, Paper 2, Ottawa, Ontario, http://www.chsrf.ca/PublicationsAndResources/ResearchReports/CommissionedResearch/11-05-31/19c19600-019a-410f-9945-292904e680fe.aspx, accessed, December.
-
2
Policy, Report Fees and Treatment Feeshttp://awcbc.org/wp-content/uploads/2013/12/Healthcare_Service_Provider_Fees.pdf, accessed, may.
-
3
The Social Policy Simulation Database and Model: An Integrated Tool For Tax\Transfer Policy AnalysisThe Canadian Tax Journal, 38.
-
4
Healthcare and an Aging Population: Managing Slow–Growing Revenues and Rising Health Spending in British ColumbiaToronto, Ontario: CD Howe Institute.
-
5
National Health Expenditure Trends, 1975–2014National Health Expenditure Trends, 1975–2014, Ottawa, Ontario, http://www.cihi.ca/cihi-ext-portal/internet/en/documentfull/spending+and+health+workforce/spending/nhex_product_2014, accessed, November.
-
6
National Physicians Database 2009–2010–Data releaseNational Physicians Database 2009–2010–Data release, Ottawa, Ontario, https://secure.cihi.ca/estore/productSeries.htm?pc=PCC476, accessed, March.
-
7
Data Quality Study of the 2008–2009 Discharge Abstract DatabaseData Quality Study of the 2008–2009 Discharge Abstract Database, Ottawa, Ontario, https://secure.cihi.ca/estore/productFamily.htm?pf=PFC1578&lang=fr&media=0, accessed, May.
-
8
Canadian MIS Database—Hospital Financial Performance Indicators by Health Region 1999–2000 to 2009-2010Canadian MIS Database—Hospital Financial Performance Indicators by Health Region 1999–2000 to 2009-2010, Ottawa, Ontario, http://secure.cihi.ca/cihiweb/products/CMDB_hospita_financial_performance_indicators_meth_notes_2011_en.pdf, accessed, May.
-
9
The Cost of Acute Care Hospital Stays by Medical Condition in Canada, 2004-2005The Cost of Acute Care Hospital Stays by Medical Condition in Canada, 2004-2005, Ottawa Ontario, http://secure.cihi.ca/cihiweb/products/nhex_acutecare07_e.pdf, accessed, May.
-
10
Reliability of self–reported health service use: Evidence from the women with co-occurring disorders, and violence studyJournal of Behavioural Health Services and Research 2008 35:265–78.
-
11
Four Flavours of Health Expenditures: A Discussion of the Potential Implications of the Distribution of Health Expenditures for Financing Health CareCanadian Public Policy 40:353–363.
-
12
Medical savings accounts in financing healthcare. CHSRF Reports on Financing Models, Paper 3Medical savings accounts in financing healthcare. CHSRF Reports on Financing Models, Paper 3, Ottawa, Ontario, http://www.chsrf.ca/PublicationsAndResources/ResearchReports/CommissionedResearch/11-01-31/417c8ae1-bdb0-414b-bae2-15ea91798047.aspx, accessed, December.
-
13
Experience with medical savings accounts in selected jurisdictions. CHSRF Series of Reports on Financing Models, Paper 4Experience with medical savings accounts in selected jurisdictions. CHSRF Series of Reports on Financing Models, Paper 4, Ottawa, Ontario, http://www.chsrf.ca/PublicationsAndResources/ResearchReports/CommissionedResearch/11-07-21/ae5a6480-4a76-4066-a7cc-d71f4f98c5ed.aspx, accessed, December.
-
14
Handling the high spenders: Implications of the distribution of health expenditures for financing health care. APSA 2009 Toronto Meeting PaperHandling the high spenders: Implications of the distribution of health expenditures for financing health care. APSA 2009 Toronto Meeting Paper, http://papers.ssrn.com/Sol3/papers.cfm?abstract_id=1450788, accessed, December.
-
15
An inventory of Canadian microsimulation model. Discussion paper, Computer Modelling SeminarAn inventory of Canadian microsimulation model. Discussion paper, Computer Modelling Seminar, Gatineau, Quebec, http://sociology.uwo.ca/cluster/en/documents/DecarieInventoryVanadiaMicrosimulatio.pdf, accessed, May.
-
16
Imputation Methods for Handling Item-Nonresponse in the Social Sciences: A Methodological Review. Working Paper, United Kingdom: National Centre for Research MethodsSouthampton Statistical Sciences Research Institute, University of Southampton.
-
17
Evaluation of Medical Savings Account as an Alternative Healthcare Financing Option, Using a Microsimulation Toolhttps://www.cahspr.ca/web/uploads/conference/2014-05-12_Book_of_Abstracts.pdf, accessed, May.
-
18
Canadian Cancer Risk Management Model: evaluation of cancer controlInt J Technol Assess Health Care 29:131–9.
- 19
-
20
Sampling Documentation for Cycle 2 of the Canadian Health Measures Survey. Methodology Branch Working Paper 002Ottawa: Statistics Canada.
-
21
An assessment of methods to impute risk exposure into model actor’s risk profile for microsimulationInternational Methodology Symposium, Statistics Canada, Ottawa, Ontario, Internal document; available on request.
-
22
Social Policy Simulation Database and ModelAnil Gupta, Ann Harding, editors. Elsevier.
-
23
Proceedings of the Section on Survey Research Methods479–484, Proceedings of the Section on Survey Research Methods, American Statistical Association.
-
24
Proceedings of the Survey Methods Section167–178, Proceedings of the Survey Methods Section, Statistical Society of Canada.
-
25
Categorical Matching and Constrained Rematching of Survey Data Files. Working paper, Catalogue number HSMD-98-008E, Statistics CanadaCategorical Matching and Constrained Rematching of Survey Data Files. Working paper, Catalogue number HSMD-98-008E, Statistics Canada.
-
26
Out-of-pocket spending on prescription drugsPerspectives, http://www.statcan.gc.ca/pub/75-001-x/10905/8621-eng.pdf, accessed, March.
-
27
Research synthesis on health financing models: the potential for social insurance in Canada. CHSRF Reports on Financing Models, Paper 1Research synthesis on health financing models: the potential for social insurance in Canada. CHSRF Reports on Financing Models, Paper 1, Ottawa, Ontario, http://www.chsrf.ca/PublicationsAndResources/ResearchReports/ArticleView/11-10-04/4792900d-bb09-419d-9aad-9d89d6cff0d0.aspx, accessed, December.
-
28
Bending the Cost Curve in Healthcare: Canada’s Provinces in International PerspectiveToronto; Ontario: University of Toronto Press.
-
29
BC RX Atlas, Second EditionVancouver: Centre for Health Services and Policy Research, University of British Columbia.
-
30
The Canadian Rx Atlas, Third EditionVancouver: Centre for Health Services and Policy Research, University of British Columbia.
-
31
The Canadian Rx Atlas (2)Vancouver: Centre for Health Services and Policy Research, University of British Columbia.
-
32
Public and Private Roles in Health: Theory and Financing Patterns. World Bank Discussion Paper No. 339Washington, DC: The World Bank.
-
33
Health care systems: Getting more value for money. OECD Economic Department Policy NotesHealth care systems: Getting more value for money. OECD Economic Department Policy Notes, 2, http://www.oecd.org/eco/growth/46508904.pdf, accessed, November.
-
34
OECD Health data 2014: How does Canada compare?OECD Health Statistics, http://www.oecd.org/els/health-systems/Briefing-Note-CANADA-2014.pdf, accessed, November.
-
35
Microsimulation of private health insurance and Medicaid take-up following the U.S Supreme Court decision upholding the Affordable Care ActHealth Services Res 48:826–849.
-
36
Health Insurance Access Databasehttps://www.mcgill.ca/iris/projects/hiad, accessed, March.
-
37
Agreement between self-reported and routinely collected health-care utilization data among seniorsHealth Services Research 37:751–74.
-
38
Statistical Matching: A Frequentist Theory, Practical Applications, and Alternative Bayesian Approaches. Lecture Notes in StatisticsNew York: Springer.
-
39
Who are the high hospital users? A Canadian case studyJ Health Serv Res Policy 8:5–10.
-
40
Evaluation of the coverage of linked Canadian Community Health Survey and hospital inpatient recordsHealth Rep 20:1–7.
- 41
-
42
Multiple imputation in health-care databases: an overview and some applicationsStat Med 10:585–98.
-
43
What is dynamic social science microsimulation?What is dynamic social science microsimulation?, Modelling Division, Statistics Canada, Ottawa, Ontario, http://www.statcan.gc.ca/sites/default/files/chap1-eng.pdf, accessed, December.
-
44
Dynamic microsimulation of health care demand, health care financing and the economic impact of health behaviours: survey and reviewInternational Journal of Microsimulation 1:35–53.
-
45
The top five outpatient prescription drugs ranked by total expense for children, adults and the elderlyMEPS Statistical Brief #180, http://meps.ahrq.gov/mepsweb/data_files/publications/st180/stat180.shtml, accessed, March.
-
46
Social Analysis and Modelling Division, Statistics CanadaSocial Analysis and Modelling Division, Statistics Canada, Ottawa, Ontario, http://www.statcan.gc.ca/eng/microsimulation/spsdm/spsdm, accessed, March.
-
47
Statistics CanadaStatistics Canada, Ottawa, Ontario, http://www.statcan.gc.ca/pub/75f0002m/75f0002m2011004-eng.htm, accessed, March.
-
48
Canadian Community Health Survey Microdata User GuideCanadian Community Health Survey Microdata User Guide, Statistics Canada, Ottawa, Ontario, http://www23.statcan.gc.ca/imdb-bmdi/document/3226_D7_T9_V8-eng.pdf, accessed, March.
-
49
Estimates of population, Canada, provinces and territoriesEstimates of population, Canada, provinces and territories, CANSIM TABLE 051–0005, Statistics Canada, Ottawa, Ontario, http://www5.statcan.gc.ca/cansim/a26?lang=eng&retrLang=eng&id=0510005&paSer=&pattern=&stByVal=1&p1=1&p2=-1&tabMode=dataTable&csid=, accessed, March.
-
50
Survey of Household SpendingDefinitions, data sources and methods, http://www23.statcan.gc.ca/imdb/p2SV.pl?Function=getSurvey&SurvId=43837&InstaId=64630&SDDS=3508, accessed, May.
-
51
The Health Care Cost of Dying: A Population-Based Retrospective Cohort Study of the Last Year of Life in Ontario, CanadaPLOS One 10:e0121759.
-
52
Charting a path to sustainable health care in Ontario: 10 proposals to restrain cost growth without compromising quality of care. Special ReportCharting a path to sustainable health care in Ontario: 10 proposals to restrain cost growth without compromising quality of care. Special Report, http://www.td.com/document/PDF/economics/special/td-economics-special-db0510-health-care.pdf, accessed, December.
-
53
Canadian Health Measures Survey: rationale, background and overviewHealth Rep 18:7–20.
-
54
The Dynamic Simulation of Income Model (DYNASIM3): A Brief Overviewhttp://www.urban.org/sites/default/files/dynasim_summary_march_23_2015_0.pdf, accessed, May.
-
55
WHO Collaborating System for Drug Statistics MethodologyStructure and Principles.
-
56
Guidelines on person-Level Costing Using Administrative Databases in Ontario. Working Paper Series, Volume 1Toronto: Health System Performance Research Network.
-
57
A system of health statistics: Towards a new conceptual framework for integrating health dataReview of Income and Wealth 37:81–104.
Article and author information
Author details
Acknowledgements
We would like to acknowledge the Canadian Institutes for Health Research for funding this research through grant number TO1-120300.
Publication history
- Version of Record published: December 31, 2015 (version 1)
Copyright
© 2015, Hennessy et al.
This article is distributed under the terms of the Creative Commons Attribution License, which permits unrestricted use and redistribution provided that the original author and source are credited.