A brief, global history of microsimulation models in health: Past applications, lessons learned and future directions
- Macquarie University, Australia
- The University of Sydney, Australia
- Article
- Figures and data
- Jump to
Abstract
This review discusses the evolution of microsimulation models in health over the past three decades. We focus on three aspects of health microsimulation. First, we describe the origins and applications of health microsimulation, including how early research challenged early methodologies and led to the development of more rigorous models. We describe limitations of early means-based models and how more detailed methods, which are based on health-specific input data, overcame many of the early data shortfalls and assumptions. Second, we discuss the global expansion of applications of microsimulation to health over the last ten years. Many health microsimulation models have focussed on health expenditure, the ageing population, diabetes, mortality modelling, and spatial models. Health models over the past few decades have expanded to many countries including Canada, Africa, the United States, the UK, Sweden, the Netherlands, New Zealand and Australia. Finally, we describe future developments, including emerging research fields for microsimulation and health and how the early development of health microsimulation models provides important lessons for emerging applications. These include the emerging field of genomics and precision medicine, and the diagnosis and treatment of childhood cancers and rare diseases. We suggest research directions, including the need for good data to avoid model errors, and highlight some pitfalls to avoid.
1. Introduction
Microsimulation models can be used to address a wide range of research questions, including simulating life histories to estimate the effects of interventions or policies at a population scale, or test the impact of health policy on a population (Brown, 2011; Rutter, Zaslavsky, & Feuer, 2011). Increased demand by policy makers for detailed projections of long-term health systems, combined with new research paradigms focussing on individuals in addition to improved computing power and data availability means microsimulation has been experiencing an expansion in use. Static microsimulation models are well established, and dynamic microsimulation models are increasingly being used to inform health policy (Spielauer, 2011). Previous reviews have focussed on how microsimulation may inform health policy to 2010 (Rutter et al., 2011), and more general applications of microsimulation to the field of social sciences (Spielauer, 2011). In contrast, this review focuses on the history of health microsimulation, from 1970 onwards, specific health model types and applications from 2007 to 2017, and future research directions, including genomic medicine, and lessons learned which we may apply in future microsimulation.
In this paper, we describe the overall trends in health microsimulation models starting from when microsimulation was applied in health research for the first time in the 1970s to the recent time, discussing the early challenges that were overcome to develop robust models and the modern applications in health modelling. We then discuss the future challenges and key research directions, and what can be learned from the early development of health applications of microsimulation to advance current developments of the field and overcome significant pitfalls.
In order to find the scientific literature on the application of microsimulation in health research, we used “microsimulation” as a keyword search in PubMed1, a search engine with access to more than 28 million citations for biomedical literature from MEDLINE, life science journals, and online books. PubMed is a search engine for medical literature and therefore using ‘health’ or ‘medical’ as a search term was deemed unnecessary. The search returned 788 articles and the first article as indexed by PubMed was published in 1972. We draw key examples from this literature to describe the developments of microsimulation applied to health from the 1970s and 1980s to the present.
2. Origins and applications of health microsimulation
2.1 First application of microsimulation of health
It took almost 15 years, since the development of the first microsimulation model in 1957 (Orcutt, 1957), to apply microsimulation modelling in health research. Early health microsimulation models from the 1970s imputed Egyptian data (Khalifa, 1972), while using a US dynamic microsimulation model POPREP to study the effects of five different methods of family planning on the rate of conception (Mustafa, 1973).
There were only a few health microsimulation models reported in the 1970s, although there was a rapid increase in the number of studies using microsimulation models in health between 1980 and 1990, with applications becoming remarkably diverse (Table 1). There were about 15 health microsimulation models reported between 1975 and 1990 (Figure 1). These early models were generally static models rather than dynamic models, unlike the Egyptian population models from the 1970s.2 Models from 1975 to 1990 mostly focussed on topics such as fertility (Roy, 1984; Santow, 1978), breastfeeding and fertility (Kono, Hirosima, Watanabe, Takahashi, & Kaneko, 1983) health insurance provided by employers (Chernick, Holmer, & Weinberg, 1987; Rossiter & Wilensky, 1978), cancer screening (Parkin, 1985) and the screening of other diseases (Habbema, van Oortmarssen, Lubbe, & van der Maas, 1985). Other types of models developed included studies on the transmission and treatment of vector-borne diseases, based on the life history of humans and the vector, such as a flying insect for river blindness disease (onchocerciasis) (Plaisier, van Oortmarssen, Habbema, Remme, & Alley, 1990). Another model from the 1970s tested the impact of different health policies by simulating the behaviour of individuals and institutions (Yett, Drabek, Intriligator, & Kimbell, 1975). Many of these early models used national census data, which were generally the most readily available data in the 1970s to 80s, combined with some survey data such as breast-feeding and fertility surveys (Table 1). In addition, some disease-specific models were based on more health-specific published clinical data on disease progression, such as those on cervical carcinoma (Parkin, 1985).
A selection of microsimulation models of health: 1970–1989.
| Model, country (source, year) | Aims/objectives | Data sources | Sample sizes |
|---|---|---|---|
| POPSIM, Egypt (Khalifa, 1972) | Study the effects of various forces, for instance family planning, on the Egyptian population. The model generates vital health events and life histories for each individual in the computerized population. | Longitudinal or historical data. | Entire population. |
| HRRC, USA, (Yett et al., 1975) | Examine impacts of health policies on behaviour of individuals and institutions comprising the health care system. | Local, State and Federal Hospital data, Census data, Annual Survey of Hospitals. | Up to 2,170,000. |
| USA, (Rossiter & Wilensky, 1978) | Suggest empirical health models for estimating elasticity of demand and supply for physician and medical services. | National Medical Care Centre Expenditure Survey (NMCES) data and National Centre for Health Statistics. | Not stated. |
| West Nigeria, (Santow, 1978) | Assess fertility of the Yoruba of Western Nigeria and changes in the durations of lactation and marital sexual abstinence. | Demographic surveys, fertility survey of Ibadan (CAFN1). | Not available. |
| UN Population Division Model, Japan (Kono et al., 1983) | Simulate Japanese fertility, using conception, mortality and nuptiality, affecting the level and trend of fertility. | Field survey on fertility. Japanese population data from 1945 to 1982. | 3,000 married couples. |
| Converse, India (Roy, 1984) | Examine sterilization in India and makes demographic analysis of the performance. | Not stated. | Not stated. |
| England and Wales, (Parkin, 1985) | Reproduce demographic events in a female population over a 30 year period, and superimposes the natural history of cervical carcinoma, using data derived from published studies. | 1961 Census data, England and Wales from 1961 to 1990. Conditional probabilities of childbirth at a given age, from literature. | Arbitrary size, with the demographic makeup of England and Wales. |
| USA, (Chernick et al., 1987) | Determine the links between tax subsidies and health insurance, using elasticity’s of demand for health insurance and medical services in a static microsimulation model. | March 1980, Current Population Survey data, including health insurance information. Battelle Employment-Belated Health Benefits Survey, 1977–78. | USA Population of 1979. |
| USA, STATS, (Wixon, Bridges, & Pattison, 1987) | Inform health policy through a national survey of households to calculate taxes or benefits for thousands of persons or families, case by case. | National Current Population Survey data. | More than 100,000 people. |
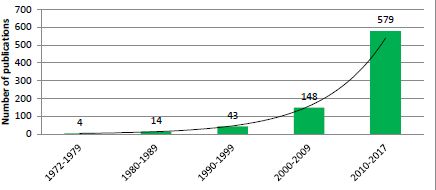
Exponential growth in the number of publications relating to application of microsimulation in health research by decade.
Source: PubMed, keyword ‘Microsimulation’.
Testing the robustness and assumptions of underlying models has always been a key step in the development of microsimulation models, which were commonly undertaken by comparing predictions against observed results (Habbema et al., 1985; Parkin, 1985). The success in developing early models in this period led to more sophisticated health models. With the realisation of their usefulness in health policy settings and with more available data, the number of microsimulation models in health started to increase (Figure 1).
2.2 Towards greater rigor: challenges overcome in the 1990s
The 1990s was a period of rapid expansion and a move to robust purpose-built health models with many focussing on health benefits and expenditure. However, the primary method was a “means-based approach”, also known as a cell-based method, within an existing static microsimulation model developed for other purposes (National Research Council, 1991). This was a serious and pervasive limitation of many of the models commonly used in this period. This is not to say that there were no other types of models developed during this period, for example, Wolfson reported on the development of POHEM, a longitudinal model of health and disease (Wolfson, 1994). However, the wider field had yet to develop and accept a rigorous approach such as that typically used for tax-benefit models of that era. In this section we focus on the challenges of this period as it serves as an important illustration of how new developments can entrench simplistic and erroneous methods and the importance of continued development of the field, with lessons that are critical to the continued development of health microsimulation in the 21st century (see Section 4). Typically means-based models relied on average health service usage data for particular population sub-groups and data on the average subsidy per service, to derive a value for benefits-in-kind for each individual unit in the model. Some of the means-based models are illustrated in (Australian Bureau of Statistics, 1987, 1992; Central Statistics Office, 1992; Economic Planning and Advisory Committee, 1987; Evandrou, Falkingham, Grand, & Winter, 1992; Ann Harding, 1984; Johnson, Manning, & Hellwig, 1995; Statistics New Zealand, 1990). The failure of the means- based approach to take into account many important predictive variables led some authors to suggest that they were likely to produce questionable distributional results (Cameron & Wolfson, 1994; Evandrou, Falkingham, Hills, & Le Grand, 1992). In fact, it became common to preface an analysis of the distribution of health benefits from these models with a disclaimer, such as that given by Statistics New Zealand (1990) who stated that their means-based simulation was a “very approximate” method, and that “different assumptions could produce quite different results”. It was suggested that the distribution of health benefits was in fact more progressive, that is, skewed towards the poor, than the means-based models had suggested (Johnson et al., 1995; Schofield, 1998a, 1998b).
Another major limitation of means-based models was the failure to identify that health service usages vary markedly between persons within the (usually large) mean groupings, leading to errors. Cameron and Wolfson (1994) questioned the method of assigning an equal benefit to all individuals within the same group (usually defined by age group and sex), whether or not the benefits are actually used. Johnson et al. (1995) demonstrated in their simulation of health benefits under the means-based approach that the value of the expenditure will be spread across everyone who is eligible for free medical treatment when only a small proportion of people will actually use the services, but those few will derive a much greater value from it. Consequently, health expenditures were under-estimated for people who were high users of the public health system, but overestimated for low users.
A number of authors challenged the means-based models and developed purpose-built health microsimulation models with more detailed methods during the 1990s. Cameron and Wolfson (1994) from Statistics Canada developed an alternative model to their means-based model which used regression equations to impute the use of hospital and physician services. Cameron and Wolfson (1994) reported that the ‘detailed method’ produced a distribution of health benefits that was more progressive than their means-based model.
Schofield (1998a, 1998b) developed two detailed microsimulation models using individual unit record data from the Australian National Health Survey as a base population and imputed health expenditure at the individual level based on the cost and subsidy of each service used in these models. When results from both models were compared, the detailed approach was found to be markedly more pro-poor than the comparator means-based models in modelling the previously published results from earlier means based models in terms of the distribution of expenditure on the Pharmaceutical Benefits Scheme (PBS) and of hospital expenditure. This work laid the foundations for future lifetime analysis of health expenditure (Harding, Percival, Schofield, & Walker, 2002).
Similarly, the United Kingdom’s Central Statistical Office had developed an alternative more detailed health model using the General Household Survey which included information on the use of health services. The outputs of this model were then compared to their means-based model which imputed health service use. The authors reported that the detailed health model produced results which were less progressive (that is, less skewed towards the poor) than the means-based model (Evandrou, Falkingham, Grand, et al., 1992; Evandrou, Falkingham, Hills, et al., 1992). This was in direct contrast to the findings of the Australian and Canadian studies which found that their simulated distribution of health benefits was more progressive (Evandrou, Falkingham, Grand, et al., 1992), suggesting that more rigorous approaches might have a different impact on the results for different countries.
3. Modern applications of microsimulation in health modelling – 2007 to present
Microsimulation is a field with a strong international community, with colleagues sharing their knowledge and skills since its inception. This is reflected in the spread of the applications of microsimulation in health, from countries with the most intense microsimulation development (Canada, Australia, New Zealand, the UK, the US and Western European countries) to every populated continent including Africa, Asia and South America (Figure 2).
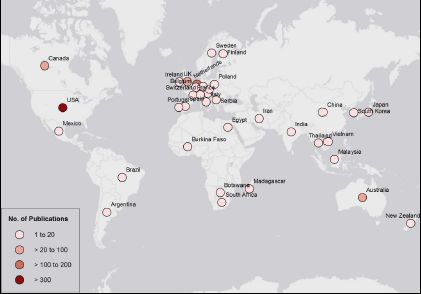
Global distribution of publications on microsimulation between 1972 and 2017, from a medical database, PubMed.
Source: PubMed, keyword ‘Microsimulation’.
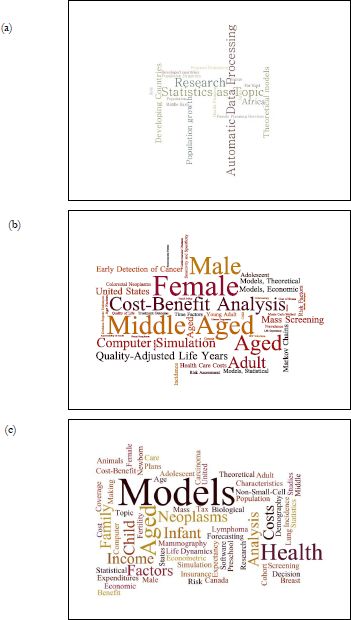
There has been a rapid proliferation of different types of applications of microsimulation modelling to health (Appendix A.1), with an ever-increasing diversity of use. This is demonstrated by changes in Medical Subject Heading (MeSH) codes frequently used in microsimulation and health papers, sourced from our literature search in PubMed (Figure 3). Some of the key areas of health microsimulation development are summarised below.

A figurative representation of the MeSH (Medical Subject Headings) words used for ‘microsimulation’ papers from (a) 1990 to 1999, (b) 2000 to 2009, and (c) 2010 to 2018. The size of each phrase represents the relative weight of the number of times each phrase is used.
Source: PubMed, keyword ‘Microsimulation’.
Health microsimulation models often now use National Health Surveys, Census data, disease registry data and sometimes other published data and primary data collections from clinical studies (see Appendix A.1). We note the importance of the move to individual record health data in Section 2.2 on means-based models.
3.1 Health expenditure and health policy
This has traditionally been the area where health microsimulation models are most widely used. In the last ten years, health expenditure has continued to grow in microsimulation research, particularly in relation to evaluating the impact of changes in health policy before implementing the changes. Microsimulation is increasingly being used to simulate health policy, as technology advances and also increasingly complex policy issues require new approaches (Brown, 2011; Lay-Yee & Cotterell, 2015). The increased use of microsimulation in health reflects the size and fast growth of national health expenditures, where the intricacy of the diseases and impacts of the health policies are inter-related (Majstorovic, 2015; Schofield & Rothman, 2007). Ageing populations and increasingly sophisticated drugs and technology have led to the development of microsimulation models that are recognised as effective policy tools for managing national health expenditures (Subramanian, Bobashev, Morris, & Hoover, 2017).
3.2 Ageing population and carers
With the global population ageing, both the number of people with chronic disease and the need for carers are increasing (Schneider & Kleindienst, 2016). Models, such as SHARE in Europe (Schneider & Kleindienst, 2016), have used microsimulation to estimate the costs of caring for the ageing population, in upcoming decades. This has led to the use of health-specific-survey data to develop models to identify and prioritise chronic diseases that require greater carer support, for cross-portfolio models. Examples of current models of the ageing population and their carers include SESIM in Europe (Flood, 2008), building on early development in this field including, the Brookings/ICFLong Term Care Financing Model, CORSIM, and DYNASIM in US (Caldwell, 1997; Kennell, Alecxih, Wiener, & Hanley, 1992; Orcutt, Wertheimer, & Caldwell, 1976). Microsimulation models have also been used to predict the need for aged care services (Sharyn Lymer, Brown, Harding, & Yap, 2009) to quantify the impact of specific diseases such as diabetes (Schofield et al., 2017) and dementia (Singh, Hussain, Khan, Irwin, & Foskey, 2014), which are more prevalent in the older population, and on future costs to individuals and government.
3.3 Cancers
Cancer microsimulation models have been developed over the last decade, with microsimulation gaining popularity in cancer research, and with policy-makers. This is particularly due to their ability to simulate chronic disease and the impact of screening and/or interventions under different scenarios. Many successful microsimulation studies have been used to estimate the cost-effectiveness of cancer diagnosis and treatment.
Numerous cancer models have been developed to simulate the impacts of cancer screening and treatments in Canada, the USA and Netherlands. The Cancer Risk Management Model (CRMM), developed in 2008, enables users to simulate the effects of interventions on cancer in Canada (Evans et al., 2013; Popadiuk et al., 2016). CRMM has been used in multiple cancer simulations in recent years. Cancers simulations which were built on CRMM include cervical cancer (Popadiuk et al., 2016), lung cancer (Goffin et al., 2015; Louie, Rodrigues, Palma, & Senan, 2014), and colorectal cancer (Coldman et al., 2015). Additionally, the cervical cancer and Human Papillomavirus (HPV) transmission models (Miller et al., 2015) of CRMM were used to study the health outcomes for screening of cervical cancer.
MISCAN was developed in the Netherlands and USA for screening cancer. It was initially used for cervical and breast cancer screening (de Koning, Boer, Warmerdam, Beemsterboer, & van der Maas, 1995; van Oortmarssen & Habbema, 1991), but has since been applied to colorectal, lung, and prostate cancer (Draisma et al., 2003; Schultz, Boer, & de Koning, 2012; Vogelaar et al., 2006). The model simulated the natural history of the disease from collected population clinical datasets, and hypothetical life histories formed the base population of the model (Institute of Medicine & National Research Council, 2005). Recently, microsimulation of screening for lung cancer was modelled in Canada to determine the most cost-efficient screening strategies (ten Haaf et al., 2017).
With the discovery of high penetrance genes related to breast cancer, there has been a need for evidence around the long-term cost-effectiveness of screening protocols that can be provided by microsimulation. Models generally have two key components: disease progression modules including treatment and screening modules. Most models have been developed in the USA and UK, including (Lee et al., 2008) who considered three screening options around MRI and mammography for BRCA positive women. Other breast cancer models include Obdeijn, Heijnsdijk, Hunink, Tilanus-Linthorst, and de Koning (2016) who used MISCAN to consider the cost-effectiveness of mammography in BRCA positive women and Eccleston et al. (2017) who considered the cost-effectiveness of BRCA testing of women with ovarian cancer and then cascade testing of their female family members. Additionally, modelling of population screening for specific ethnic sub-populations which have founder mutations have been conducted in populations of Ashkenazi Jewish Women (Grann et al., 1999).
3.4 Diabetes
Microsimulation of complex diseases such as diabetes, considers the prevalence, interactions of comorbidities and risk factors, disease progression, the effectiveness of interventions and the cost-effectiveness of interventions. Microsimulation has been used in the modelling of diabetes, cardiovascular disease and obesity, either as the primary focus or as part of a chronic disease system (Morrissey, Espuny, Williamson, & Higgins, 2016), with selected diabetes models shown in Appendix Table A.1.
There has been a strong collaboration through the Mount Hood Diabetes Challenge Network, which has seen the development of numerous diabetes (both type 1 and 2) focused simulation models. The original diabetes simulation model was developed to predict the vascular complications of NIDDM in a cohort representative of the incident cases of diabetes in the US and allowed the assessment of preventative interventions (Eastman et al., 1997). In 2017, this group reported 12 models predominately developed for the US and UK including: Cardiff (McEwan, Peters, Bergenheim, & Currie, 2006), the UKPDS Outcomes Model (Clarke et al., 2004; Hayes, Leal, Gray, Holman, & Clarke, 2013); ECHO-T2DM (Willis, Asseburg, & He, 2013); IMS-CORE Diabetes Model (Palmera et al., 2004); MICADO (van der Heijden et al., 2015) and the Michigan Model for Diabetes (Ye, Brandle, Brown, & Herman, 2015; Zhou et al., 2005). These types of models have been used for assessments of the long-term cost-effectiveness across a variety of intervention types, for example (Gao, Zhao, & Li, 2012; van Haalen et al., 2014).
In Australia, there have been several diabetes models developed (Walker, Colagiuri, & Mclennan, 2003), which simulate diabetes progression and the costs of different prevention, screening or treatment scenarios (Bertram, Lim, Barendregt, & Vos, 2010; Walker & Colagiuri, 2011). A complex chronic-disease model system, HealthAgeingMod, has been developed which includes both diabetes and cardiovascular disease (CVD) (Walker & Colagiuri, 2011). The HealthAgeingMod complex chronic disease framework was then used to develop NCDMod with greater emphasis on modelling of associated risk factors, in particular, obesity (Lymer, Schofield, Lee, & Colagiuri, 2016). In Australia, there have also been models developed capturing the financial consequences and impacts of diabetes (Schofield et al., 2010).
In Canada, there has been similar consideration of chronic disease with the Population Health Model (POHEM), used to project CVD to 2021 with diabetes modelled as a risk factor (Manuel et al., 2014). More recently, body mass index (BMI) predictive modules for both adults and children were included in POHEM to predict rates of overweight and obesity in the Canadian population (Hennessy et al., 2015; Hennessy, Garner, Flanagan, Wall, & Nadeau, 2017). With the growing prevalence of obesity, there has been a focus on models to project future obesity rates, and associated economic implications (Lymer & Brown, 2012; Su et al., 2015). These models are able to consider long-term implications of changes in public policy as well as the health implications of obesity.
3.5 Mortality
Microsimulation has been used to estimate the long-term productivity losses resulting from premature mortality, with selected mortality models presented in Appendix Table A.1 (Bradley et al., 2011; Carter, Schofield, & Shrestha, 2017; van Luijt, Heijnsdijk, & de Koning, 2017). A series of mortality studies from Australia were used to estimate lifetime income from Present Value of Life Income (PVLI) in 2003, and outcomes were then modelled to 2030 (Carter, Schofield, & Shrestha, 2016; Carter et al., 2017). There was a large national impact of premature deaths, with cancer and cardiovascular disease accounting for more than half the total PVLI impact. The impact was modelled across specific age, sex and cause of death categories. The studies suggested that interventions and policies which address and prevent premature mortality are likely to improve both health outcomes for individuals and economic outcomes for national governments (Carter et al., 2016, 2017).
3.6 Spatial models
Spatial microsimulation allows for the provision of population-specific planning and management, identification of health inequalities, and modelling the spatial aspects of disease and disease prevention (Rahman, 2017). These applications of microsimulation capture population dynamics and examine health policies (Schofield, Carter, & Edwards, 2014). Spatial microsimulation models have been used to determine specific attributes of small area statistics (Williamson, Birkin, & Rees, 1998; Williamson, 2016), how a location influences the likelihood of a disease, or where health care provisions are best located (Rahman, 2017). Examples of spatial microsimulation are described in Appendix Table A.1. The obesity model SimObesity aims to understand the relationship between lifestyle and environmental risk factors in children and adults (Edwards & Clarke, 2009; Edwards, Clarke, Thomas, & Forman, 2011). Another spatial simulation model, SimAlba, is used in Scotland to simulate distributions of variables at small areas, such as smoking, mental health, alcohol consumption and obesity (Campbell & Ballas, 2016). SimAlba uses Scottish Health Survey and Census data, and simulates the effects of different policy outcomes (Campbell & Ballas, 2016). Small-area models have also been used to model cardiovascular disease, diabetes and obesity prevalence (Morrissey et al., 2016).
3.7 Transmission of disease
Dynamic microsimulation models of health may be used to predict the trajectory of a disease (Schofield et al., 2014). Both chronic disease and infectious diseases have been modelled using dynamic microsimulation, to examine the impact of mitigation or prevention strategies on the spatial and temporal spread of disease (Li, O’Donoghue, & Dekkers, 2014). The impact of disease transmission for a range of conditions has been modelled: to determine the impact of vaccinations on human papillomavirus (Goldhaber-Fiebert et al., 2007), individual behavioural choices in HIV transmission (Cassels, Clark, & Morris, 2008) or closure of schools on influenza transmission (Sander et al., 2009), as well as the transmission of disease through (Degnan, Kaisar, & Schokkin, 2009).
3.8 Microsimulation and cost effectiveness of health interventions
There have also been moves towards the use of microsimulation methods to evaluate the cost-effectiveness of new interventions generally drawing evidence of effectiveness from randomised controlled trials or other study designs. This has tended to take the form of Markov models to undertake cost-effectiveness studies using microsimulation methods. Markov models are similar to cell-based models, both of which are based on aggregate data. These are often hybrid models, which do not always have the same amount of use of unit record data as typical microsimulation models, but rather, rely largely on aggregate data or synthetic populations, for instance Barnighausen & Bloom (2009).
Where there are models developed in conjunction with an intervention study, such as a clinical trial which collects individual patient data, then there is scope for the model to contain most of the necessary data at the unit record level. These models have a distinct advantage over aggregate Markov models in that they can simulate a virtually unlimited number of health states, with the number of health states only limited by the number of states captured and the number of records in the primary individual-level data source. This potentially increases the reliability of the model as well as capturing distributional impacts, for instance Hiligsmann et al. (2009). The benefits of using microsimulation for cost-effectiveness studies has been highlighted for its ability to handle large datasets and the potentially complex and a very large number of permutations of conditions, side effects and treatments within a study as well as for extrapolating outcomes beyond the period of follow up of patients during the trial (Vanness, Tosteson, Gabriel, & Melton, 2005; Weinstein, 2006). There are currently a small number of cost-effectiveness studies using microsimulation of this purpose with one example being to evaluate the cost-effectiveness of memantine to treat Alzheimer’s disease patients receiving donepezil (Weycker et al., 2007).
The application of microsimulation modelling to cost-effectiveness studies associated with clinical trials is a natural development of microsimulation models designed to simulate the progression of a disease and the related costs. Examples include the microsimulation models used by the US National Cancer Institute (http://cisnet.cancer.gov/) or the models used by NATSEM for type 2 diabetes and its control in Australian populations (http://www.natsem.canberra.edu.au/) or NCDMod which simulates obesity and progression to diabetes and cardiovascular disease (Lymer et al., 2016). These models, when adapted to simulate the outcomes of clinical trials, have the capacity to appraise the impact (clinical, social and economic), of recommended prevention strategies or treatments before expensive, time-consuming real-world implementation. For example one study compared the cost-effectivenss of 12- and 52-week interventions in patients in a randomised control for weight-loss techniques and modelled these over a 25-year time period using microsimulation (Ahern et al., 2017). This development is consistent with the work of Sassi and Hurst (2008) who emphasise the need to assess the impact of any proposed interventions for prevention of these diseases empirically before implementation, with this process facilitated by the use of erudite tools due to the complex dynamics involved in disease aetiology.
3.9 Cross portfolio models
As health and health policy has become a more common application of microsimulation models, the sophistication and breadth of the purpose of these models has begun to increase. Indeed, purpose built health models are beginning to be used as a platform to link other data and models of taxes and benefits such as STINMOD (Percival, Abello, & Vu, 2007), or even for comparing federal policy implications of different presidential candidates, Donald Trump or Bernie Sanders, on mortality (Kim, 2017). Another example is Health&WealthMOD, an Australian microsimulation model, which links with one or two other microsimulation models (depending on the application) to capture the economic impacts of health and changes in health status across multiple government portfolios and the national economy, capturing impacts of health on income, savings, taxes, welfare and GDP (Schofield et al., 2009), with specific application to productivity and health conditions such as arthritis (Schofield et al., 2013). Other examples of cross-portfolio applications include the model of the health workforce effects of proposed school closures to manage pandemics (Lempel, Epstein, & Hammond, 2009), or measuring impacts of alcohol policies on injury prevention and productivity in Canada, the Czech Republic and Germany (Cecchini, Devaux, & Sassi, 2015).
4. Where do we see health microsimulation going? – “Back to the future”
We started this review with the first studies using microsimulation to quantify effects of family planning in 1972–1973. Interestingly, family planning and some of the technical issues, such as the need for relevant health data related to that first model are important and very relevant again in 2018 for the newest applications of microsimulation. Recent applications, including genomic testing and precision medicine, particularly need detailed high quality data to reflect the genetic diversity of the population, with important applications to family planning. Genomics is an emerging field of clinical medicine rapidly redefining our understanding of the cause of human disease (Council of Australian Governments, 2017; Lindor, Thibodeau, & Burke, 2017). Many disorders currently treated as a single condition, are in fact made up of very different disorders with different molecular causes, and thus require different treatments.
Genomic medicine has been recognised as an important new health technology across the world (Felsenstein & Theodorescu, 2018; Vignot et al., 2018; Williamson et al., 2018). The remarkable steps forward from current practice which can be made with precision medicine were recognized by the House of Lords Science and Technology Committee in their report to British Parliament on Genomic Medicine (House of Lords Science and Technology Committee, 2009, p. 5):
“Every so often a scientific advance offers new opportunities for making real advances in medical care. From the evidence given to this inquiry, we believe that the sequencing of the human genome, and the knowledge and technological advances that accompanied this landmark achievement, represent such an advance”.
Further, the United Kingdom’s 100,000 Genomes Program, together with Genome England, aims to sequence genomes from 100,000 patients from the National Health Service, and that whole-genome sequencing will become routine clinical practice (Samuel & Farsides, 2018). Similarly, in March 2018, the Health Minister of Australia announced an investment of tens of millions of dollars, for preconception carrier screening for couples to assess the risk of having a child with a severe genetic disorder (Scott & Armitage, 2018).
Genomics requires a form of modelling that can capture these individual genetic differences and responses to therapy – a purpose to which microsimulation is eminently suited. Conversely, the risk of using aggregate models of grouped diseases with crude averaged impacts as inputs can produce highly erroneous results, further confounded if based on assumptions rather than the quality of data microsimulation models typically reply upon (Doble, Schofield, Roscioli, & Mattick, 2016, 2017). A diagnosis of many of these conditions also provides families with information important in family planning (Ghiossi, Goldberg, Haque, Lazarin, & Wong, 2018). Microsimulation may be used to model cost-effectiveness of techniques such as prenatal and pre-implantation genetic diagnosis.3
4.1 Why we need good genomic medicine data
It is important to note that, in order to produce robust, credible and accurate model results, we will need good quality genomic data (which often currently requires primary data collection given the current paucity of relevant data, inevitable for conditions which could not until very recently be diagnosed). This was a lesson previously learned in the 1990s during the move from means-based models that relied on aggregate health data imputed onto other models. These means-based models led to faulty conclusions. This prompted the development of purpose built health models, using specific health microdata. We have once again seen the types of errors that the earlier approaches produced in the emerging field of genomic medicine.
For example, a study on precision medicine, and how it may impact global health, proposed that the identification of genomic variants in major complex diseases would lead to change of health-related behaviours, resulting in 10–50% reduction in disease incidence (Dzau, Ginsburg, van Nuys, Agus, & Goldman, 2015). However, the aggregated assumptions in the study by Dzau et al. (2015), namely, that knowledge of a genetic condition would lead to marked behavioural change followed by an assumed large average reduction in the incidence of disease, have been shown to be unsupported by evidence (Doble et al., 2016). A Cochrane review (Marteau et al., 2010) showed that after receiving information about genetic risk, there was no evidence of incremental behavioural changes in patients. Thus, the assumptions in the Dzau et al. (2015) paper led to unfounded conclusions. For any modelling study to be robust, the input data, model assumptions and model structure need to be relevant (McLay, Lay-Yee, Milne, & Davis, 2015), evidence-based, robust, timely and capture the distributional impacts. This example highlights the need for quality data to be used in relation to genomic testing and precision medicine and microsimulation. Notably, van Gestel et al. (2012) comment that a lack of high-quality data on costs and health outcomes is the major reason why there is no clear evidence of the value of personalized medicine in terms of cost-effectiveness, a conclusion similar to that of previous authors (von Randow, Davis, Lay-Yee, & Pearson, 2012). Once again, the need for high quality individual based micro-data is a critical issue for current developments in health applications of microsimulation.
4.2 Genomics and precision medicine: the new frontier for microsimulation
There are also rapidly developing uses of microsimulation in relation to cancer and genomic medicine to model colorectal cancer (Barzi, Sadeghi, Kattan, & Meropol, 2015), lung cancer (Han, Erdogan, Toumazis, Leung, & Plevritis, 2017; Sheehan, Criss, Gazelle, Pandharipande, & Kong, 2017), melanoma (van der Meijde et al., 2016) and childhood cancer (see next paragraph). Rapid improvements in immunotherapy treatment of melanoma provide promising, targeted treatment which may be used when a specific mutation is observed in patients (Holay, Kim, Lee, & Gujar, 2017) with improvements in precision medicine leading to the development of clinical trials (Tannock & Hickman, 2016). One recent study from the Netherlands used microsimulation to simulate the cost-effectiveness of new treatments of melanoma (van der Meijde et al., 2016). The authors used microsimulation to quantify the cost-effectiveness of individualized cancer care, based on the progress of melanoma, using a description of underlying tumour growth, as well as interactions with diagnostics, treatments and surveillance (van der Meijde et al., 2016).
An emerging area of precision medicine is the improved diagnosis and treatment of childhood cancers (Worst et al., 2016). The low numbers of childhood cancer patients mean that cost-effectiveness studies of precision medicine in childhood cancer, compared with adult cancer, are rare. However, improvements in sequencing techniques mean that precision medicine in childhood cancer is rapidly advancing (Worst et al., 2016). Although the costs of childhood cancer have been quantified (Heath, Lintuuran, Rigguto, Tikotlian, & McCarthy, 2006; Wakefield, McLoone, Evans, Ellis, & Cohn, 2014), the costs and benefits of precision medicine have not yet been modelled. Very few studies (none to our knowledge) have analysed the cost-effectiveness of standardised treatment of childhood cancer, let alone compared precision medicine with standardised treatment, with the costs of precision medicine, using microsimulation, in fact there are few cost-effectiveness studies of the next generation sequencing in cancer (Tan, Shrestha, Cunich, & Schofield, 2018).
Microsimulation models of the application of genomic testing and precision medicine to childhood cancer will be highly valuable to determine which treatments are efficient uses of national health resources. One such model currently under development is Paediatric Cancer Model (PECANMOD).4 The model utilises data from cancer registry and hospital admission data in New South Wales, Australia to simulate events of childhood cancer from the onset (or earliest detectable stage), simulating expected life years, and hospital costs. The model will then be used to simulate the impact of precision medicine on total costs and expected life years.
4.3 Genomic testing, serious childhood illness and disability
Very recently a number of models based on primary data collected from genetics clinics have been developed to assess the cost-effectiveness of whole-exome and whole-genome testing, and subsequent changes in clinical management in terms of cost and health outcomes of the child, and reproductive planning and recurrence of the disorder in related families. The main challenges for these studies were the lack of data about the conditions and their natural history (since many of the conditions and their genetic cause had only recently been discovered), the heterogeneity of the sample (with many different genetic variants leading to the condition), the lack of administrative cost data, and the large scope of costs related to the disorders both within the health system and other sectors of government (for instance employment, welfare, education, residential care, community services, disability services). The data limitations require not only the use of health data as the base population for the models, but also extensive primary data collection, such as for the development of IDGenMod to simulate the impacts of whole-genome sequencing for familial intellectual disability in the EPIC-ID Study.5 Early publications from microsimulation models related to genomic testing and childhood syndromes models are already proving important in applications for public funding for genomic testing (Ewans et al., 2018; Palmer et al., 2018; Schofield, Alam, et al., 2017; Stark et al., 2017; Tan et al., 2017).
4.4 Methodological development and challenges
The collection of health data is growing in sample size and complexity, especially in the era of genomic medicine. Fortunately, with the significant improvement in computing power, we are able to employ sophisticated microsimulation modelling to health data. In addition, future microsimulation models also may involve advanced methods of model calibration such as Bayesian computation or parallel computation for probabilistic sensitivity analysis.
One of the challenges of sharing model development, which is not unique to health microsimulation, is that there is no commonly agreed-upon language in microsimulation modelling. However, increasingly some models are being published online, as Open Access. Some recent models which provide open-access code for their models to be shared include OpenM++ (https://ompp.sourceforge.io/), CMOST, a microsimulation model of colorectal cancer (Prakash et al., 2017) and JAS-mine, which can be applied to numerous purposes, such as labour modelling or health inequality modelling (Richiardi & Richardson, 2017).
4.5 Conclusion
From its infancy about 40 years ago, there has been a proliferation of microsimulation applications to health. Remarkably, the first recorded model was an ambitious collaboration between Egypt and the USA to model family planning as an expanded version of a dynamic population model. Microsimulation applications increased rapidly in the 1990s but were often simple cell-based approaches imputed onto established models designed for other purposes. These models were criticised for not having the benefits of unit record health data and the capacity for distributional analysis that distinguished tax-benefit microsimulation models. To overcome this limitation, later models began to be developed with health survey data as their base population. The use of health data as the primary data source is now an accepted convention, with some models even being based on the collection of new primary data specific to the application, where appropriate survey data is not available.
Over the last ten years, we have seen health become one of the most diverse and sophisticated applications of microsimulation. The most recent applications of microsimulation are being applied to the newest frontiers of medicine, such as genomic testing and personalised medicine. These new frontiers of science and medicine are likely to propel the development of health applications of microsimulation for decades to come. However early developments in this field relied on aggregate data and assumptions rather than on quality data with the inevitable product of flawed results. Thus the lessons of the 1990s serve as a timely reminder of the importance of rigorous methods and high quality, relevant microdata in this field.
Footnotes
1.
2.
Dynamic models allow individuals to change their characteristics over time, yet require more data and are more computationally intensive (Li et al., 2014). On the other hand, static models, often known as models that simulate the day after impact of a policy changes ignore changes to behaviour due to policy.
3.
Pre-implantation genetic diagnosis (PGD) is one of the various options available to couples with a high risk of transmitting a monogenic inherited disorder, or structural chromosomal variant to their prospective offspring (Hehr et al., 2014).
4.
Tan, Schofield, Shrestha, and Lymer: NSW HREC Reference No: HREC/17/CIPHS/7.
5.
Schofield et al.: NSW HREC Reference No: HREC/16/HNE/309; NHMRC Partnership Project: APP1113895).
Appendix
Selected microsimulation models of health, by purpose or application between 2007 and 2017. Sections A-H describe specific model types, including cancer, spatial models, disease transmission, cost-effectiveness, cross portfolio, health policy, cancer, and mortality respectively.
| Table A | |||
|---|---|---|---|
| Selected cancer models | Model type | Data sources | Sample sizes |
| USA (Goldhaber-Fiebert et al., 2007) | Parameterize, calibrate and evaluate a U.S. cervical cancer microsimulation model intended to provide inputs into decisions taken before longterm data on vaccination outcomes become available. | Cervical Cancer: Systematic reviews, USA women under different cervical cancer prevention strategies. | Cohort of women whose cervical cancer screening patterns matched nationally observed age-specific patterns of screening. |
| MISCAN, USA (Bradley et al., 2011) | Estimate and project productivity costs of colorectal cancer (CRC) and to model the savings from four approaches to reducing CRC incidence and mortality. | Colorectal Cancer (CRC): Productivity losses from CRC, using CRC incidence and mortality through to 2020. | USA population, with trends in risk factor (smoking, obesity, red meat consumption) prevalence, screening and treatment. 2000 US Life Table published by National Centre for Health Statistics. |
| LifeLossMOD, Australia (Carter et al., 2016). | Estimate the productivity costs of premature mortality due to cancer in Australia, in aggregate and for the 26 most prevalent cancer sites. | Mortality due to cancer: A mortality dataset and APPSIM microsimulation model. Household, Income and Labour Dynamics in Australia (HILDA survey). | Mortality data = 129,513 individuals from all deaths recorded by 2003 Burden of Disease and Injury Study. APPSIM uses 1% of the 2001 Australian Census, 188,000 records. |
| POHEM, Canada (Hennessy et al., 2015) | Dynamically simulate disease states, risk factors, and health determinants, project disease incidence, prevalence, life expectancy, health-adjusted life expectancy, quality of life, and healthcare costs. | Cancer and other chronic diseases. | Population of Canada. |
| Canada, (Pataky et al., 2014) | Evaluate the cost-effectiveness of Prostate-Specific Cancer Antigens PSA screening, with and without adjustment for quality of life, for the British Columbia (BC) population. | Prostate-Specific Cancer. | 40 year old men in British Columbia, Canada. |
| NSCLC, Canada, (Bongers et al., 2016) | Multistate statistical modelling to inform a microsimulation model for cost-effectiveness analysis in lung cancer. | Lung cancer: Non-small-cell lung cancer (NSCLC). Data were collected on patient and tumour characteristics, toxicity and follow-up. | 674 NSCLC patients with inoperable cancer. A subpopulation of 200 patients who received chemo or radiation alone was used. |
| MAIcare, Netherlands (van der Meijde et al., 2016) | A microsimulation model framework for melanoma using underlying tumour growth, plus interaction with diagnostics, treatments, and surveillance. | Melanoma: Disease progression and clinical management data from literature. | Dutch patient population, with baseline TNM and features of the Dutch cancer registry, between 2006 and 2011. |
| LCPM (China Lung Cancer Model), China (Sheehan et al., 2017) | Modelling eligibility criteria design of lung cancer screening. | Lung cancer: China Health & Nutrition Survey (CHNS). Projecting population outcomes associated with interventions for smoking- related diseases, age to begin and end screening, pack-years smoked, years since quitting, from published literature. | 422.0 male deaths from lung cancer, 175,000 female deaths from lung cancer. Smoking rates from 19.0 individuals using a weighted sampling scheme within provinces. |
| (USA) (Subramanian et al., 2017) | Develop an innovative model to assess the effectiveness, cost, and harms of risk stratified colorectal cancer (CRC) screening. | Colorectal Cancer: Census Survey Data, data from literature on screening and genetic testing of CRC. | A synthetic cohort reflecting the population of the USA and distribution of risk. |
| (Norway) (van Luijt et al., 2017) | Evaluated breast cancer mortality reduction and cost-effectiveness analysis. Comparison of mortality and costs with and without screening. | Breast Cancer: Data from the Cancer Registry of Norway, by age, year (1990–2010), and stage for the whole country were used to model screening attendance by age and year. | Imaginary cohort of 10,000,000 women all born in 1955, with complete follow-up to 2055. |
| Table B | |||
| Selected spatial models | Model type | Data sources | Sample sizes |
| (Ballas, Clarke, Dorling, Rigby, & Wheeler, 2006) | Dynamic spatial microsimulation model: Health Inequalities. | Census data from 1971, 1981 and 1991and British Household Panel survey, simulating urban and regional populations in Britain. | 41,855 households in 1991, 54,796 households in 2021. |
| (Edwards & Clarke, 2009) | Obesity in children in Leeds. Synthetic matching and linear regression used. | Census data from 2001. Obesogenic covariates from Health Survey for England (HSE) 2002 and Expenditure and Food Survey. | Children aged 3–13 years in the Leeds metropolitan area. 1,500 people per Lower Layer Super Output Area (LSOA), which are small geographic units built from output areas containing ∼ 1,500 individuals. |
| (Riva & Smith, 2012) | Psychological distress and heavy alcohol consumption. Logistic regression used. | HSE 2001 data matched to LSOA populations. | 30,304 individuals. |
| (Koh, Grady, & Vojnovic, 2015) | Obesity prevalence, Detroit. Iterative proportional fitting (IPF)-based deterministic spatial method. | 2010 Behavioural Risk Factor Surveillance System (BRFSS), U.S. Bureau of the Census, American Community Survey (ACS). | The study area is 1,967 square miles with a population of 3.86 million. BRFSS respondents, 18 years and older from Detroit Tri-County Metropolitan Area in 2010 (n = 3146). |
| (Campbell & Ballas, 2016) | SimAlba in Scotland. Health Inequalities. | Scottish Health Survey (2003) and Census of Population (2001) data. | 8,148 adults, 3,324 children. |
| Table 2C | |||
| Selected disease transmission models | Model type | Data sources | Sample sizes |
| (Goldhaber-Fiebert et al., 2007) | Stochastic microsimulation model of the transmission of Human Papilloma Virus (HPV) for cervical cancer prevention. | HPV infection rates, progression rates to/within cancer, regression rates from HPV and clearance rates, all-cause and cancer mortality rates. | Individual females enter the model at age 9, based on United States data. Model evaluation compared with large HPV screening studies. |
| (Sander et al., 2009) | Stochastic microsimulation transmission model: influenza pandemic mitigation strategies, targeted anti-viral prophylaxis. | Transmission parameters derived from literature on infections from symptomatic and asymptomatic infections. | People interacting in known contact groups, based on USA population. |
| (Degnan et al., 2009) | Bioterrorism through biological agents; that is bacteria, viruses or toxins (also a cost-effectiveness model). | Demographics, transport flows and trips, travel to emergency centres. | Baltimore MD metropolitan area, 951,000 people. |
| Table 2D | |||
| Selected cost-effectiveness models | Model type | Data sources | Sample sizes |
| (Barnighausen & Bloom, 2009) | Markov Monte Carlo model of cost-effectiveness of subSaharan African health care workers for treating HIV/AIDS. | Published literature on patient probabilities, and health education costs, salaries per year, and treatment costs per patient year. | Number of people in each sub-Saharan country who needed ART and did not receive it (UNAIDA/World Health Organisation data). |
| (Hiligsmann et al., 2009) | Markov model for cost-effectiveness of treating and preventing osteoporosis. | Fracture probabilities, mortality rates for each age-gender, fracture costs, interventions and utility values from published literature. | Not stated. |
| (Ahern et al., 2017) | Weight management trial cost-effectiveness. | Randomised Control Trial on weight loss interventions in a UK population. Assumptions about weight trajectories. | 1,269 participants, 18+ years old, BMI > 28 from England. |
| Table 2E | |||
| Selected cross portfolio models | Model type | Data sources | Sample sizes |
| (Percival et al., 2007) | STINMOD: A Static Income Model of tax and social security systems. | Survey Data (ABS, Australian Bureau of Statistics), Survey of Income and Housing data, tax and transfer payment rules. | Australian population, based on ABS data. |
| (Schofield et al., 2013) | Health&WealthMOD. Microsimulation of economic impacts of ill health. | Survey Data (ABS), Survey of Disability, Ageing and Carers, population and labour force growth data from Treasury, disease trends from Australian Burden of Disease Study, 2003. | Australian population aged 45–64 years in 2003 and 2009 SDAC surveys. |
| (Schofield, Shrestha, et al., 2017) | Health&WealthMOD. Microsimulation of economic impacts of ill health. Results estimated & projected to 2030. | Survey Data (ABS) Survey of Disability, Ageing and Carers, population and labour force growth data from Treasury, disease trends from Australian Burden of Disease Study, 2003. | Australian population aged 45–64 years in 2003 and 2009 SDAC surveys. |
| Table 2F | |||
| Selected health expenditure models | Model type | Data sources | Sample sizes |
| Intergeneration al reports, Australia (Schofield & Rothman, 2007) | Forecast health expenditure and other demographically sensitive expenditure over 40 years. | Australian Government Budget Papers, National Health Survey, The Australian Treasury Demographic Forecasts. | Microsimulation models based on Australian National Health Surveys ∼30,000 records. |
| Risk stratified colorectal cancer (Subramanian et al., 2017). | Assess the effectiveness, cost, and harms of risk stratified colorectal cancer screening. | National Health Interview Survey (NHIS) for risk of colorectal cancer, adjusted to ensure incidence is similar to those obtained from the Surveillance, Epidemiology, and End Results data (SEER). | Not described. |
| Table 2G | |||
| Diabetes models | Model type | Data sources | Sample sizes |
| Non-insulin-dependent diabetes mellitus (NIDDM), USA (Eastman et al., 1997) | Develop a model of NIDDM for analyzing prevention strategies for NIDDM. Predicts rates of microvascular complications, CVD and mortality to evaluate preventative interventions. | Large clinical trials and epidemiological studies. Risk of CVD was based on Framingham. | Not described. |
| DiabForcaster, UK (McEwan et al., 2006) | Determine the costs and outcomes associated with modifiable risk factors in patients with type 2 diabetes. | Utility: Health Outcomes Data Repository (HODaR), UK 2001–2003 gender-specific interim life tables. Eastman diabetes model. | 10,000 diabetic patients |
| UKPDS Outcomes Model (UKPDS-OM), UK (Clarke et al., 2004) | A diabetes model used for estimating the likelihood of major diabetes-related complications over a lifetime for health economic analysis. | United Kingdom Prospective Diabetes Study (UKPDS). | 3,642 patients. |
| UKPDS Outcomes Model 2 (UKPDS-OM2), UK (Hayes et al., 2013) | Revised version of UKPDS- OM, with updated risk, mortality, and new events algorithms, and the use of new risk factors. | UKPDS. | 5,102 patients. |
| ECHO, Sweden (Willis et al., 2013) | Simulate costs and health outcomes and the cost-effectiveness of type 2 diabetes treatments. | Macrovascular risk equations: UKPDS68, UKPDS82, ADVANCE, and the Swedish National Diabetes Registry. | Not described. |
| CORE, Swiss & US (Palmer et al., 2004) | To determine the long term health and economic outcomes of diabetes treatments. | Framingham, UKPDS risk engine and outcome model, Diabetes Control and Complications Trial (DCCT), and other published sources. | Not described. |
| MICADO, Netherlands (van der Heijden et al., 2015) | Estimate the long term cost-effectiveness of interventions in people with and without diabetes. | Dutch general practice registry data. | 498,400 diabetes patients |
| Michigan Model for Diabetes (MMD), USA (Zhou et al., 2005) | Assess the impact of screening, prevention and treatment strategies on type 2 diabetes and its complications, comorbidities, quality of life, and cost. | Wisconsin Epidemiologic Study of Diabetic Retinopathy (WESDR) type 2 diabetes cohort. Published literatures. | 1,370 patients. |
| Diabetes model, Australia (Walker & Colagiuri, 2011) | Modelling diabetes and its health system costs. | National Health Survey, AUSDIAB. | 30,000 patients. |
| (Bertram et al., 2010), Australia | Evaluate the cost-effectiveness of a screening programme and follow up interventions for pre-diabetes. | AUSDIAB. | 8,000 people. |
| HealthAgeing MOD, Australia, (Bertram et al., 2010) | Cost-benefit model system of chronic diseases to assess and rank prevention and treatment options. Designed to use standard cost-benefit and cost-effectiveness methods to assess the impact of a series of simulated policy options | National Health Survey 2005 Survey of Disability, Ageing and Carers 2003 | 25,906 people. |
| NCDMod, Australia (Lymer et al., 2016) | Simulate population level impacts of interventions to prevent/delay chronic health conditions, particularly diabetes, heart disease and obesity. | National Health Survey 2005, AUSDIAB, AUSDRISK, HealthAgeingMOD, Australian Health Survey 2011. | Australian population (∼17 million people) |
| POHEM-CVD, Canada (Manuel et al., 2014) | Models health, health risk factors and health costs. | Canadian Community Health Survey (CCHS). | 105,908 people. |
| POHEM-BMI, Canada (Hennessy et al., 2017) | Simulate using BMI to predict rates of overweight and obesity in the Canadian population | National Population Health Survey, the Canadian Community Health Survey (CCHS), and the Canadian Health Measures Survey (CHMS). | 5, 000 people. |
| Table 2H | |||
| Selected mortality models | Model type | Data sources | Sample sizes |
| Productivity colorectal cancer, USA (Bradley et al., 2011) | Estimating lost productivity from mortality due to colorectal cancer. A semi- Markov microsimulation model from CISNET. | National Cancer Institute's (NCI) Cancer Intervention and Surveillance Modeling Network (CISNET), MISCAN-Colon, National Health Interview Survey. | USA population based on MISCAN-Colon, and life tables from the 2000 US Life Table, from National Centre for Health Statistics; 48,748 people. |
| LifeLossMOD, Australia (Carter et al., 2016, 2017) | Dynamic microsimulation model from NATSEM. Modelling productivity impacts of premature mortality from cancer. | 2003 mortality dataset and the APPSIM microsimulation model, projections from 2003 to 2030. | APPSIM uses a 1% sample of the Australian population. Mortality data is sourced from 129,513 individual mortality records, of all registered deaths in Australia in 2003, from the 2003 Australian Burden of Disease Study. |
| (van Luijt et al., 2017), Norway | Estimate the breast cancer mortality reduction due to screening and the cost-effectiveness of screening programme. | NORDCAN, MISCAN, 2005 Life table from Statistics Norway, Cancer Registry of Norway. | 10,000,000 people. |
References
-
1
Extended and standard duration weight-loss programme referrals for adults in primary care (WRAP): a randomised controlled trialLancet 789:2214–2225.
-
2
Household Expenditure Survey, Australia: the effects of Government Benefits and Taxis on Household Income, 1984Household Expenditure Survey, Australia: the effects of Government Benefits and Taxis on Household Income, 1984, Canberra.
-
3
Household Expenditure Survey, Australia: the Effects of Government Benefits and Taxes on Household Income, 1988-89Household Expenditure Survey, Australia: the Effects of Government Benefits and Taxes on Household Income, 1988-89, Canberra.
-
4
Using geographical information systems and spatial microsimulation for the analysis of health inequalitiesHealth Informatics Journal 12:65–79.
-
5
“Conditional scholarships” for HIV/AIDS health workers: educating and retaining the workforce to provide antiretroviral treatment in subSaharan AfricaSocial Science & Medicine 68:544–551.
-
6
Comparative effectiveness of screening strategies for Lynch syndromeJournal of the National Cancer Institute, 107, 4, http://doi.org/10.1093/jnci/djv005.
-
7
Assessing the cost-effectiveness of drug and lifestyle intervention following opportunistic screening for pre-diabetes in primary careDiabetologia 57:875–881.
-
8
Multistate Statistical Modeling: A Tool to Build a Lung Cancer Microsimulation Model That Includes Parameter Uncertainty and Patient HeterogeneityMedical Decision Making: An International Journal of the Society for Medical Decision Making 76:86–100.
-
9
Productivity Savings from Colorectal Cancer Prevention and Control StrategiesAugust, American Journal of Preventive Medicine, http://doi.org/10.1016/j.amepre.2011.04.008.
-
10
Editorial Special Issue on “Health and Microsimulation.”International Journal of Microsimulation 4:1–2.
-
11
3.0 User and Technical DocumentationCORSIM, 3.0 User and Technical Documentation, Cornell University.
-
12
Missing Transfers: Adjusting Household incomes for Noncash BenefitsIn 23rd General Conference of the International Association for Research in Income and Wealth.
-
13
SimAlba: A Spatial Microsimulation Approach to the Analysis of Health InequalitiesFrontiers in Public Health 4:230.
- 14
-
15
The long-term productivity impacts of all cause premature mortality in AustraliaAustralian and New Zealand Journal of Public Health 41:137–143.
-
16
Mathematical models for HIV transmission dynamics: tools for social and behavioral science researchJournal of Acquired Immune Deficiency Syndromes (1999) 47:S34–9.
-
17
Assessing the impacts of alcohol policies: a microsimulation approac (OECD Health Working Papers, No. 80)Assessing the impacts of alcohol policies: a microsimulation approac (OECD Health Working Papers, No. 80), Paris, http://doi.org/10.1787/5js1qwkvx36d-en.
-
18
The Effects of Taxes and Benefits on Household Income, 1989The Effects of Taxes and Benefits on Household Income, 1989.
-
19
Tax policy toward health insurance and the demand for medical servicesJournal of Health Economics 6:1–25.
-
20
A model to estimate the lifetime health outcomes of patients with Type 2 diabetes: the United Kingdom Prospective Diabetes Study (UKPDS) Outcomes Model (UKPDS No. 68)Diabetologia 47:1747–1759.
-
21
Using the Cancer Risk Management Model to evaluate colorectal cancer screening options for CanadaCurrent Oncology (Toronto, Ont.) 22:e41–50.
-
22
National Health Genomics Policy Framework 2018-2021Retrieved May 24, 2018, from, http://www.health.gov.au/internet/main/publishing.nsf/Content/national-health-genomics-policy-framework-2018-2021.
-
23
Quantitative interpretation of age-specific mortality reductions from the Swedish breast cancer-screening trialsJournal of the National Cancer Institute 87:1217–1223.
-
24
A Simulation Model for Bioterrorism Preparedness in Urban AreasIn: CA Brebbia, F Garzia, M Guarascio, editors. Safety and security engineering III. WIT Press. pp. 281–291.
- 25
- 26
-
27
Lead times and overdetection due to prostate-specific antigen screening: Estimates from the European randomized study of screening for prostate cancerJournal of the National Cancer Institute 75:868–878.
-
28
Aligning incentives to fulfil the promise of personalised medicineThe Lancet 385:2118–2119.
-
29
Model of complications of NIDDM: I. Model construction and assumptionsDiabetes Care 20:725–734.
-
30
A Cost-Effectiveness Evaluation of Germline BRCA1 and BRCA2 Testing in UK Women with Ovarian CancerValue in Health 20:567–576.
-
31
Aspects of the Social Wage: A Review of Social Expenditures and Redistribution (Council Paper No. 27)Aspects of the Social Wage: A Review of Social Expenditures and Redistribution (Council Paper No. 27), Canberra.
-
32
The design and validation of a spatial microsimulation model of obesogenic environments for children in Leeds, UK: SimObesitySocial Science and Medicine 69:1127–1134.
-
33
Internal and External Validation of Spatial Microsimulation Models: Small Area Estimates of Adult ObesityApplied Spatial Analysis and Policy 4:281–300.
- 34
-
35
The Distribution of Welfare Benefits In Kind (Welfare State Programs, Discussion Paper No. 068)London School of Economics.
-
36
Canadian Cancer Risk Management Model: evaluation of cancer controlInternational Journal of Technology Assessment in Health Care 29:131–139.
-
37
Whole-exome sequencing reanalysis at 12 months boosts diagnosis and is cost-effective when applied early in Mendelian disordersGenetics in Medicine: Official Journal of the American College of Medical Genetics, http://doi.org/10.1038/gim.2018.39.
-
38
Precision medicine for urothelial bladder cancer: update on tumour genomics and immunotherapyNature Reviews. Urology 15:92–111.
-
39
SESIM: A Swedish Micro-Simulation ModelIn: A Klevmarken, B Lindgren, editors. Simulating an Ageing Population: A Microsimulation Approach Applied to Sweden (Contributions to Economic Analysis, Volume 285). Emerald Group Publishing Limited. pp. 55–83.
-
40
Cost-utility analysis of liraglutide versus glimepiride as addon to metformin in type 2 diabetes patients in ChinaInternational Journal of Technology Assessment in Health Care 28:436–444.
-
41
Clinical Utility of Expanded Carrier Screening: Reproductive Behaviors of At-Risk CouplesJournal of Genetic Counseling 27:616–625.
- 42
-
43
Modeling human papillomavirus and cervical cancer in the United States for analyses of screening and vaccinationPopulation Health Metrics 5:11.
-
44
Benefits and costs of screening Ashkenazi Jewish women for BRCA1 and BRCA2Journal of Clinical Oncology 17:494–500.
-
45
The MISCAN simulation program for the evaluation of screening for diseaseComputer Methods and Programs in Biomedicine 20:79–93.
-
46
Evaluating the impact of varied compliance to lung cancer screening recommendations using a microsimulation modelCancer Causes & Control: CCC 28:947–958.
- 47
-
48
The Lifetime Distributional Impact of Government Health OutlaysAustralian Economic Review 35:363–379.
-
49
UKPDS Outcomes Model 2: a new version of a model to simulate lifetime health outcomes of patients with type 2 diabetes mellitus using data from the 30 year United Kingdom Prospective Diabetes Study: UKPDS 82Diabetologia 56:1925–1933.
-
50
Childhood Cancer: Its Impact and Financial Costs for Australian FamiliesPediatric Hematology and Oncology 23:439–448.
- 51
-
52
The Population Health Model (POHEM): an overview of rationale, methods and applicationsPopulation Health Metrics 13:24.
-
53
Development of a population-based microsimulation model of body mass indexHealth Reports 28:20–30.
-
54
Development and validation of a Markov microsimulation model for the economic evaluation of treatments in osteoporosisValue in Health: The Journal of the International Society for Pharmacoeconomics and Outcomes Research 12:687–696.
-
55
Sharpening the Edge for Precision Cancer Immunotherapy: Targeting Tumor Antigens through Oncolytic VaccinesFrontiers in Immunology 8:800.
- 56
-
57
Economic Models of Colorectal Cancer Screening in Average-Risk Adults: Workshop SummaryEconomic Models of Colorectal Cancer Screening in Average-Risk Adults: Workshop Summary, The National Academies Press, http://doi.org/10.17226/11228.
-
58
Trends in the Distribution of Cash Income and Non Cash Benefits: an Overview. Report to the Prime Minister and CabinetCanberra: AGPS.
-
59
Brookings/ICF Long-Term Care Financing Model: Model Assumptions. Report Office of the Assistan Secretary for Planning and EvaluationU.S.: Department of Health and Human Services.
-
60
Towards a computerized demographic microsimulation model for Egypt: experimentation of POPSIM: 1The Egyptian Population and Family Planning Review 5:153–166.
-
61
Projected impacts of federal tax policy proposals on mortality burden in the United States: A microsimulation analysisPreventive Medicine, http://doi.org/10.1016/j.ypmed.2017.10.021.
-
62
Using simulated data to investigate the spatial patterns of obesity prevalence at the census tract level in metropolitan DetroitApplied Geography 62:19–28.
-
63
A bio-demographic analysis of Japanese fertility via micro-simulationJinko Mondai Kenkyu. Journal of Population Problems pp. 1–29.
-
64
The Role of Microsimulation in the Development of Public Policy305–320, Policy Practice and Digital Science: Integrating Complex Systems, Social Simulation and Public Administration in Policy Research, Springer, http://doi.org/10.1007/978-3-319-12784-2_14.
-
65
Breast cancer screening in BRCA1 mutation carriers: effectiveness of MR imaging - Markov Monte Carlo decision analysisRadiology 246:763–771.
-
66
Economic Cost and Health Care Workforce Effects of School Closures in the U.S.PLoS Currents, 1, http://doi.org/10.1371/currents.RRN1051.
- 67
- 68
-
69
Measuring the Population Impact of Introducing Stereotactic Ablative Radiotherapy for Stage I Non-Small Cell Lung Cancer in CanadaOncologist 19:880–885.
-
70
Developing a Dynamic Microsimulation Model of the Australian Health System: A Means to Explore Impacts of Obesity over the Next 50 YearsEpidemiology Research International pp. 1–13.
-
71
Predicting The Need For Aged Care Services At The Small Area Level: The CAREMOD Spatial Microsimulation ModelInternational Journal of Microsimulation 2:27–42.
-
72
NCDMod: A microsimulation model projecting chronic disease and risk factors for Australian adultsInternational Journal of Microsimulation 9:103–139.
-
73
Features and Added Value of Simulation Models Using Different Modelling Approaches Supporting Policy-Making: A Comparative AnalysisPolicy Practice and Digital Science: Integrating Complex Systems, Social Simulation and Public Administration in Policy Research pp. 95–123.
-
74
Projections of preventable risks for cardiovascular disease in Canada to 2021: a microsimulation modelling approachCMAJ Open 2:E94–E101.
-
75
Effects of communicating DNA-based disease risk estimates on risk-reducing behavioursThe Cochrane Database of Systematic Reviews, 10, 10, http://doi.org/10.1002/14651858.CD007275.pub2.
-
76
Evaluation of the costs and outcomes from changes in risk factors in type 2 diabetes using the Cardiff stochastic simulation cost-utility model (DiabForecaster)Current Medical Research and Opinion 22:121–129.
-
77
Regression-Style Models for Parameter Estimation in Dynamic Microsimulation: An Empirical Performance AssessmentInternational Journal of Microsimulation 8:83–127.
-
78
Evaluation of the natural history of cancer of the cervix, implications for prevention. The Cancer Risk Management Model (CRMM) - Human papillomavirus and cervical componentsJournal of Cancer Policy 4:1–6.
- 79
-
80
Fecundability Differentials Among Acceptors and Non-Acceptors of Family Planning. A Simulation ExperimentFecundability Differentials Among Acceptors and Non-Acceptors of Family Planning. A Simulation Experiment, Duke, Chapel Hill, North Carolina.
-
81
Improving Information for Social Policy Decisions - The Uses of Microsimulation Modeling Volume I, Review and RecommendationsImproving Information for Social Policy Decisions - The Uses of Microsimulation Modeling Volume I, Review and Recommendations, The National Academies Press, .
-
82
Mammographic screening in BRCA1 mutation carriers postponed until age 40: Evaluation of benefits, costs and radiation risks using modelsEuropean Journal of Cancer 63:135–142.
-
83
A New Type of Socio-Economic SystemThe Review of Economics and Statistics.
- 84
-
85
The CORE Diabetes Model: Projecting long-term clinical outcomes, costs and cost-effectiveness of interventions in diabetes mellitus (types 1 and 2) to support clinical and reimbursement decision-makingCurrent Medical Research and Opinion 20:S5–26.
-
86
Integrating exome sequencing into a diagnostic pathway for epileptic encephalopathy: Evidence of clinical utility and cost effectivenessMolecular Genetics & Genomic Medicine 6:186–199.
-
87
Validation of the CORE Diabetes Model Against Epidemiological and Clinical StudiesCurrent Medical Research and Opinion 20:S27–S40.
-
88
A computer simulation model for the practical planning of cervical cancer screening programmesBritish Journal of Cancer 51:551–568.
-
89
Is prostate cancer screening cost-effective? A microsimulation model of prostate-specific antigen-based screening for British Columbia, CanadaInternational Journal of Cancer 135:939–947.
-
90
STINMOD (Static Income Model)In: A Gupta, A Harding, editors. Modelling Our Future: Population Ageing Health and Aged care. Elsevier. pp. 477–482.
-
91
ONCHOSIM: a model and computer simulation program for the transmission and control of onchocerciasisComputer Methods and Programs in Biomedicine 31:43–56.
-
92
Using the Cancer Risk Management Model to evaluate the health and economic impacts of cytology compared with human papillomavirus DNA testing for primary cervical cancer screening in CanadaCurrent Oncology (Toronto, Ont.) 23:S56–63.
-
93
CMOST: an open-source framework for the microsimulation of colorectal cancer screening strategies. BMC Medical Informatics and Decision Making80, 17, 1, http://doi.org/10.1186/s12911-017-0458-9.
-
94
Estimating small area health-related characteristics of populations: a methodological reviewGeospatial Health, 12, 1, http://doi.org/10.4081/gh.2017.495.
-
95
JAS-mine: A new platform for microsimulation and agent-based modellingInternational Journal of Microsimulation 10:106–134.
-
96
Generating small-area prevalence of psychological distress and alcohol consumption: validation of a spatial microsimulation methodSocial Psychiatry and Psychiatric Epidemiology 47:745–755.
-
97
National health insurance microsimulation: The supply responsePaper presented at the Southern Economic Association Meetings.
- 98
-
99
Dynamic microsimulation models for health outcomes: a reviewMedical Decision Making 31:10–18.
-
100
Genomics England’s implementation of its public engagement strategy: blurred boundaries between engagement for the United Kingdom’s 100,000 Genomes project and the need for public supportPublic Understanding of Science 27:352–364.
-
101
Economic evaluation of influenza pandemic mitigation strategies in the United States using a stochastic microsimulation transmission modelValue in Health: The Journal of the International Society for Pharmacoeconomics and Outcomes Research 12:226–233.
- 102
-
103
The prevention of lifestyle-related chronic diseases: an economic framework (OECD Health Working Papers No. 32)The prevention of lifestyle-related chronic diseases: an economic framework (OECD Health Working Papers No. 32), http://doi.org/10.1787/243180781313.
-
104
Monetising the provision of informal long-term care by elderly people: estimates for European out-of-home caregivers based on the well-being valuation methodHealth and Social Care in the Community 24:E81–E91.
-
105
Public Expenditure on Hospitals: Measuring the Distributional ImpactPublic Expenditure on Hospitals: Measuring the Distributional Impact, No. 37, University of. Canberra.
-
106
Re-examining the distribution of health benefils in Australia - who benefits from the pharmaceutical benefits scheme?Re-examining the distribution of health benefils in Australia - who benefits from the pharmaceutical benefits scheme?, No. 36, University of Canberra.
-
107
Cost-effectiveness of massively parallel sequencing for diagnosis of paediatric muscle diseasesNPJ Genomic Medicine 2:4.
-
108
Health ModelsIn: C O’Donoghue, editors. Handbook of Microsimulation Modelling (Contributions to Economic Analysis, Volume 293). Emerald Group Publishing Limited. pp. 421–447.
-
109
The Financial Vulnerability of Individuals with DiabetesThe British Journal of Diabetes & Vascular Disease 10:300–304.
-
110
The personal and national costs of lost labour force participation due to arthritis: an economic study. BMC Public Health188, 13, 1, http://doi.org/10.1186/1471-2458-13-188.
-
111
Health & WealthMOD: A Microsimulation Model Of The Economic Impacts Of Diseases On Older WorkersInternational Journal of Microsimulation 2:58–63.
-
112
Projections of Commonwealth Health Expenditure in Australia’s First Intergenerational ReportIn: A Gupta, A Harding, editors. Modelling Our Future: Population Ageing, Health and Aged Care. Elsevier. pp. 149–168.
-
113
The costs of diabetes among Australians aged 45-64-years from 2015 to 2030: Projections of lost productive life years (PLYs), lost personal income, lost taxation revenue, extra welfare payments and lost gross domestic product from Health&WealthMOD2030BMJ Open, 7, 1, http://doi.org/10.1136/bmjopen-2016-013158.
-
114
Description of MISCAN-Lung, the Erasmus MC Lung Cancer Micro-Simulation Model for Evaluating Cancer Control InterventionsRisk Analysis: An Official Publication of the Society for Risk Analysis.
- 115
-
116
Evaluating lung cancer screening in China: implications for eligibility criteria design from a microsimulation modeling approachPloS One, 12, 3, E0173119, http://doi.org/10.1371/journal.pone.0173119.
-
117
Dementia care: Intersecting informal family care and formal care systems2014, 1, http://doi.org/10.1155/2014/486521.
- 118
-
119
Prospective comparison of the cost-effectiveness of clinical whole-exome sequencing with that of usual care overwhelmingly supports early use and reimbursementGenetics in Medicine: Official Journal of the American College of Medical Genetics 19:867–874.
- 120
-
121
Modeling the clinical and economic implications of obesity using microsimulationJournal of Medical Economics 18:886–897.
-
122
Personalized medicine for prevention: can risk stratified screening decrease colorectal cancer mortality at an acceptable cost?Cancer Causes and Control 28:299–308.
-
123
Application of next-generation sequencing to improve cancer management: A review of the clinical effectiveness and cost-effectivenessClinical Genetics 93:533–544.
-
124
Diagnostic Impact and Cost-effectiveness of Whole-Exome Sequencing for Ambulant Children With Suspected Monogenic ConditionsJAMA Pediatrics 171:855–862.
-
125
Limits to Personalized Cancer MedicineThe New England Journal of Medicine 375:1289–1294.
-
126
Performance and Cost-Effectiveness of Computed Tomography Lung Cancer Screening Scenarios in a Population-Based Setting: A Microsimulation Modeling Analysis in Ontario, CanadaPLoS Medicine, 14, 2, http://doi.org/10.1371/journal.pmed.1002225.
-
127
Policy evaluation in diabetes prevention and treatment using a population-based macro simulation model: the MICADO modelDiabetic Medicine: A Journal of the British Diabetic Association 32:1580–7.
-
128
The Melanoma MAICare Framework: A Microsimulation Model for the Assessment of Individualized Cancer CareCancer Informatics 15:115–127.
-
129
The role of the expected value of individualized care in cost-effectiveness analyses and decision makingValue in Health: The Journal of the International Society for Pharmacoeconomics and Outcomes Research 15:13–21.
-
130
Cost effectiveness of adding dapagliflozin to insulin for the treatment of type 2 diabetes mellitus in the NetherlandsClinical Drug Investigation 34:135–146.
-
131
Cost-effectiveness of the Norwegian breast cancer screening programInternational Journal of Cancer 140:833–840.
-
132
Epidemiological evidence for age-dependent regression of pre-invasive cervical cancerBritish Journal of Cancer 64:559–565.
-
133
The need for microsimulation to evaluate osteoporosis interventionsOsteoporosis International: A Journal Established as Result of Cooperation between the European Foundation for Osteoporosis and the National Osteoporosis Foundation of the USA 16:353–358.
-
134
Hot topics in 2017 in oncology and hematology6–14, A selection by the editorial board of, Bulletin du Cancer. Bulletin du Cancer, 105, 1, http://doi.org/10.1016/j.bulcan.2017.11.006.
-
135
How much can current interventions reduce colorectal cancer mortality in the U.S.? Mortality projections for scenarios of risk-factor modification, screening, and treatmentCancer 107:1624–1633.
-
136
Data Matching to Allocate Doctors to Patients in a Microsimulation Model of the Primary Care Process in New ZealandSocial Science Computer Review 30:358–368.
-
137
It’s more than dollars and cents: the impact of childhood cancer on parents’ occupational and financial healthJournal of Psychosocial Oncology 32:602–621.
-
138
Cost-Benefit Model of Diabetes Prevention and Care: Model Construction, Assumptions and Validation (NATSEM Technical Paper No. 28)Cost-Benefit Model of Diabetes Prevention and Care: Model Construction, Assumptions and Validation (NATSEM Technical Paper No. 28), Canberra.
-
139
Cost-Benefit Model System of Chronic Diseases in Australia to Assess and Rank Prevention and Treatment Options57–70, Cost-Benefit Model System of Chronic Diseases in Australia to Assess and Rank Prevention and Treatment Options, International Journal of Microsimulation, 4, 3.
-
140
Recent developments in decision-analytic modelling for economic evaluationPharmacoEconomics 24:1043–1053.
-
141
Cost-effectiveness of memantine in moderate-to-severe Alzheimer’s disease patients receiving donepezilCurrent Medical Research and Opinion.
-
142
Small-Area Incomes: Their Spatial Variability and the Relative Efficacy of Proxy, Geodemographic, Imputed and Model-Based EstimatesApplied Spatial Analysis and Policy 9:463–489.
-
143
The Estimation of Population Microdata by Using Data from Small Area Statistics and Samples of Anonymised RecordsEnvironment and Planning A: Economy and Space 30:785–816.
-
144
The Future of Precision Medicine in Australia. Report for the Australian Council of Learned AcademiesThe Future of Precision Medicine in Australia. Report for the Australian Council of Learned Academies.
-
145
Validation of economic and health outcomes simulation model of type 2 diabetes mellitus (ECHO-T2DM)Journal of Medical Economics 16:1007–1021.
-
146
Policy analysis through microsimulation: the STATS modelSocial Security Bulletin 50:1–12.
-
147
POHEM--a framework for understanding and modelling the health of human populationsWorld Health Statistics Quarterly. Rapport Trimestriel de Statistiques Sanitaires Mondiales 47:157–176.
-
148
Next-generation personalised medicine for high-risk paediatric cancer patients - The INFORM pilot studyEuropean Journal of Cancer 65:91–101.
-
149
The Michigan Model for Coronary Heart Disease in Type 2 Diabetes: Development and ValidationDiabetes Technology & Therapeutics 17:701–711.
-
150
A microsimulation model of the health care system: the role of the hospital sectorApplied Mathematics and Computation 1:105–130.
-
151
A computer simulation model of diabetes progression, quality of life, and costDiabetes Care 28:2856–2863.
Article and author information
Author details
Publication history
- Version of Record published: April 30, 2018 (version 1)
Copyright
© 2018, Schofield
This article is distributed under the terms of the Creative Commons Attribution License, which permits unrestricted use and redistribution provided that the original author and source are credited.