A brief, global history of microsimulation models in health: Past applications, lessons learned and future directions
- Macquarie University, Australia
- The University of Sydney, Australia
Cite this article
as: D. J Schofield, M. JB Zeppel, O. Tan, S. Lymer, M. M Cunich, R. N Shrestha; 2018; A brief, global history of microsimulation models in health: Past applications, lessons learned and future directions; International Journal of Microsimulation; 11(1); 97-142.
doi: 10.34196/ijm.00175
- Article
- Figures and data
- Jump to
Figures
Figure 1
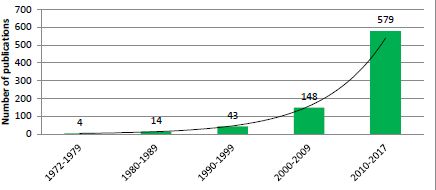
Exponential growth in the number of publications relating to application of microsimulation in health research by decade.
Source: PubMed, keyword ‘Microsimulation’.
Figure 2
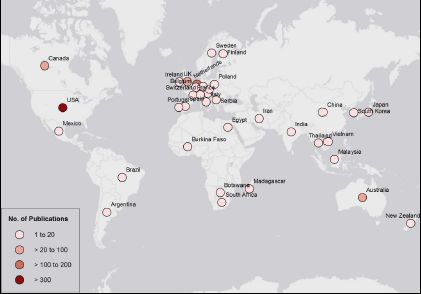
Global distribution of publications on microsimulation between 1972 and 2017, from a medical database, PubMed.
Source: PubMed, keyword ‘Microsimulation’.
Figure 3

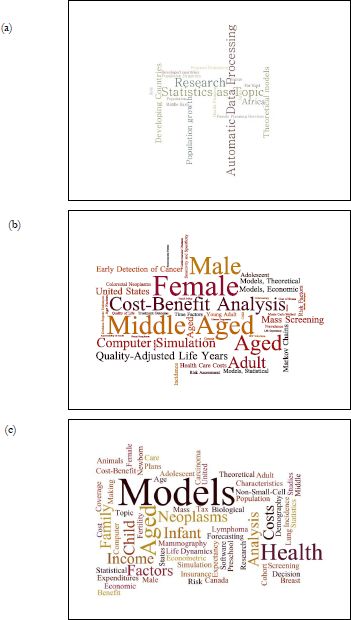
A figurative representation of the MeSH (Medical Subject Headings) words used for ‘microsimulation’ papers from (a) 1990 to 1999, (b) 2000 to 2009, and (c) 2010 to 2018. The size of each phrase represents the relative weight of the number of times each phrase is used.
Source: PubMed, keyword ‘Microsimulation’.
Tables
Table 1
A selection of microsimulation models of health: 1970–1989.
| Model, country (source, year) | Aims/objectives | Data sources | Sample sizes |
|---|---|---|---|
| POPSIM, Egypt (Khalifa, 1972) | Study the effects of various forces, for instance family planning, on the Egyptian population. The model generates vital health events and life histories for each individual in the computerized population. | Longitudinal or historical data. | Entire population. |
| HRRC, USA, (Yett et al., 1975) | Examine impacts of health policies on behaviour of individuals and institutions comprising the health care system. | Local, State and Federal Hospital data, Census data, Annual Survey of Hospitals. | Up to 2,170,000. |
| USA, (Rossiter & Wilensky, 1978) | Suggest empirical health models for estimating elasticity of demand and supply for physician and medical services. | National Medical Care Centre Expenditure Survey (NMCES) data and National Centre for Health Statistics. | Not stated. |
| West Nigeria, (Santow, 1978) | Assess fertility of the Yoruba of Western Nigeria and changes in the durations of lactation and marital sexual abstinence. | Demographic surveys, fertility survey of Ibadan (CAFN1). | Not available. |
| UN Population Division Model, Japan (Kono et al., 1983) | Simulate Japanese fertility, using conception, mortality and nuptiality, affecting the level and trend of fertility. | Field survey on fertility. Japanese population data from 1945 to 1982. | 3,000 married couples. |
| Converse, India (Roy, 1984) | Examine sterilization in India and makes demographic analysis of the performance. | Not stated. | Not stated. |
| England and Wales, (Parkin, 1985) | Reproduce demographic events in a female population over a 30 year period, and superimposes the natural history of cervical carcinoma, using data derived from published studies. | 1961 Census data, England and Wales from 1961 to 1990. Conditional probabilities of childbirth at a given age, from literature. | Arbitrary size, with the demographic makeup of England and Wales. |
| USA, (Chernick et al., 1987) | Determine the links between tax subsidies and health insurance, using elasticity’s of demand for health insurance and medical services in a static microsimulation model. | March 1980, Current Population Survey data, including health insurance information. Battelle Employment-Belated Health Benefits Survey, 1977–78. | USA Population of 1979. |
| USA, STATS, (Wixon, Bridges, & Pattison, 1987) | Inform health policy through a national survey of households to calculate taxes or benefits for thousands of persons or families, case by case. | National Current Population Survey data. | More than 100,000 people. |
Table A.1
Selected microsimulation models of health, by purpose or application between 2007 and 2017. Sections A-H describe specific model types, including cancer, spatial models, disease transmission, cost-effectiveness, cross portfolio, health policy, cancer, and mortality respectively.
| Table A | |||
|---|---|---|---|
| Selected cancer models | Model type | Data sources | Sample sizes |
| USA (Goldhaber-Fiebert et al., 2007) | Parameterize, calibrate and evaluate a U.S. cervical cancer microsimulation model intended to provide inputs into decisions taken before longterm data on vaccination outcomes become available. | Cervical Cancer: Systematic reviews, USA women under different cervical cancer prevention strategies. | Cohort of women whose cervical cancer screening patterns matched nationally observed age-specific patterns of screening. |
| MISCAN, USA (Bradley et al., 2011) | Estimate and project productivity costs of colorectal cancer (CRC) and to model the savings from four approaches to reducing CRC incidence and mortality. | Colorectal Cancer (CRC): Productivity losses from CRC, using CRC incidence and mortality through to 2020. | USA population, with trends in risk factor (smoking, obesity, red meat consumption) prevalence, screening and treatment. 2000 US Life Table published by National Centre for Health Statistics. |
| LifeLossMOD, Australia (Carter et al., 2016). | Estimate the productivity costs of premature mortality due to cancer in Australia, in aggregate and for the 26 most prevalent cancer sites. | Mortality due to cancer: A mortality dataset and APPSIM microsimulation model. Household, Income and Labour Dynamics in Australia (HILDA survey). | Mortality data = 129,513 individuals from all deaths recorded by 2003 Burden of Disease and Injury Study. APPSIM uses 1% of the 2001 Australian Census, 188,000 records. |
| POHEM, Canada (Hennessy et al., 2015) | Dynamically simulate disease states, risk factors, and health determinants, project disease incidence, prevalence, life expectancy, health-adjusted life expectancy, quality of life, and healthcare costs. | Cancer and other chronic diseases. | Population of Canada. |
| Canada, (Pataky et al., 2014) | Evaluate the cost-effectiveness of Prostate-Specific Cancer Antigens PSA screening, with and without adjustment for quality of life, for the British Columbia (BC) population. | Prostate-Specific Cancer. | 40 year old men in British Columbia, Canada. |
| NSCLC, Canada, (Bongers et al., 2016) | Multistate statistical modelling to inform a microsimulation model for cost-effectiveness analysis in lung cancer. | Lung cancer: Non-small-cell lung cancer (NSCLC). Data were collected on patient and tumour characteristics, toxicity and follow-up. | 674 NSCLC patients with inoperable cancer. A subpopulation of 200 patients who received chemo or radiation alone was used. |
| MAIcare, Netherlands (van der Meijde et al., 2016) | A microsimulation model framework for melanoma using underlying tumour growth, plus interaction with diagnostics, treatments, and surveillance. | Melanoma: Disease progression and clinical management data from literature. | Dutch patient population, with baseline TNM and features of the Dutch cancer registry, between 2006 and 2011. |
| LCPM (China Lung Cancer Model), China (Sheehan et al., 2017) | Modelling eligibility criteria design of lung cancer screening. | Lung cancer: China Health & Nutrition Survey (CHNS). Projecting population outcomes associated with interventions for smoking- related diseases, age to begin and end screening, pack-years smoked, years since quitting, from published literature. | 422.0 male deaths from lung cancer, 175,000 female deaths from lung cancer. Smoking rates from 19.0 individuals using a weighted sampling scheme within provinces. |
| (USA) (Subramanian et al., 2017) | Develop an innovative model to assess the effectiveness, cost, and harms of risk stratified colorectal cancer (CRC) screening. | Colorectal Cancer: Census Survey Data, data from literature on screening and genetic testing of CRC. | A synthetic cohort reflecting the population of the USA and distribution of risk. |
| (Norway) (van Luijt et al., 2017) | Evaluated breast cancer mortality reduction and cost-effectiveness analysis. Comparison of mortality and costs with and without screening. | Breast Cancer: Data from the Cancer Registry of Norway, by age, year (1990–2010), and stage for the whole country were used to model screening attendance by age and year. | Imaginary cohort of 10,000,000 women all born in 1955, with complete follow-up to 2055. |
| Table B | |||
| Selected spatial models | Model type | Data sources | Sample sizes |
| (Ballas, Clarke, Dorling, Rigby, & Wheeler, 2006) | Dynamic spatial microsimulation model: Health Inequalities. | Census data from 1971, 1981 and 1991and British Household Panel survey, simulating urban and regional populations in Britain. | 41,855 households in 1991, 54,796 households in 2021. |
| (Edwards & Clarke, 2009) | Obesity in children in Leeds. Synthetic matching and linear regression used. | Census data from 2001. Obesogenic covariates from Health Survey for England (HSE) 2002 and Expenditure and Food Survey. | Children aged 3–13 years in the Leeds metropolitan area. 1,500 people per Lower Layer Super Output Area (LSOA), which are small geographic units built from output areas containing ∼ 1,500 individuals. |
| (Riva & Smith, 2012) | Psychological distress and heavy alcohol consumption. Logistic regression used. | HSE 2001 data matched to LSOA populations. | 30,304 individuals. |
| (Koh, Grady, & Vojnovic, 2015) | Obesity prevalence, Detroit. Iterative proportional fitting (IPF)-based deterministic spatial method. | 2010 Behavioural Risk Factor Surveillance System (BRFSS), U.S. Bureau of the Census, American Community Survey (ACS). | The study area is 1,967 square miles with a population of 3.86 million. BRFSS respondents, 18 years and older from Detroit Tri-County Metropolitan Area in 2010 (n = 3146). |
| (Campbell & Ballas, 2016) | SimAlba in Scotland. Health Inequalities. | Scottish Health Survey (2003) and Census of Population (2001) data. | 8,148 adults, 3,324 children. |
| Table 2C | |||
| Selected disease transmission models | Model type | Data sources | Sample sizes |
| (Goldhaber-Fiebert et al., 2007) | Stochastic microsimulation model of the transmission of Human Papilloma Virus (HPV) for cervical cancer prevention. | HPV infection rates, progression rates to/within cancer, regression rates from HPV and clearance rates, all-cause and cancer mortality rates. | Individual females enter the model at age 9, based on United States data. Model evaluation compared with large HPV screening studies. |
| (Sander et al., 2009) | Stochastic microsimulation transmission model: influenza pandemic mitigation strategies, targeted anti-viral prophylaxis. | Transmission parameters derived from literature on infections from symptomatic and asymptomatic infections. | People interacting in known contact groups, based on USA population. |
| (Degnan et al., 2009) | Bioterrorism through biological agents; that is bacteria, viruses or toxins (also a cost-effectiveness model). | Demographics, transport flows and trips, travel to emergency centres. | Baltimore MD metropolitan area, 951,000 people. |
| Table 2D | |||
| Selected cost-effectiveness models | Model type | Data sources | Sample sizes |
| (Barnighausen & Bloom, 2009) | Markov Monte Carlo model of cost-effectiveness of subSaharan African health care workers for treating HIV/AIDS. | Published literature on patient probabilities, and health education costs, salaries per year, and treatment costs per patient year. | Number of people in each sub-Saharan country who needed ART and did not receive it (UNAIDA/World Health Organisation data). |
| (Hiligsmann et al., 2009) | Markov model for cost-effectiveness of treating and preventing osteoporosis. | Fracture probabilities, mortality rates for each age-gender, fracture costs, interventions and utility values from published literature. | Not stated. |
| (Ahern et al., 2017) | Weight management trial cost-effectiveness. | Randomised Control Trial on weight loss interventions in a UK population. Assumptions about weight trajectories. | 1,269 participants, 18+ years old, BMI > 28 from England. |
| Table 2E | |||
| Selected cross portfolio models | Model type | Data sources | Sample sizes |
| (Percival et al., 2007) | STINMOD: A Static Income Model of tax and social security systems. | Survey Data (ABS, Australian Bureau of Statistics), Survey of Income and Housing data, tax and transfer payment rules. | Australian population, based on ABS data. |
| (Schofield et al., 2013) | Health&WealthMOD. Microsimulation of economic impacts of ill health. | Survey Data (ABS), Survey of Disability, Ageing and Carers, population and labour force growth data from Treasury, disease trends from Australian Burden of Disease Study, 2003. | Australian population aged 45–64 years in 2003 and 2009 SDAC surveys. |
| (Schofield, Shrestha, et al., 2017) | Health&WealthMOD. Microsimulation of economic impacts of ill health. Results estimated & projected to 2030. | Survey Data (ABS) Survey of Disability, Ageing and Carers, population and labour force growth data from Treasury, disease trends from Australian Burden of Disease Study, 2003. | Australian population aged 45–64 years in 2003 and 2009 SDAC surveys. |
| Table 2F | |||
| Selected health expenditure models | Model type | Data sources | Sample sizes |
| Intergeneration al reports, Australia (Schofield & Rothman, 2007) | Forecast health expenditure and other demographically sensitive expenditure over 40 years. | Australian Government Budget Papers, National Health Survey, The Australian Treasury Demographic Forecasts. | Microsimulation models based on Australian National Health Surveys ∼30,000 records. |
| Risk stratified colorectal cancer (Subramanian et al., 2017). | Assess the effectiveness, cost, and harms of risk stratified colorectal cancer screening. | National Health Interview Survey (NHIS) for risk of colorectal cancer, adjusted to ensure incidence is similar to those obtained from the Surveillance, Epidemiology, and End Results data (SEER). | Not described. |
| Table 2G | |||
| Diabetes models | Model type | Data sources | Sample sizes |
| Non-insulin-dependent diabetes mellitus (NIDDM), USA (Eastman et al., 1997) | Develop a model of NIDDM for analyzing prevention strategies for NIDDM. Predicts rates of microvascular complications, CVD and mortality to evaluate preventative interventions. | Large clinical trials and epidemiological studies. Risk of CVD was based on Framingham. | Not described. |
| DiabForcaster, UK (McEwan et al., 2006) | Determine the costs and outcomes associated with modifiable risk factors in patients with type 2 diabetes. | Utility: Health Outcomes Data Repository (HODaR), UK 2001–2003 gender-specific interim life tables. Eastman diabetes model. | 10,000 diabetic patients |
| UKPDS Outcomes Model (UKPDS-OM), UK (Clarke et al., 2004) | A diabetes model used for estimating the likelihood of major diabetes-related complications over a lifetime for health economic analysis. | United Kingdom Prospective Diabetes Study (UKPDS). | 3,642 patients. |
| UKPDS Outcomes Model 2 (UKPDS-OM2), UK (Hayes et al., 2013) | Revised version of UKPDS- OM, with updated risk, mortality, and new events algorithms, and the use of new risk factors. | UKPDS. | 5,102 patients. |
| ECHO, Sweden (Willis et al., 2013) | Simulate costs and health outcomes and the cost-effectiveness of type 2 diabetes treatments. | Macrovascular risk equations: UKPDS68, UKPDS82, ADVANCE, and the Swedish National Diabetes Registry. | Not described. |
| CORE, Swiss & US (Palmer et al., 2004) | To determine the long term health and economic outcomes of diabetes treatments. | Framingham, UKPDS risk engine and outcome model, Diabetes Control and Complications Trial (DCCT), and other published sources. | Not described. |
| MICADO, Netherlands (van der Heijden et al., 2015) | Estimate the long term cost-effectiveness of interventions in people with and without diabetes. | Dutch general practice registry data. | 498,400 diabetes patients |
| Michigan Model for Diabetes (MMD), USA (Zhou et al., 2005) | Assess the impact of screening, prevention and treatment strategies on type 2 diabetes and its complications, comorbidities, quality of life, and cost. | Wisconsin Epidemiologic Study of Diabetic Retinopathy (WESDR) type 2 diabetes cohort. Published literatures. | 1,370 patients. |
| Diabetes model, Australia (Walker & Colagiuri, 2011) | Modelling diabetes and its health system costs. | National Health Survey, AUSDIAB. | 30,000 patients. |
| (Bertram et al., 2010), Australia | Evaluate the cost-effectiveness of a screening programme and follow up interventions for pre-diabetes. | AUSDIAB. | 8,000 people. |
| HealthAgeing MOD, Australia, (Bertram et al., 2010) | Cost-benefit model system of chronic diseases to assess and rank prevention and treatment options. Designed to use standard cost-benefit and cost-effectiveness methods to assess the impact of a series of simulated policy options | National Health Survey 2005 Survey of Disability, Ageing and Carers 2003 | 25,906 people. |
| NCDMod, Australia (Lymer et al., 2016) | Simulate population level impacts of interventions to prevent/delay chronic health conditions, particularly diabetes, heart disease and obesity. | National Health Survey 2005, AUSDIAB, AUSDRISK, HealthAgeingMOD, Australian Health Survey 2011. | Australian population (∼17 million people) |
| POHEM-CVD, Canada (Manuel et al., 2014) | Models health, health risk factors and health costs. | Canadian Community Health Survey (CCHS). | 105,908 people. |
| POHEM-BMI, Canada (Hennessy et al., 2017) | Simulate using BMI to predict rates of overweight and obesity in the Canadian population | National Population Health Survey, the Canadian Community Health Survey (CCHS), and the Canadian Health Measures Survey (CHMS). | 5, 000 people. |
| Table 2H | |||
| Selected mortality models | Model type | Data sources | Sample sizes |
| Productivity colorectal cancer, USA (Bradley et al., 2011) | Estimating lost productivity from mortality due to colorectal cancer. A semi- Markov microsimulation model from CISNET. | National Cancer Institute's (NCI) Cancer Intervention and Surveillance Modeling Network (CISNET), MISCAN-Colon, National Health Interview Survey. | USA population based on MISCAN-Colon, and life tables from the 2000 US Life Table, from National Centre for Health Statistics; 48,748 people. |
| LifeLossMOD, Australia (Carter et al., 2016, 2017) | Dynamic microsimulation model from NATSEM. Modelling productivity impacts of premature mortality from cancer. | 2003 mortality dataset and the APPSIM microsimulation model, projections from 2003 to 2030. | APPSIM uses a 1% sample of the Australian population. Mortality data is sourced from 129,513 individual mortality records, of all registered deaths in Australia in 2003, from the 2003 Australian Burden of Disease Study. |
| (van Luijt et al., 2017), Norway | Estimate the breast cancer mortality reduction due to screening and the cost-effectiveness of screening programme. | NORDCAN, MISCAN, 2005 Life table from Statistics Norway, Cancer Registry of Norway. | 10,000,000 people. |
Download links
A two-part list of links to download the article, or parts of the article, in various formats.