Understanding low female labour force participation: Policy evaluation using microsimulation
- Institute for New Economic Thinking at the Oxford Martin School, United Kingdom
- Universita’ di Torino, and LABORatorio Revelli, Italy
- Institute for Social and Economic Research, United Kingdom
Cite this article
as: R. Richardson, L. Pacelli, M. Richiardi; 2019; Understanding low female labour force participation: Policy evaluation using microsimulation; International Journal of Microsimulation; 12(2); 52-68.
doi: 10.34196/ijm.00201
Figures
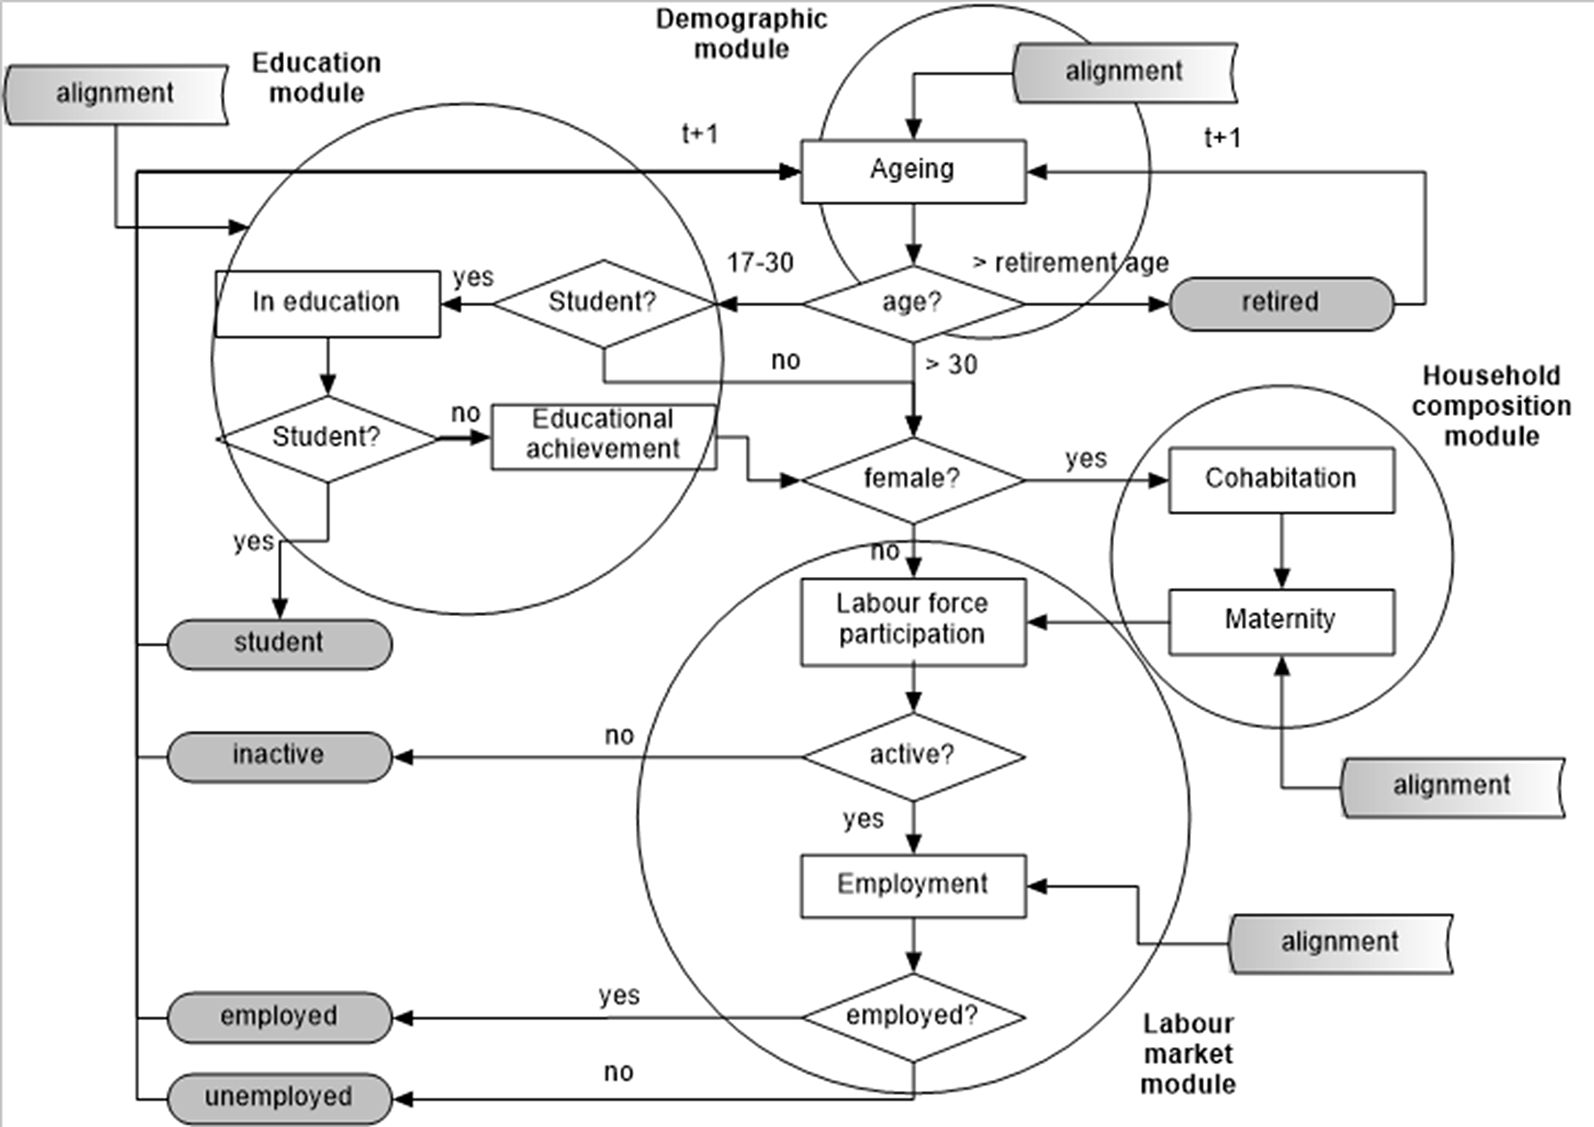
Figure 1

Model structure
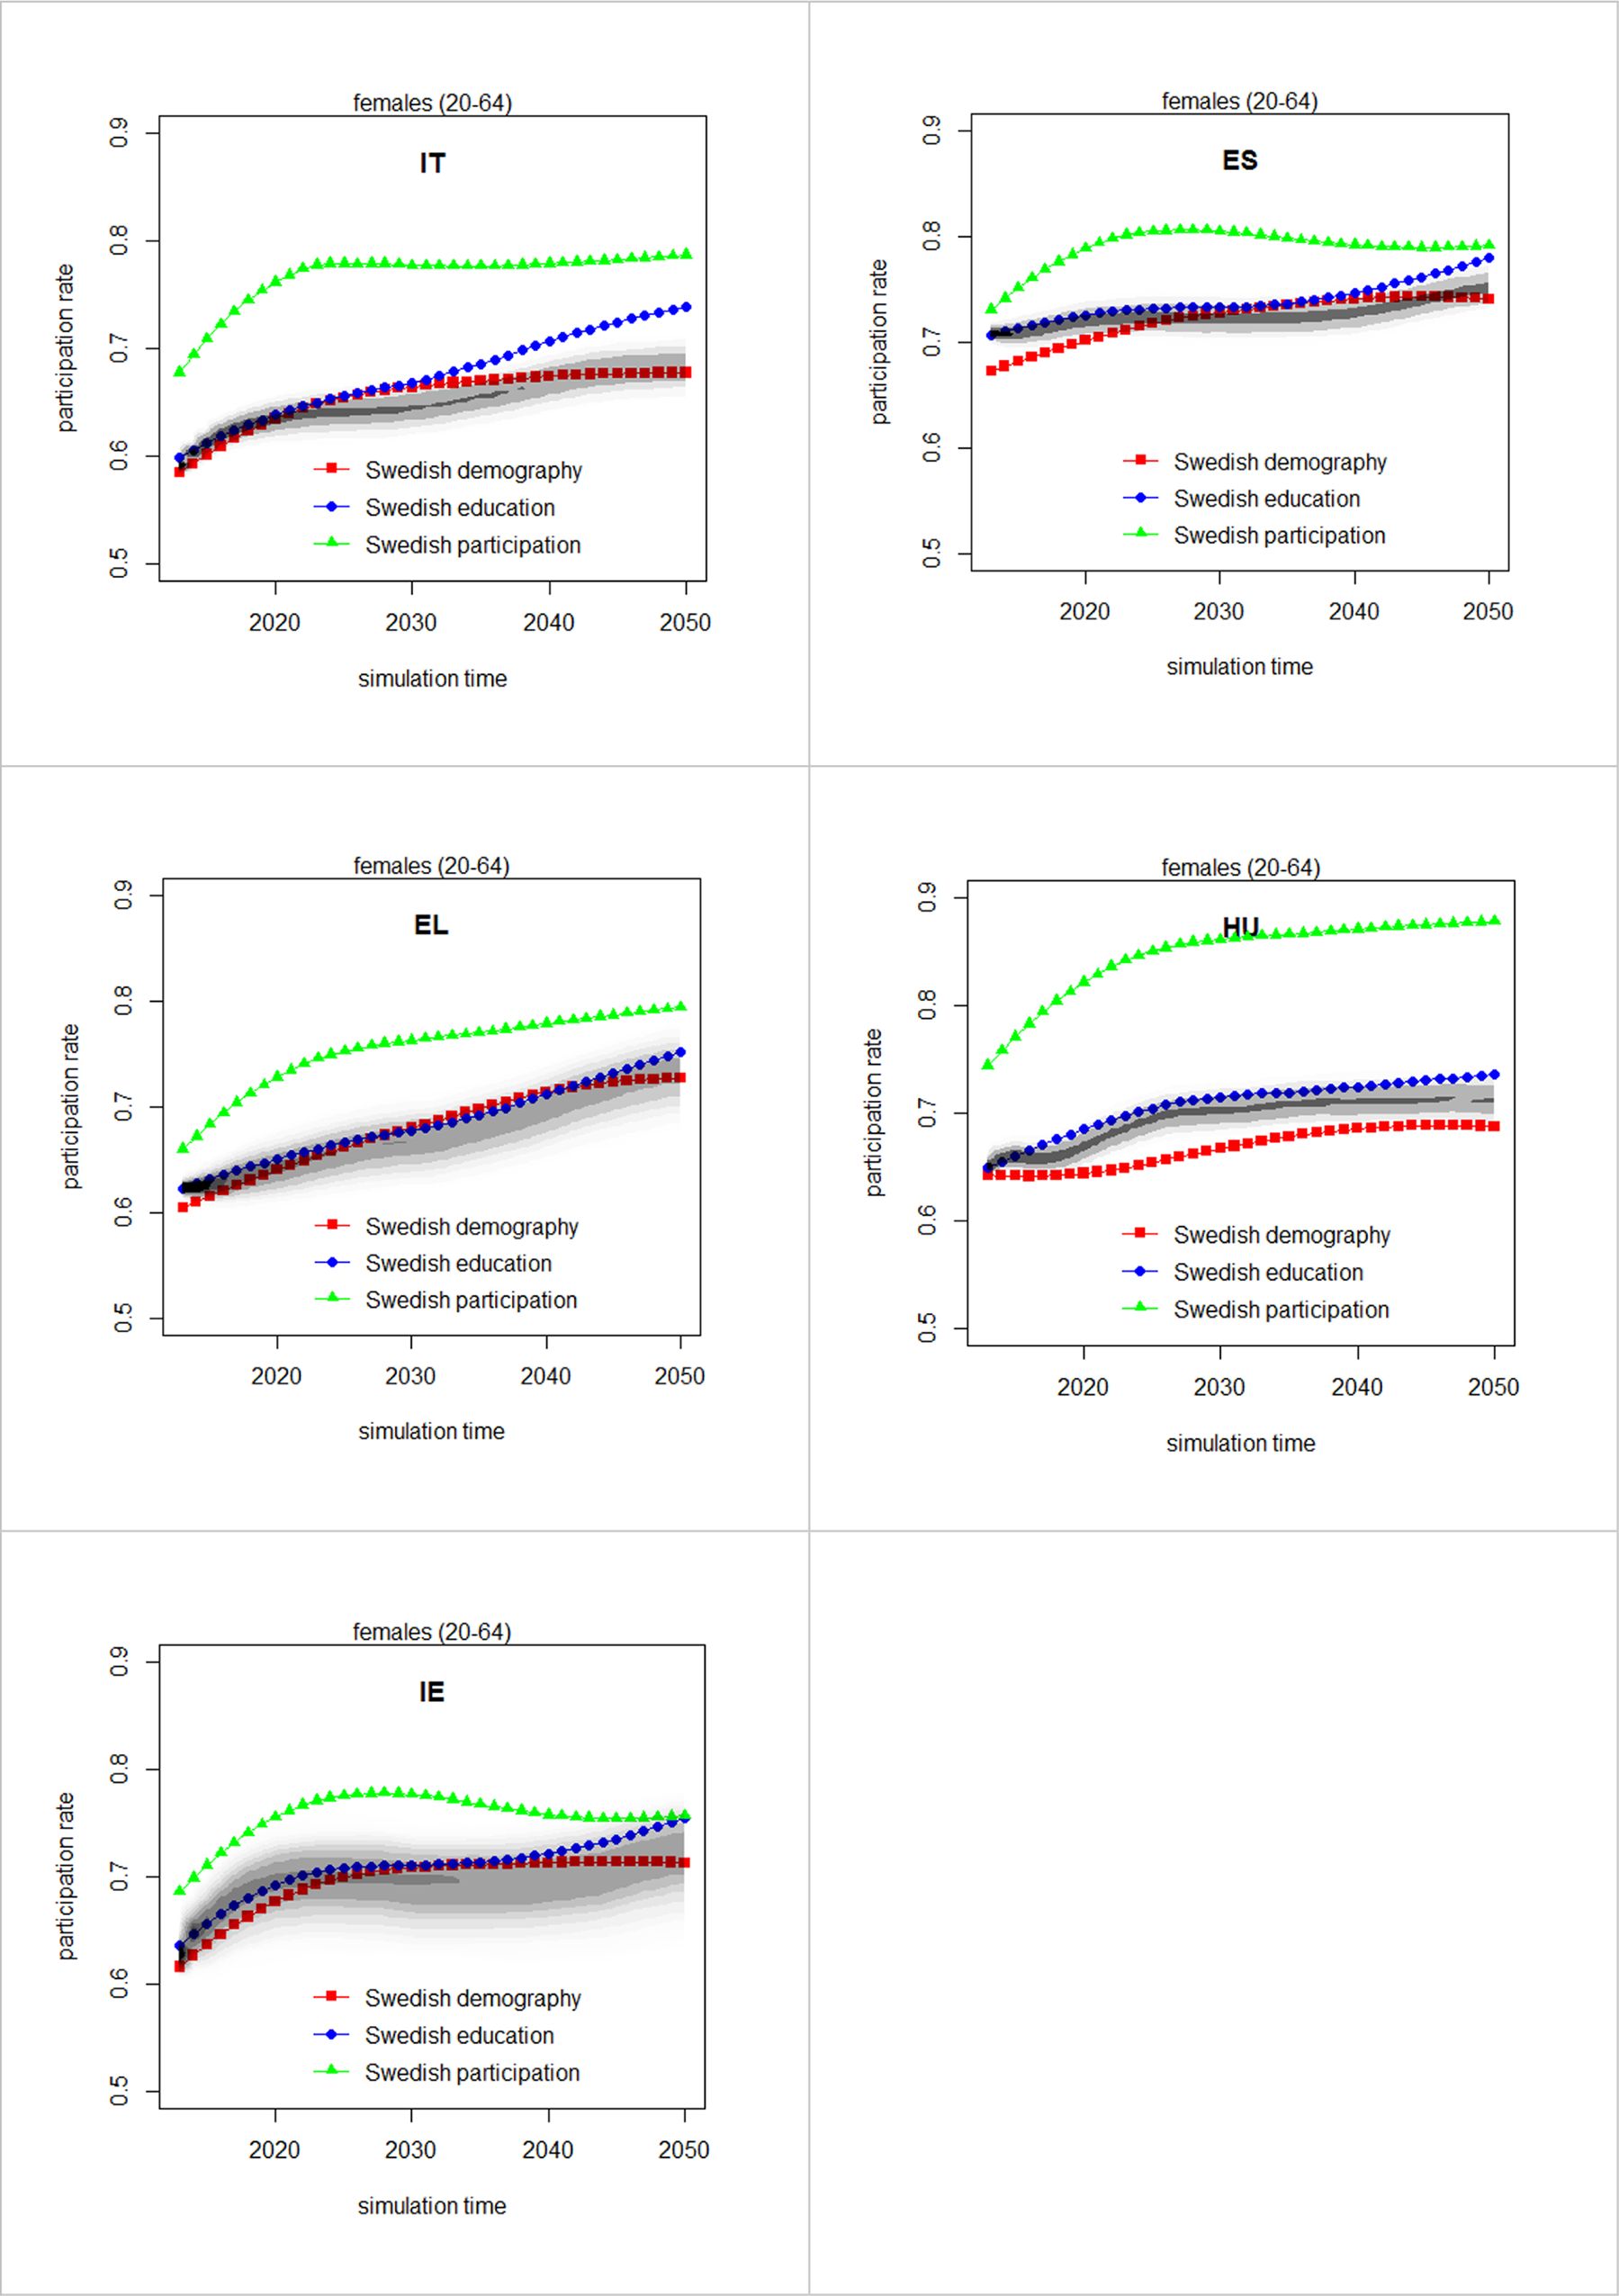
Figure 2

Participation rates in the baseline drivers scenarios, female population aged 20–64 years. The shaded areas are the estimated densities of the baseline projections, computed over 1,000 replications with bootstrapped values of the coefficients.
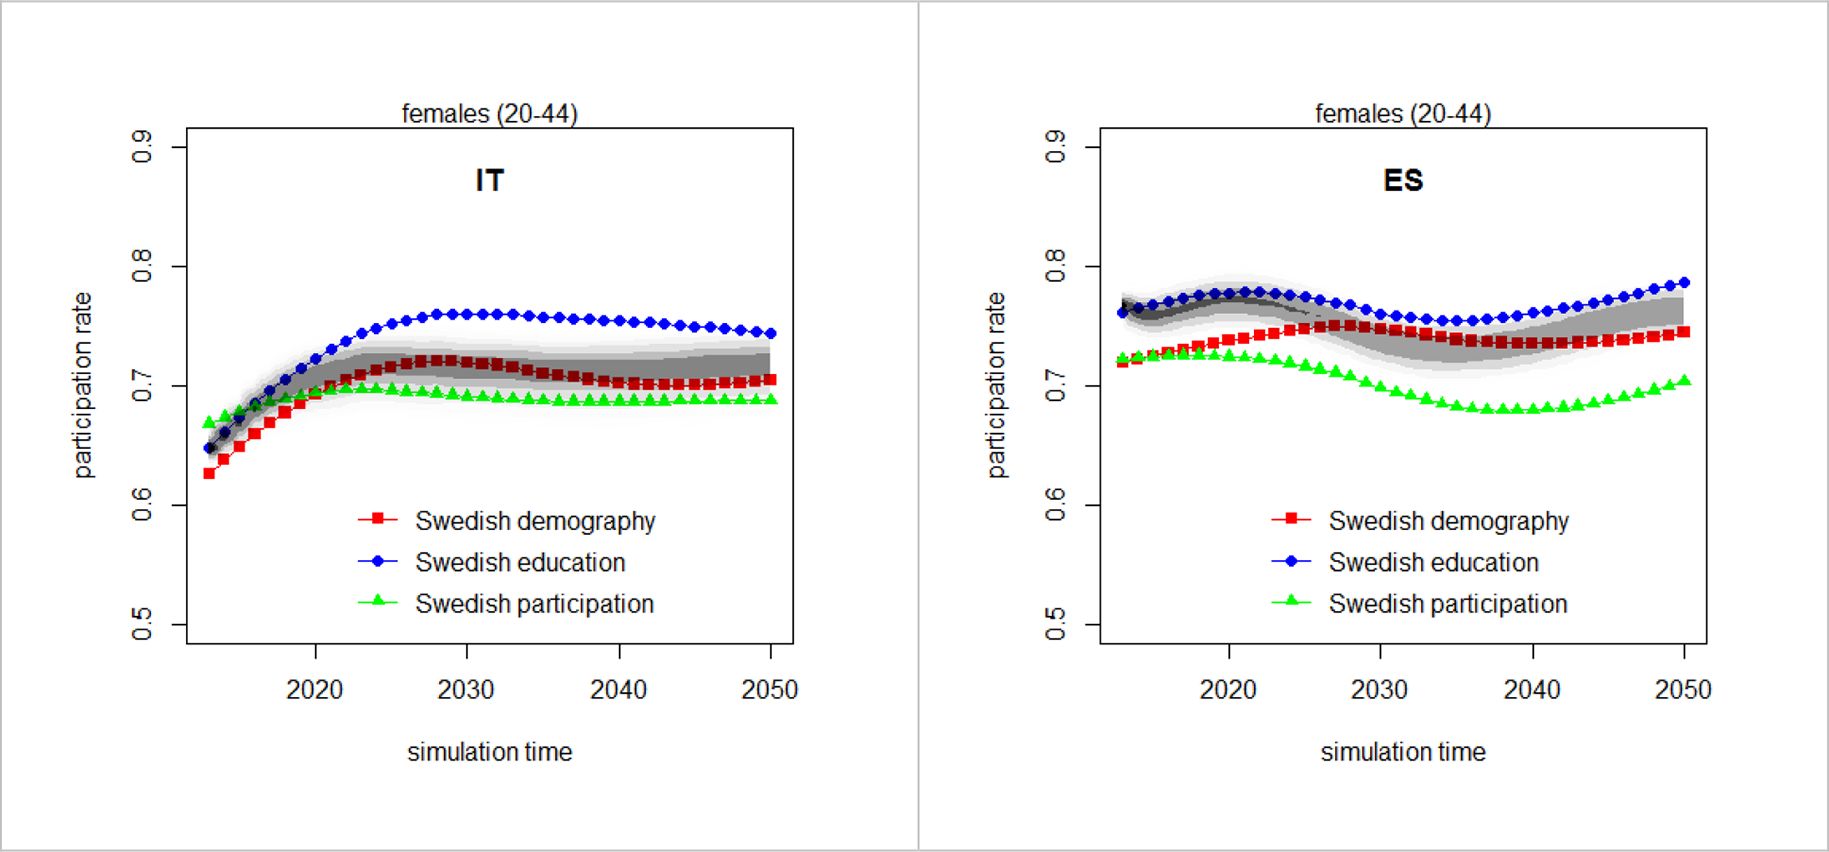
Figure 3

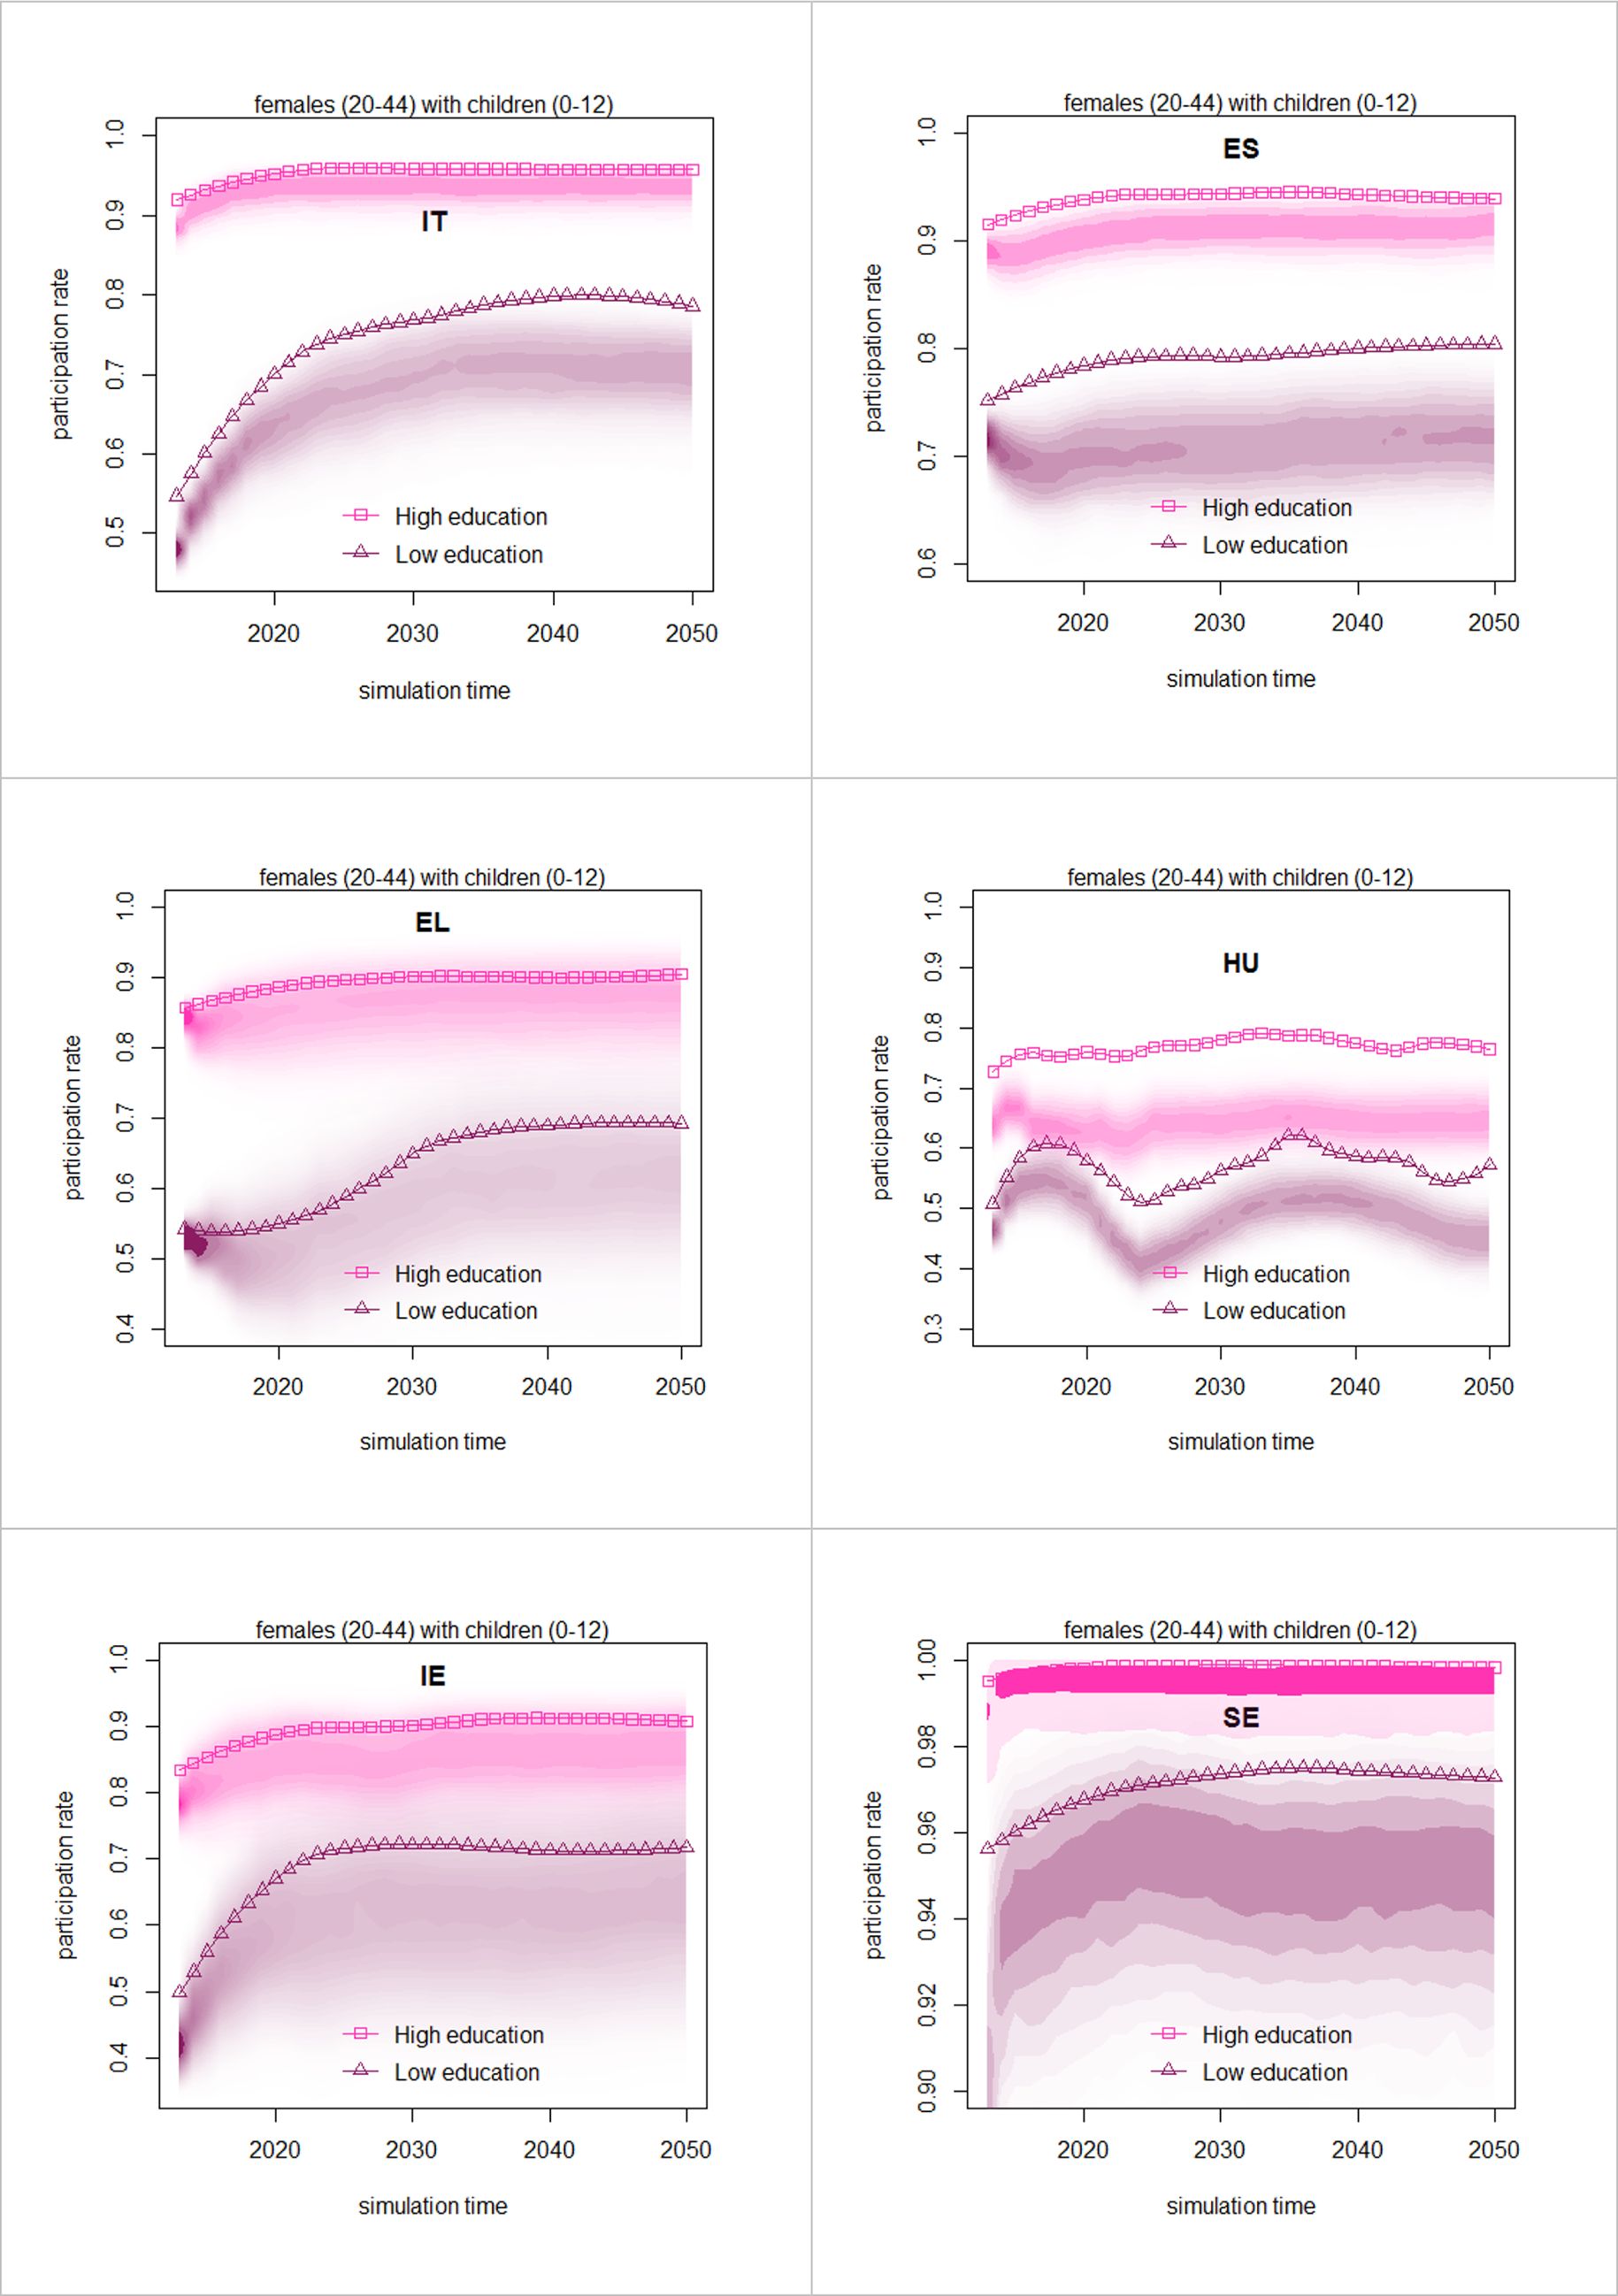
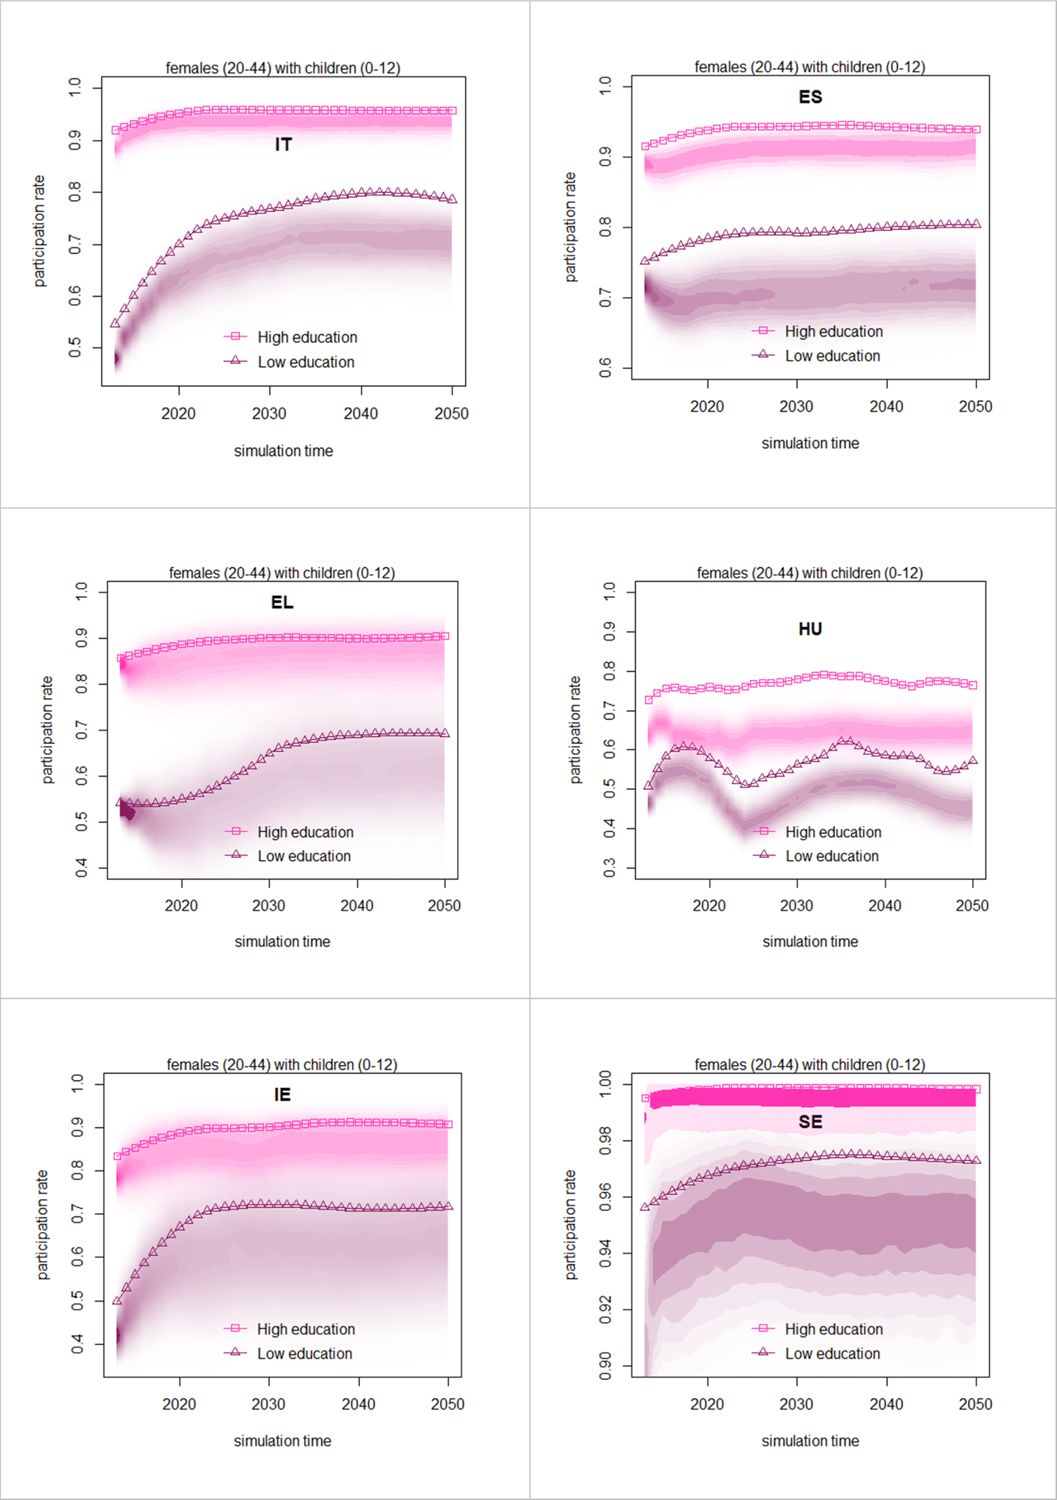
Participation rates in the baseline drivers scenarios, female population aged 20–44 years. The shaded areas are the estimated densities of the baseline projections, computed over 1,000 replications with bootstrapped values of the coefficients.
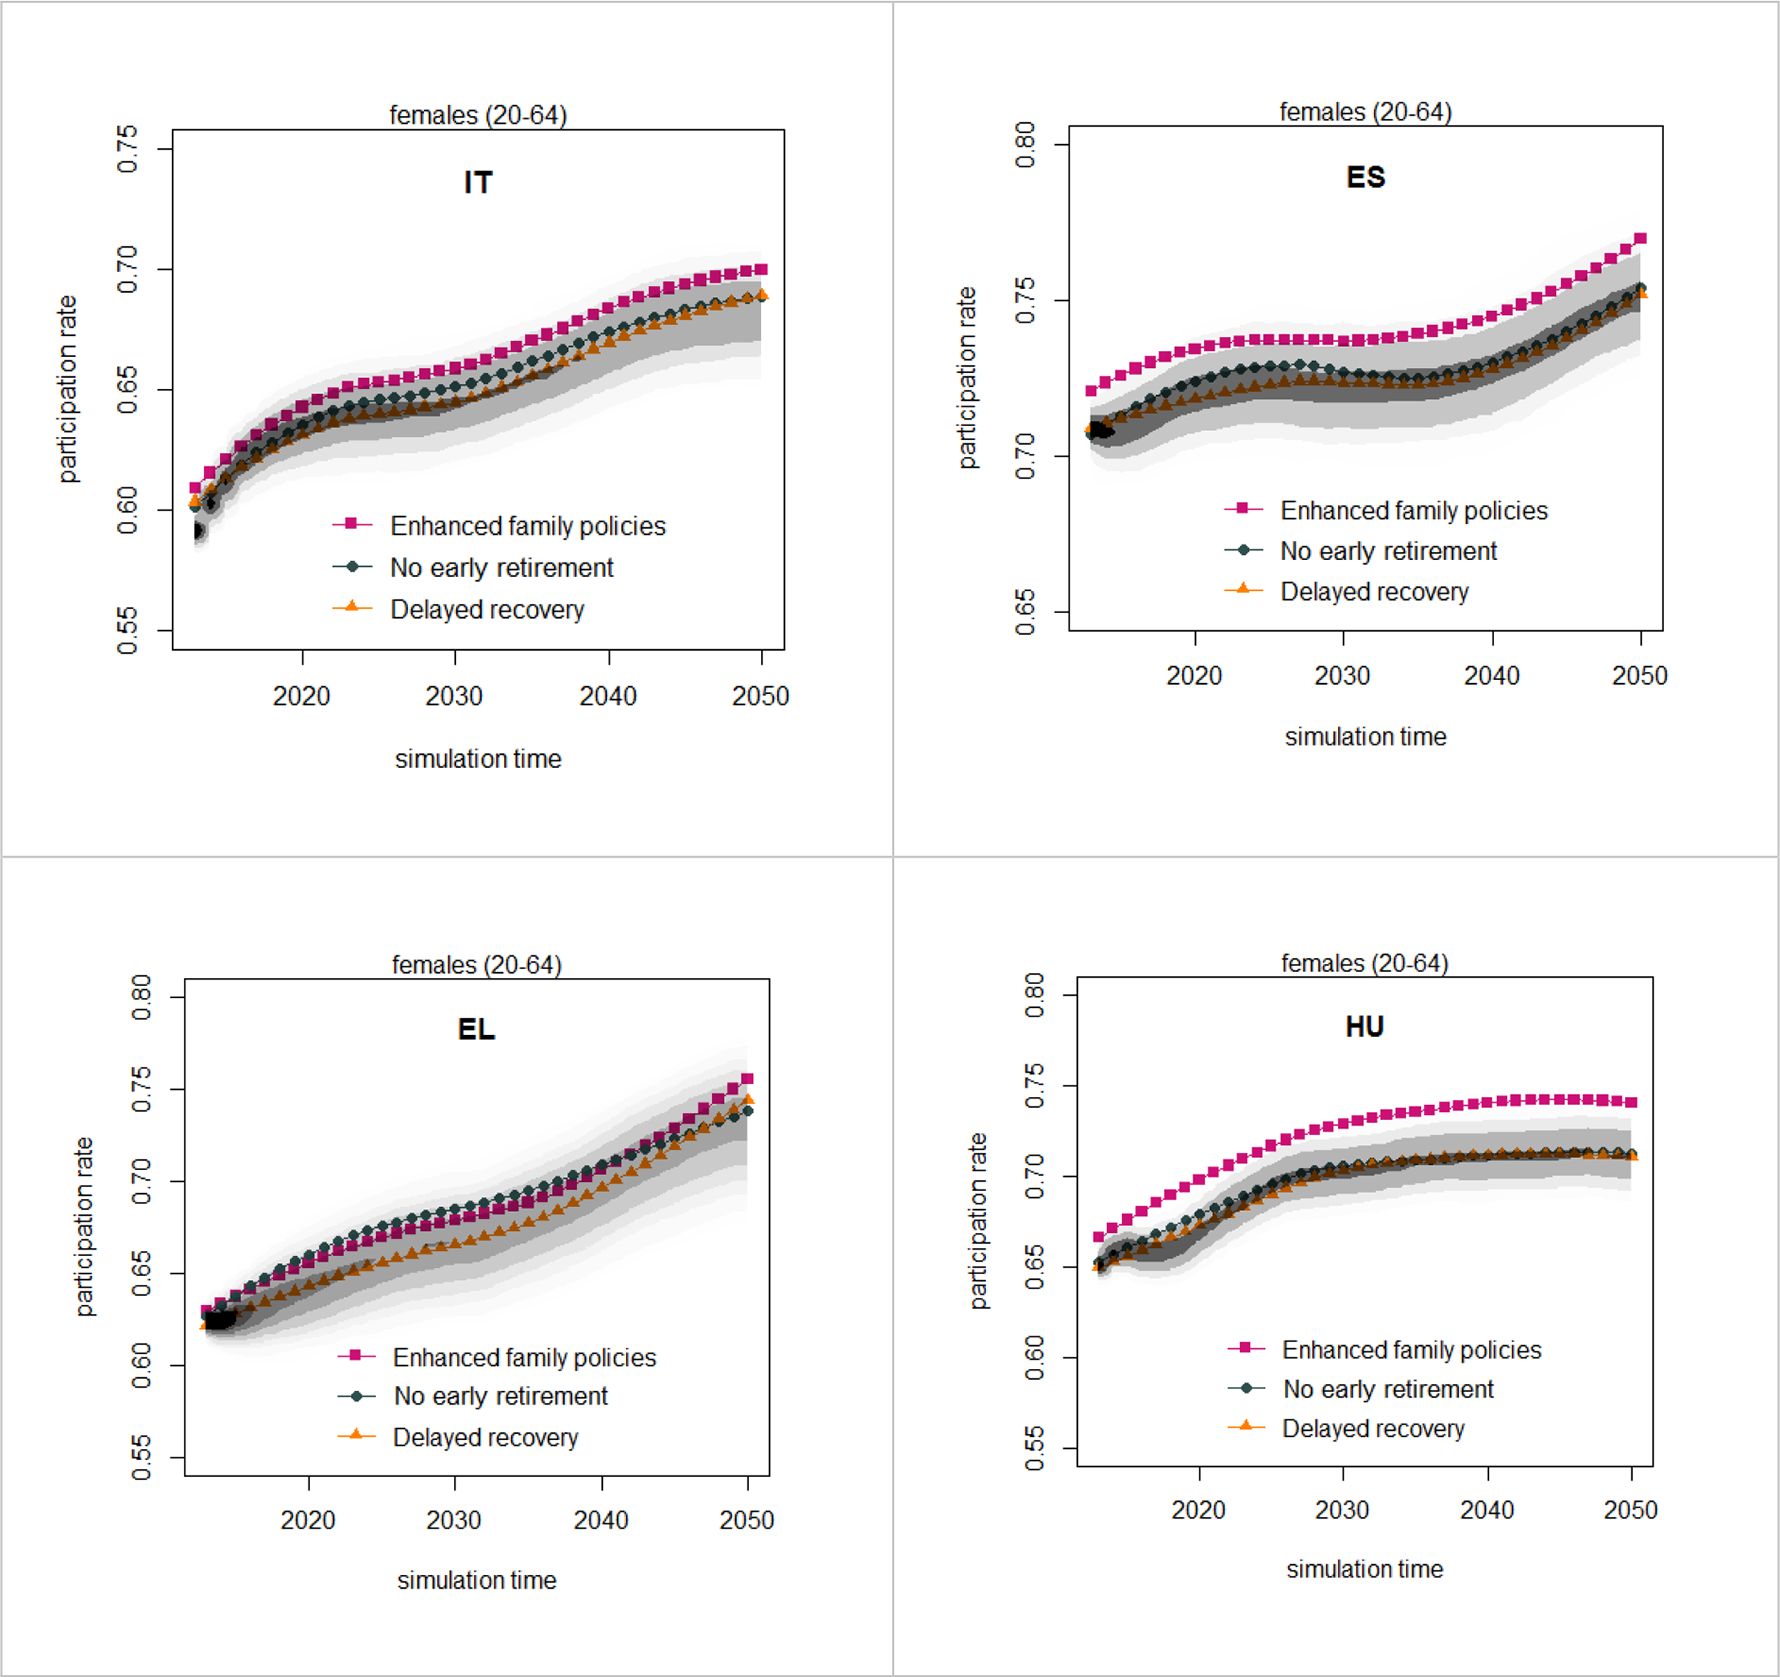
Figure 4

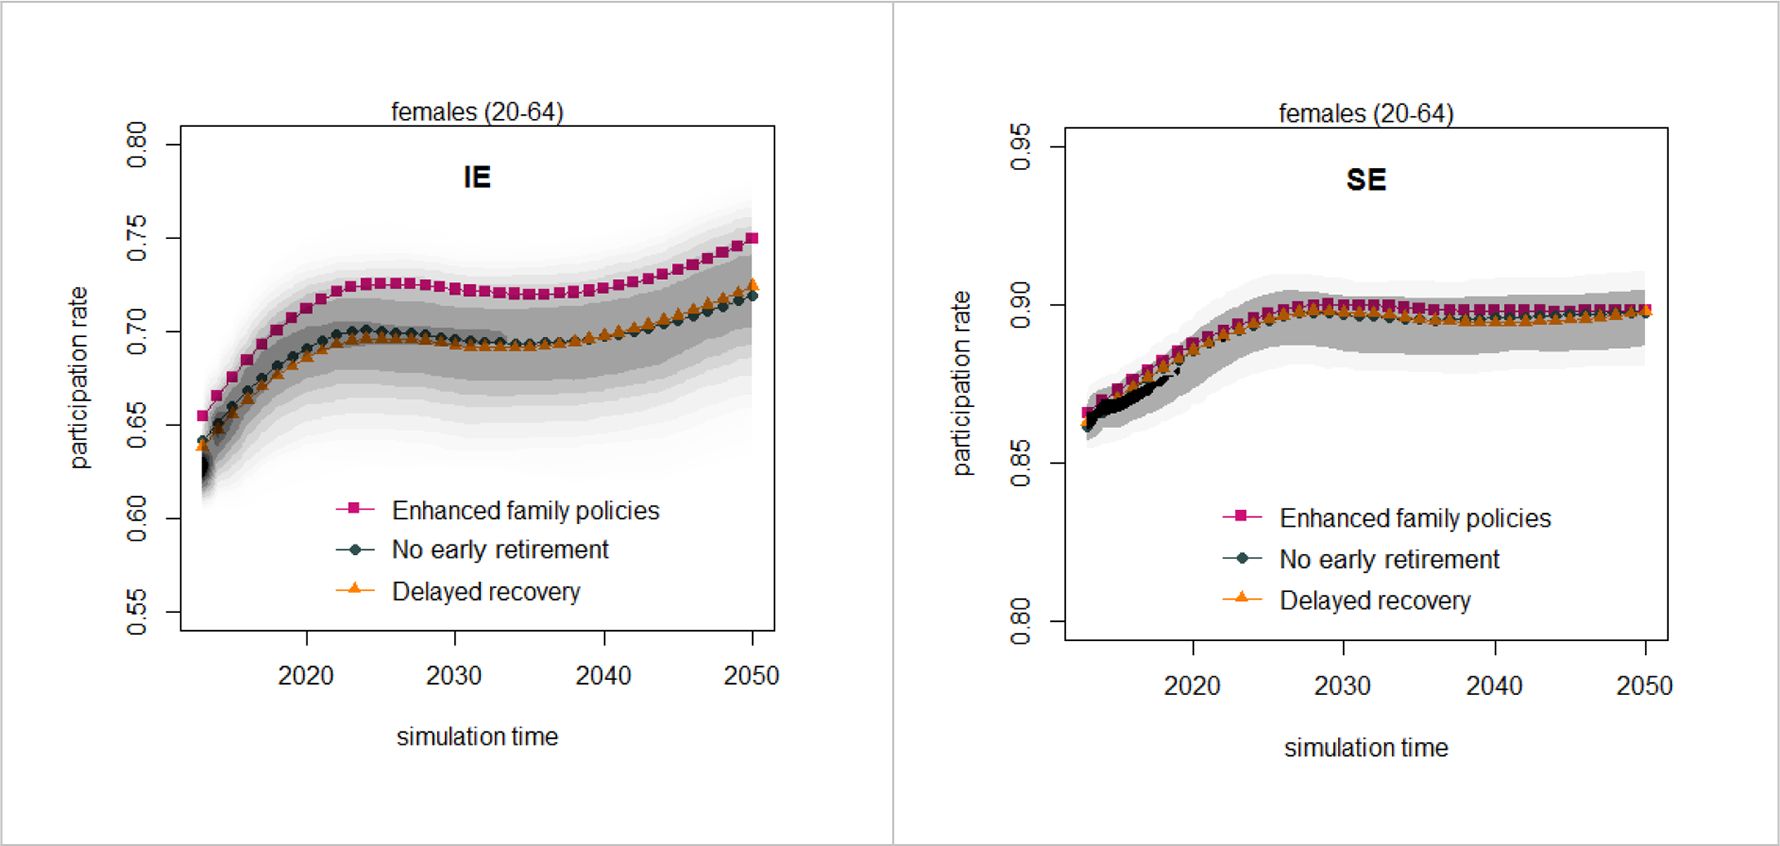
Participation rates in the policy actions scenarios, female population aged 20–64 years. The shaded areas are the estimated densities of the baseline projections, computed over 1,000 replications with bootstrapped values of the coefficients.
Figure 5

Enhanced family policies scenario: public childcare benefits, duration of maternity leave and availability of part-time employment are jointly increased by 20%. Participation rates by educational attainments, female population aged 20–44 years not in education. The shaded areas are the estimated densities of the baseline projections, computed over 1,000 replications with bootstrapped values of the coefficients.
Figure 6

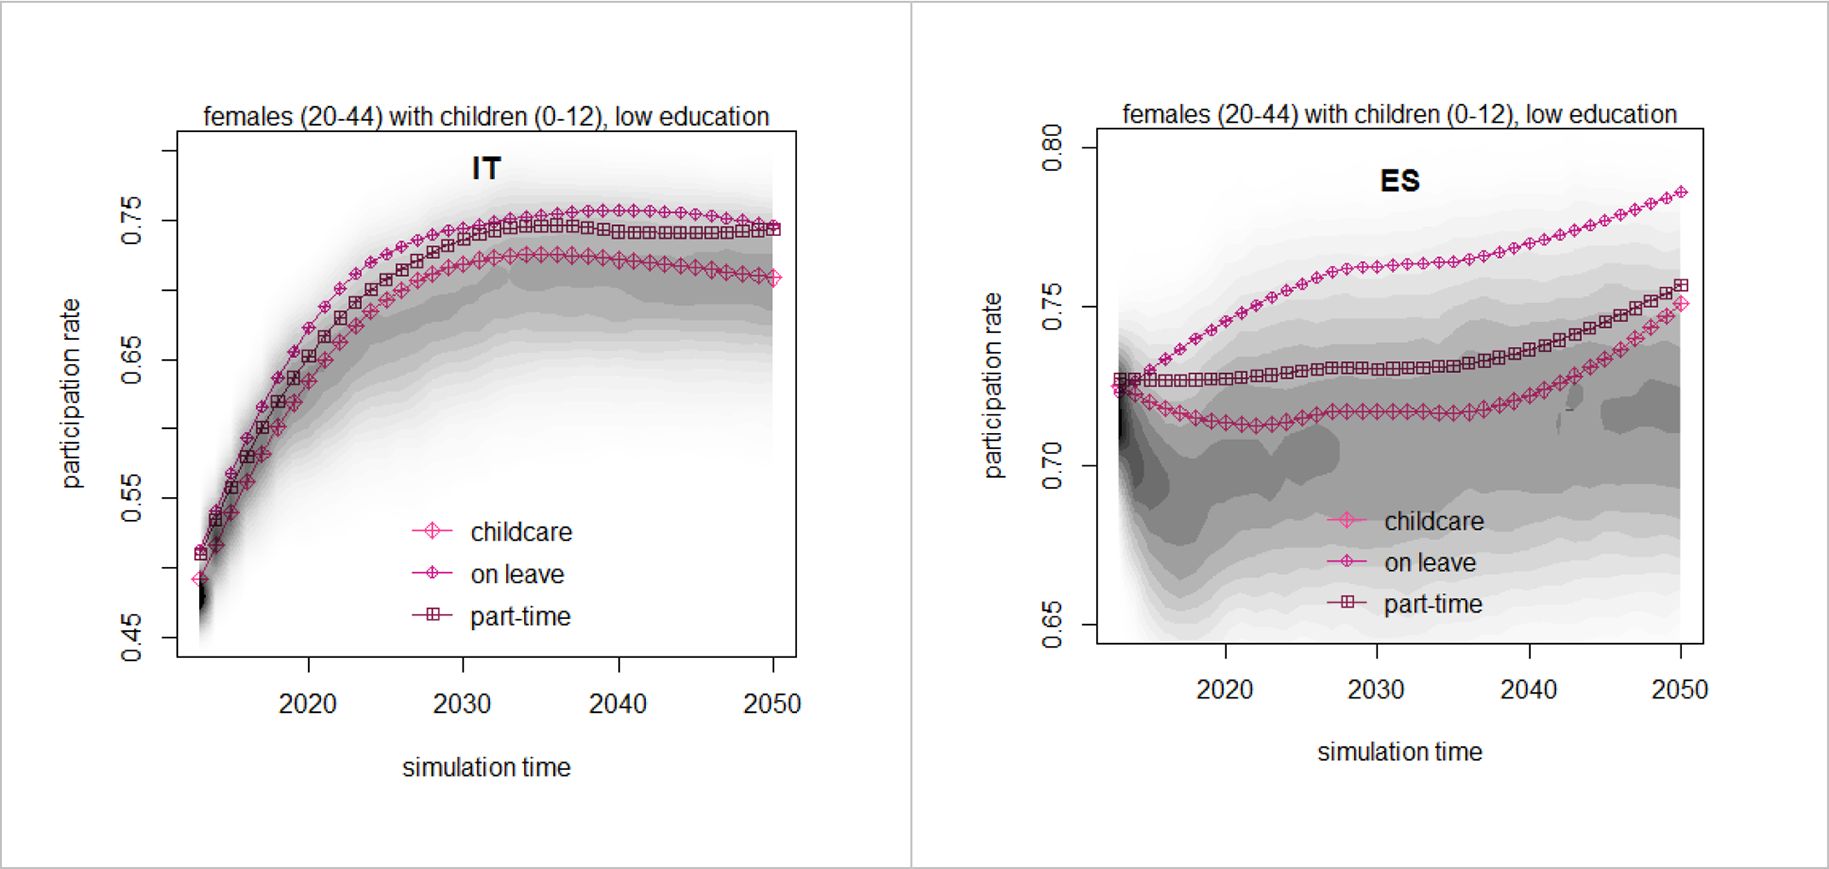
Decomposition of the Enhanced family policies scenario: public childcare benefits, duration of maternity leave and availability of part-time employment are separately increased by 20%. Participation rates, female population aged 20–44 years with children aged 0–12 years and low education. The shaded areas are the estimated densities of the baseline projections, computed over 1,000 replications with bootstrapped values of the coefficients.
Figure 7
No early retirement scenario: minimum effective retirement age is 60 years old. Employment rates, differential to baseline, population aged 50–59 years.
Figure 8

Delayed recovery scenario: the effects of the Great Recession fade away at a slower pace; complete recovery is achieved 10 years later than in the baseline (so 2040 in Greece and 2030 in other countries). Employment rates, differential to baseline, population aged 20–64.
Tables
Table 1
Determinants of the estimated processes at an individual level. Determinants annotated with (t-1) symbolise that the one-period (one year) lag is used
| Outcome | Determinants |
|---|---|
| Student | age, gender, region |
| Education | age, gender, region |
| Consensual union (female only) | age, student(t-1), education, participation(t-1), cohabitation(t-1), children(t-1), region, retired(t-1) |
| Maternity (female only) | age, student(t-1), education, participation(t-1), cohabitation(t-1), children(t-1), region, fertility rate, public childcare, maternity benefits, part-time rate |
| Participation: women with children aged 0–3 inclusive | age, student(t-1), education, participation(t-1), cohabitation(t-1), region, public childcare, maternity benefits, part-time rate, post-crisis dummy |
| Participation: women with children aged 4–12 inclusive | age, student(t-1), education, participation(t-1), cohabitation(t-1), region, part-time rate, post-crisis dummy |
| Participation: women without children aged 0–12 inclusive | age, student(t-1), education, participation(t-1), cohabitation(t-1), region, post-crisis dummy |
| Participation: men | age, student(t-1), education, participation(t-1), region, post-crisis dummy |
| Employment | age, gender, student(t-1), education, participation(t-1), unemployment rate, region, post-crisis dummy |
Table 2
Projected old-age dependency ratio, baseline scenario
| Old-age dependency rates (%) | |||||
|---|---|---|---|---|---|
| Year | 2015 | 2020 | 2030 | 2040 | 2050 |
| Ireland | 19.8 | 23.2 | 30.3 | 38.6 | 44.8 |
| Hungary | 26.4 | 30.5 | 34.4 | 39.8 | 47.3 |
| Spain | 27.8 | 30.4 | 39.6 | 53.5 | 62.5 |
| Sweden | 31.2 | 33.0 | 35.5 | 37.4 | 37.5 |
| Greece | 31.9 | 34.3 | 41.2 | 53.2 | 63.6 |
| Italy | 33.3 | 34.9 | 40.8 | 49.9 | 52.9 |
-
Source: Eurostat – Population Projections EUROPOP2013.
Table 3
Share of people aged 18–65 years with high (ISCED level 3) and low (ISCED level 1) education, base year
| High education (%) | Low education (%) | |||
|---|---|---|---|---|
| Females | Males | Females | Males | |
| Italy | 16.8 | 13.5 | 37.3 | 38.9 |
| Hungary | 21.6 | 15.1 | 24.8 | 21.2 |
| Greece | 22.8 | 20.8 | 35.6 | 34.2 |
| Spain | 30.4 | 26.6 | 44.7 | 48.8 |
| Ireland | 33.0 | 35.3 | 29.1 | 34.2 |
| Sweden | 38.4 | 26.5 | 13.6 | 17.0 |
Table 4
Assumptions concerning the mean and standard deviation of retirement age (prior to imposing the minimum retirement age constraint)
| Mean retirement age | Std. deviation | |||||||
|---|---|---|---|---|---|---|---|---|
| Year | 2015 | 2030 | 2050 | |||||
| Males | Females | Males | Females | Males | Females | Males | Females | |
| Hungary | 61.1 | 61.8 | 64.9 | 65.3 | 70.0 | 70.0 | 5.1 | 4.1 |
| Greece | 62.8 | 60.0 | 65.9 | 64.3 | 70.0 | 70.0 | 5.8 | 6.2 |
| Spain | 63.3 | 63.8 | 66.2 | 66.5 | 70.0 | 70.0 | 4.7 | 4.5 |
| Italy | 64.0 | 65.9 | 66.6 | 67.7 | 70.0 | 70.0 | 6.5 | 6.6 |
| Ireland | 65.8 | 63.1 | 67.6 | 66.0 | 70.0 | 70.0 | 3.5 | 4.5 |
| Sweden | 66.6 | 65.8 | 68.0 | 67.6 | 70.0 | 70.0 | 3.4 | 3.8 |
Table 5
Family-policies related parameters, baseline scenario
| On leave benefits | Public childcare expenditures per child | Part-time | ||||
|---|---|---|---|---|---|---|
| Age of child | ||||||
| 0 | 1 | 2 | 3 | |||
| # weeks | 2009 US$ PPP | % | ||||
| Greece (EL) | 15 | 154 | 293 | 432 | 571 | 7.6 |
| Spain (ES) | 24 | 129 | 1,561 | 2,996 | 4,431 | 12 |
| Hungary (HU) | 74 | 48 | 78 | 108 | 3,045 | 3.9 |
| Ireland (IE) | 12.4 | 0 | 0 | 0 | 9,384 | 20.2 |
| Italy (IT) | 25 | 1,017 | 2,043 | 3,540 | 5,286 | 15.3 |
| Sweden (SE) | 74 | 1,541 | 2,586 | 3,630 | 9,042 | 24.4 |
-
Source: OECD Family Database.
Table 6
Participation rates and participation gaps with respect to Sweden, female population aged 20–64 years, baseline scenario
| Females (20–64 years old) | |||||
|---|---|---|---|---|---|
| Year | 2013 | 2020 | 2030 | 2040 | 2050 |
| Participation rates (%) | |||||
| Sweden | 86.4 | 88.3 | 89.6 | 89.4 | 89.7 |
| Spain | 70.9 | 72.3 | 71.8 | 73.3 | 75.5 |
| Hungary | 65.1 | 66.8 | 70.2 | 71.3 | 71.3 |
| Ireland | 62.8 | 69.5 | 69.6 | 69.6 | 72 |
| Greece | 62.4 | 64.1 | 67.1 | 70 | 73 |
| Italy | 59.0 | 63.3 | 64.7 | 67 | 68.8 |
| Participation gap w.r.t. Sweden (%) | |||||
| Spain | 15.5 | 16.0 | 17.8 | 16.1 | 14.2 |
| Hungary | 21.3 | 21.5 | 19.4 | 18.1 | 18.4 |
| Ireland | 23.6 | 18.8 | 20.0 | 19.8 | 17.7 |
| Greece | 24.0 | 24.2 | 22.5 | 19.4 | 16.7 |
| Italy | 27.4 | 25.0 | 24.9 | 22.4 | 20.9 |
Table 7
Participation rates and participation gaps with respect to Sweden, female population aged 20–44 years, baseline scenario
| Females (20–44 years old) | |||||
|---|---|---|---|---|---|
| Year | 2013 | 2020 | 2030 | 2040 | 2050 |
| Participation rates (%) | |||||
| Sweden | 84.2 | 84.6 | 86.1 | 85.1 | 85.6 |
| Spain | 76.8 | 77.5 | 73.8 | 74.5 | 76.5 |
| Hungary | 71.7 | 73.7 | 74.3 | 74.1 | 74.6 |
| Ireland | 68.1 | 74.4 | 69.3 | 68.9 | 73.6 |
| Greece | 66.2 | 64.1 | 63.3 | 62.7 | 62.1 |
| Italy | 64.7 | 70.8 | 71.2 | 71.1 | 72.1 |
| Participation gap w.r.t. Sweden (%) | |||||
| Spain | 9.6 | 10.8 | 15.8 | 14.9 | 13.2 |
| Hungary | 14.7 | 14.6 | 15.3 | 15.3 | 15.1 |
| Ireland | 18.3 | 13.9 | 20.3 | 20.5 | 16.1 |
| Greece | 20.2 | 24.2 | 26.3 | 26.7 | 27.6 |
| Italy | 21.7 | 17.5 | 18.4 | 18.3 | 17.6 |
Data and code availability
EU-SILC data is available to all researchers upon request to Eurostat. OECD data from the Family database is publicly available from the OECD website.
The microsimulation model is open source. Code and documentation is available from http://www.jas-mine.net/demo/labour-force-participation.
Download links
A two-part list of links to download the article, or parts of the article, in various formats.