A Dynamic Microsimulation Model for Ageing and Health in England: The English Future Elderly Model
- The University of Leeds, UK
- University of Southern California, USA
Figures

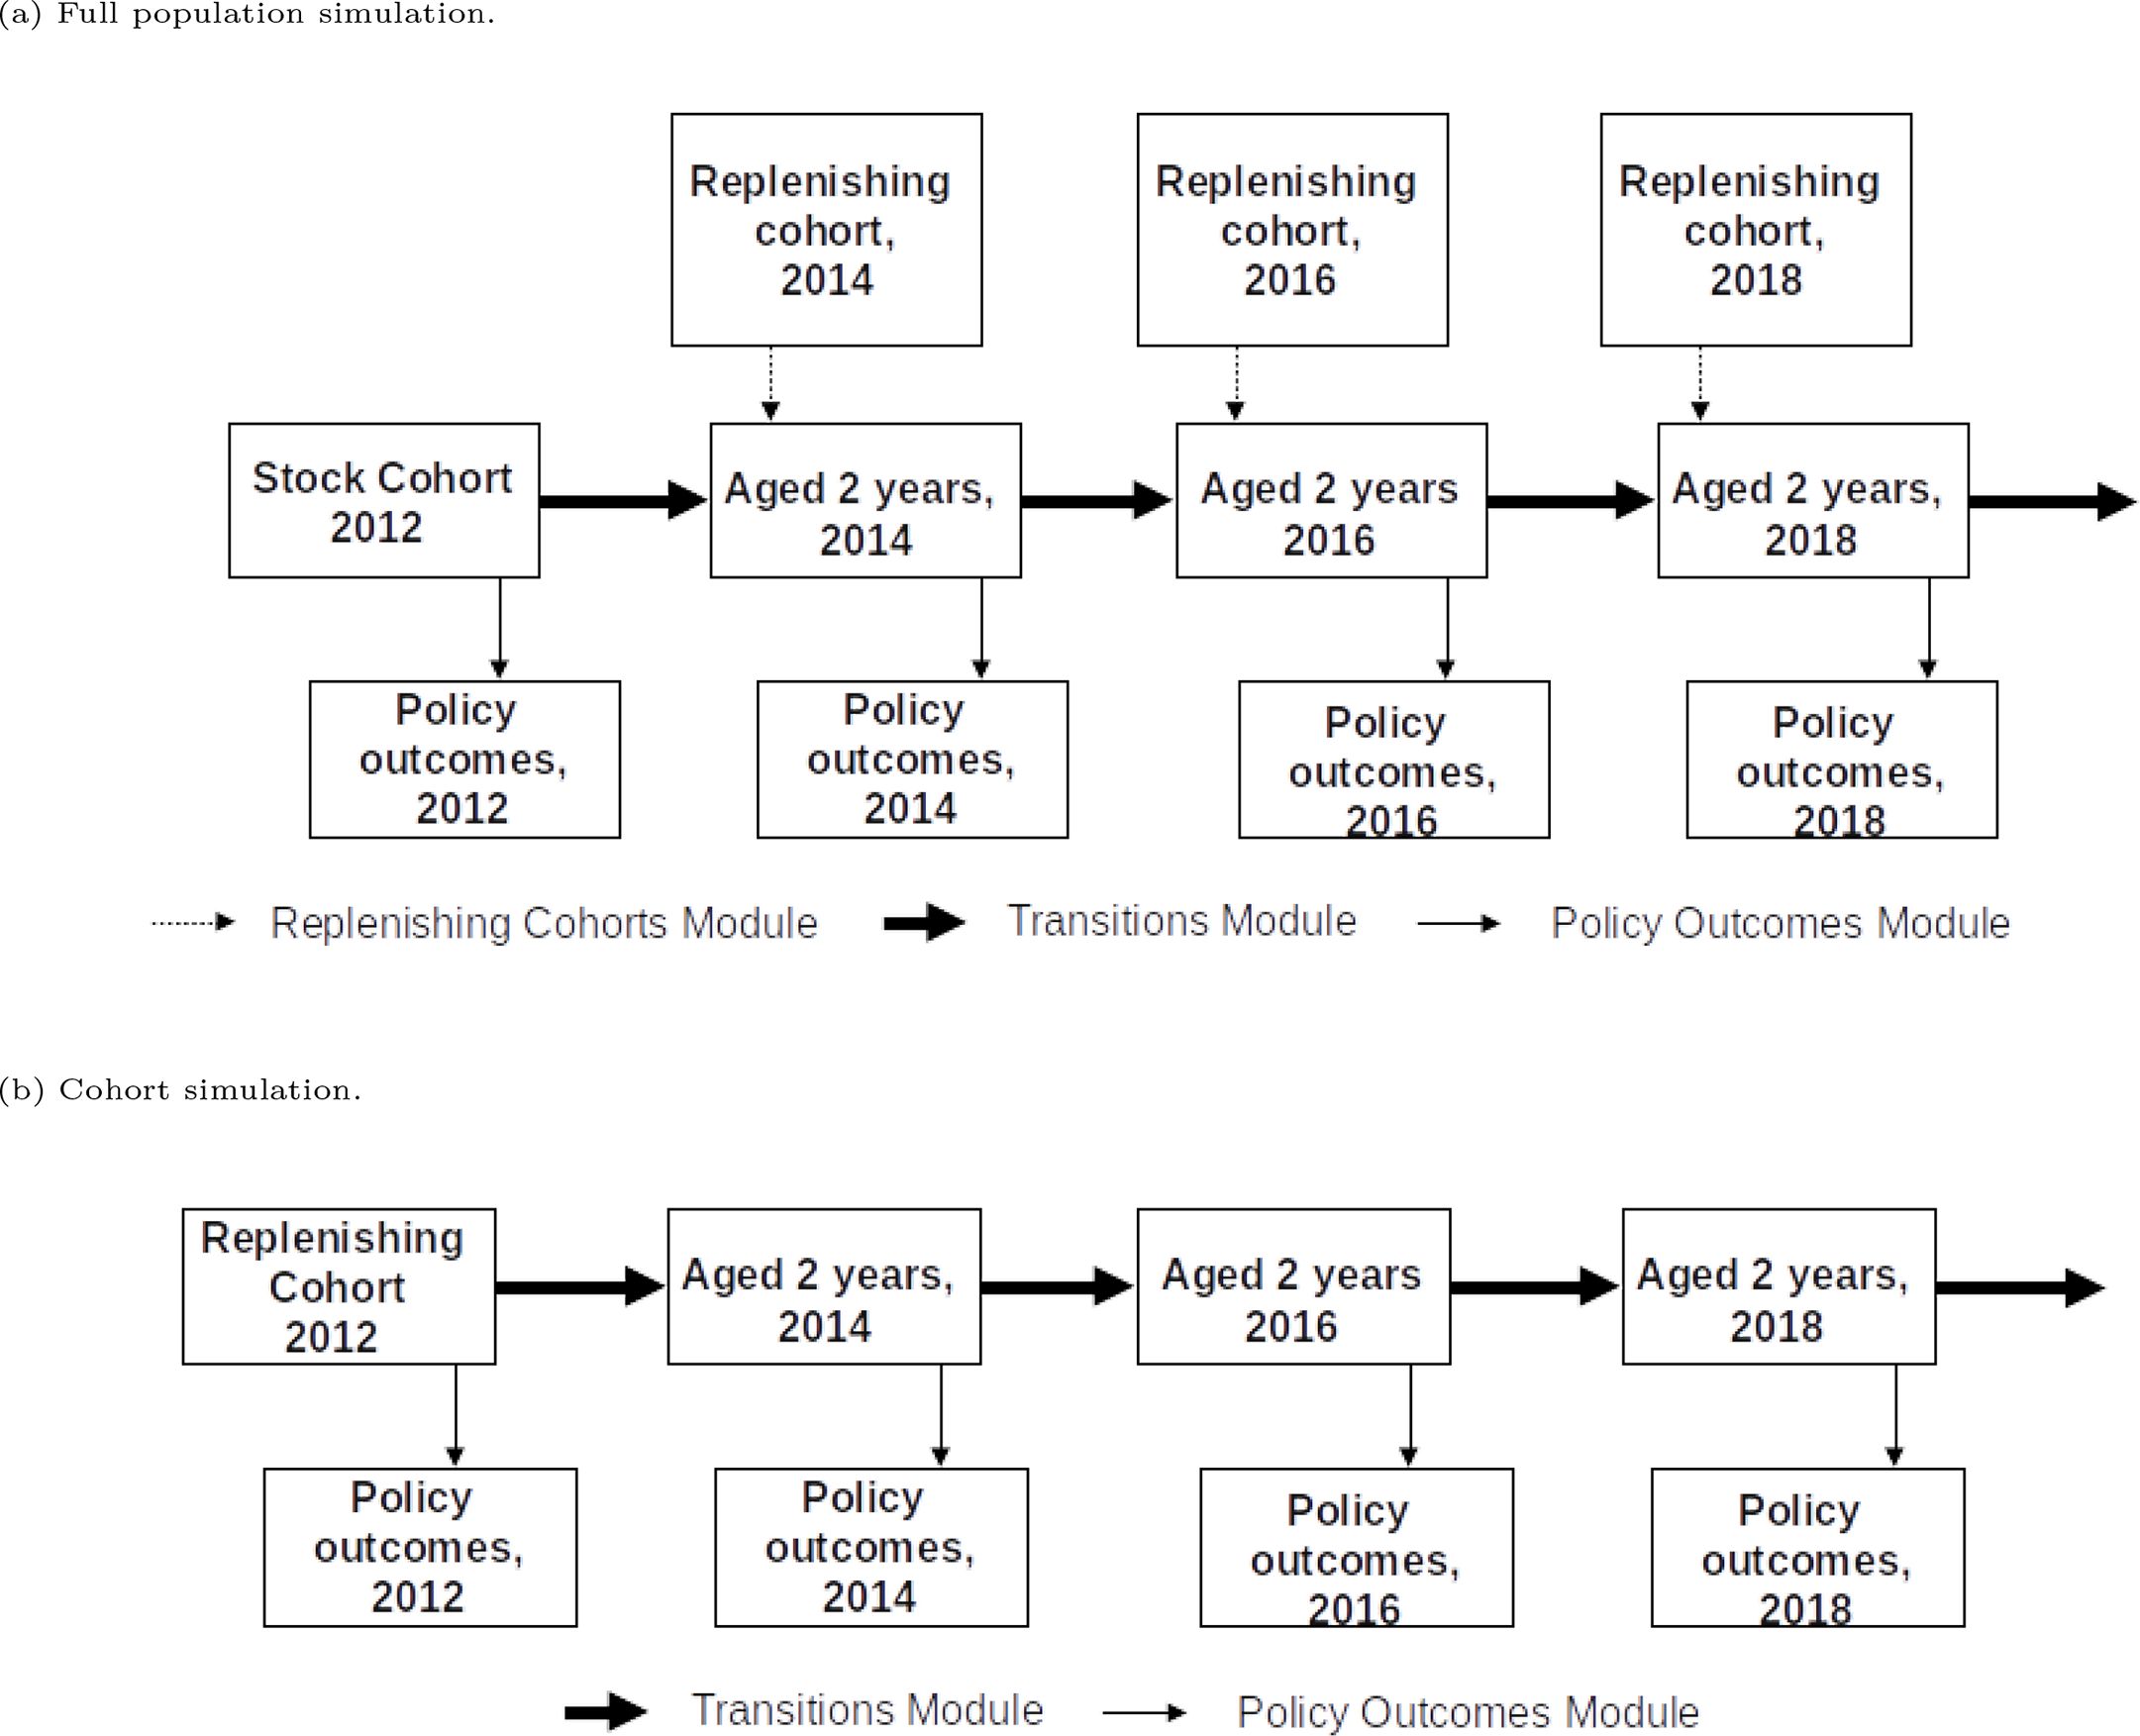
Structure of the FEM simulation.

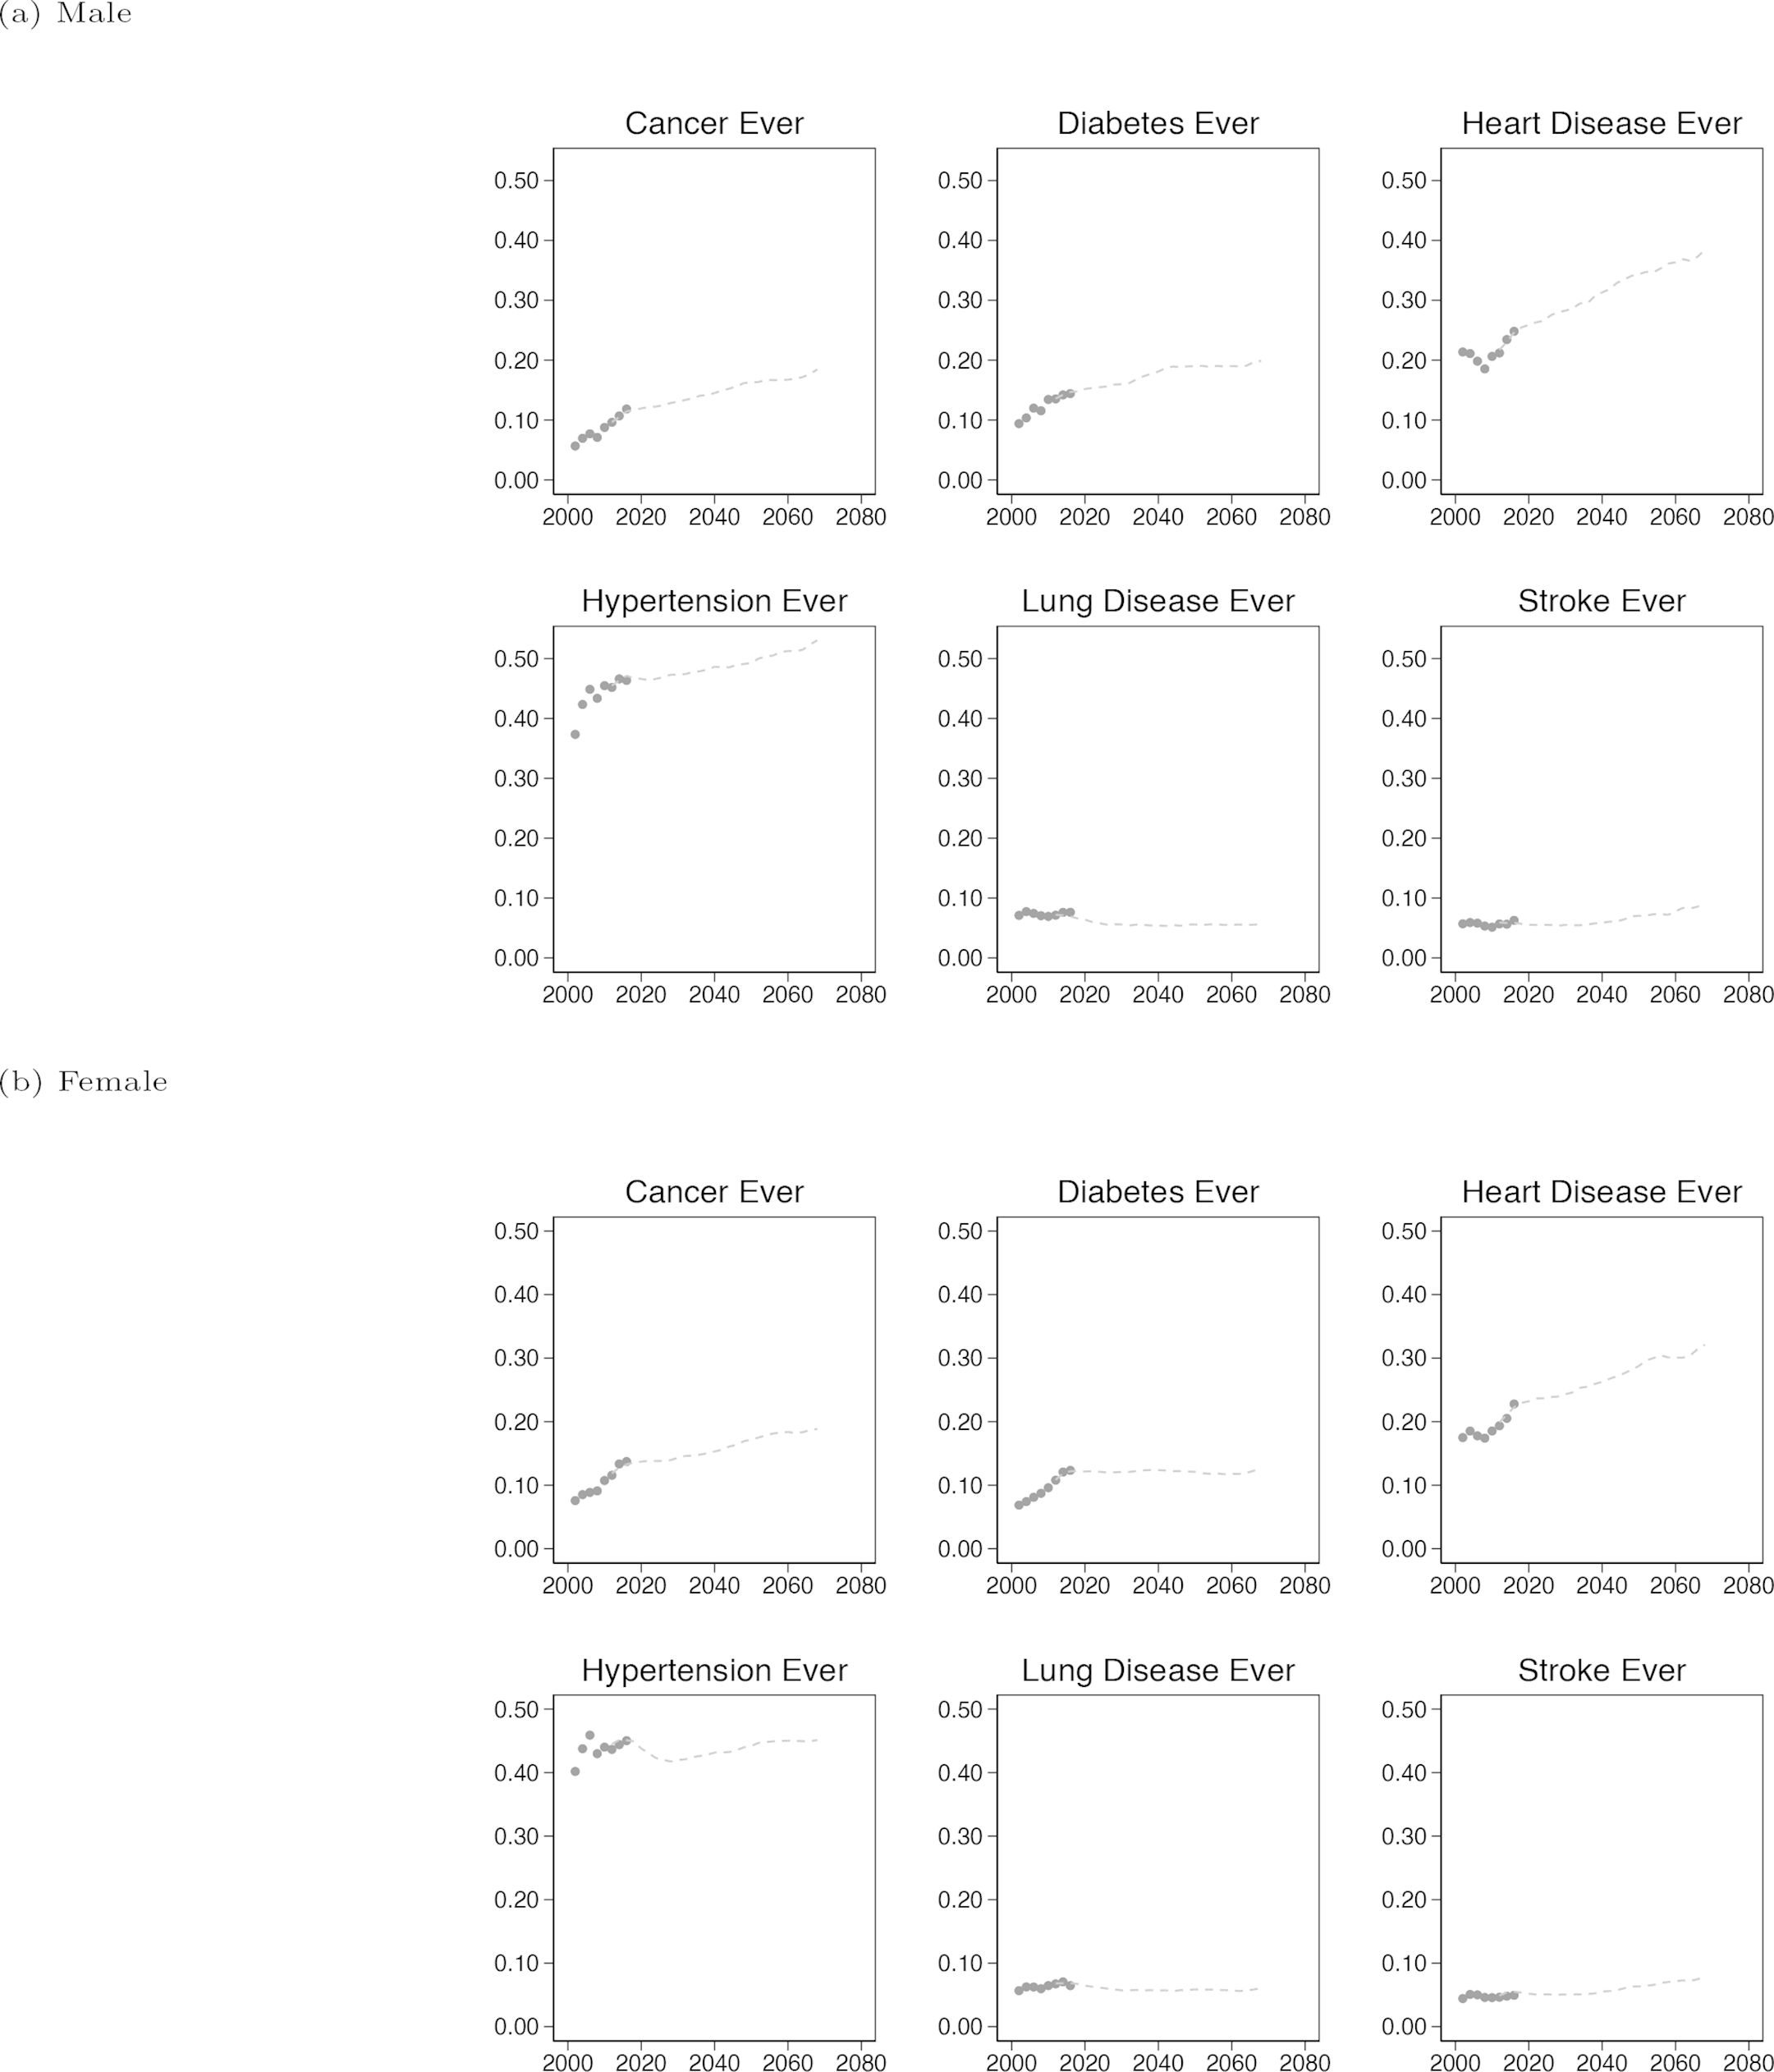
Handover plots for Chronic diseases by sex.

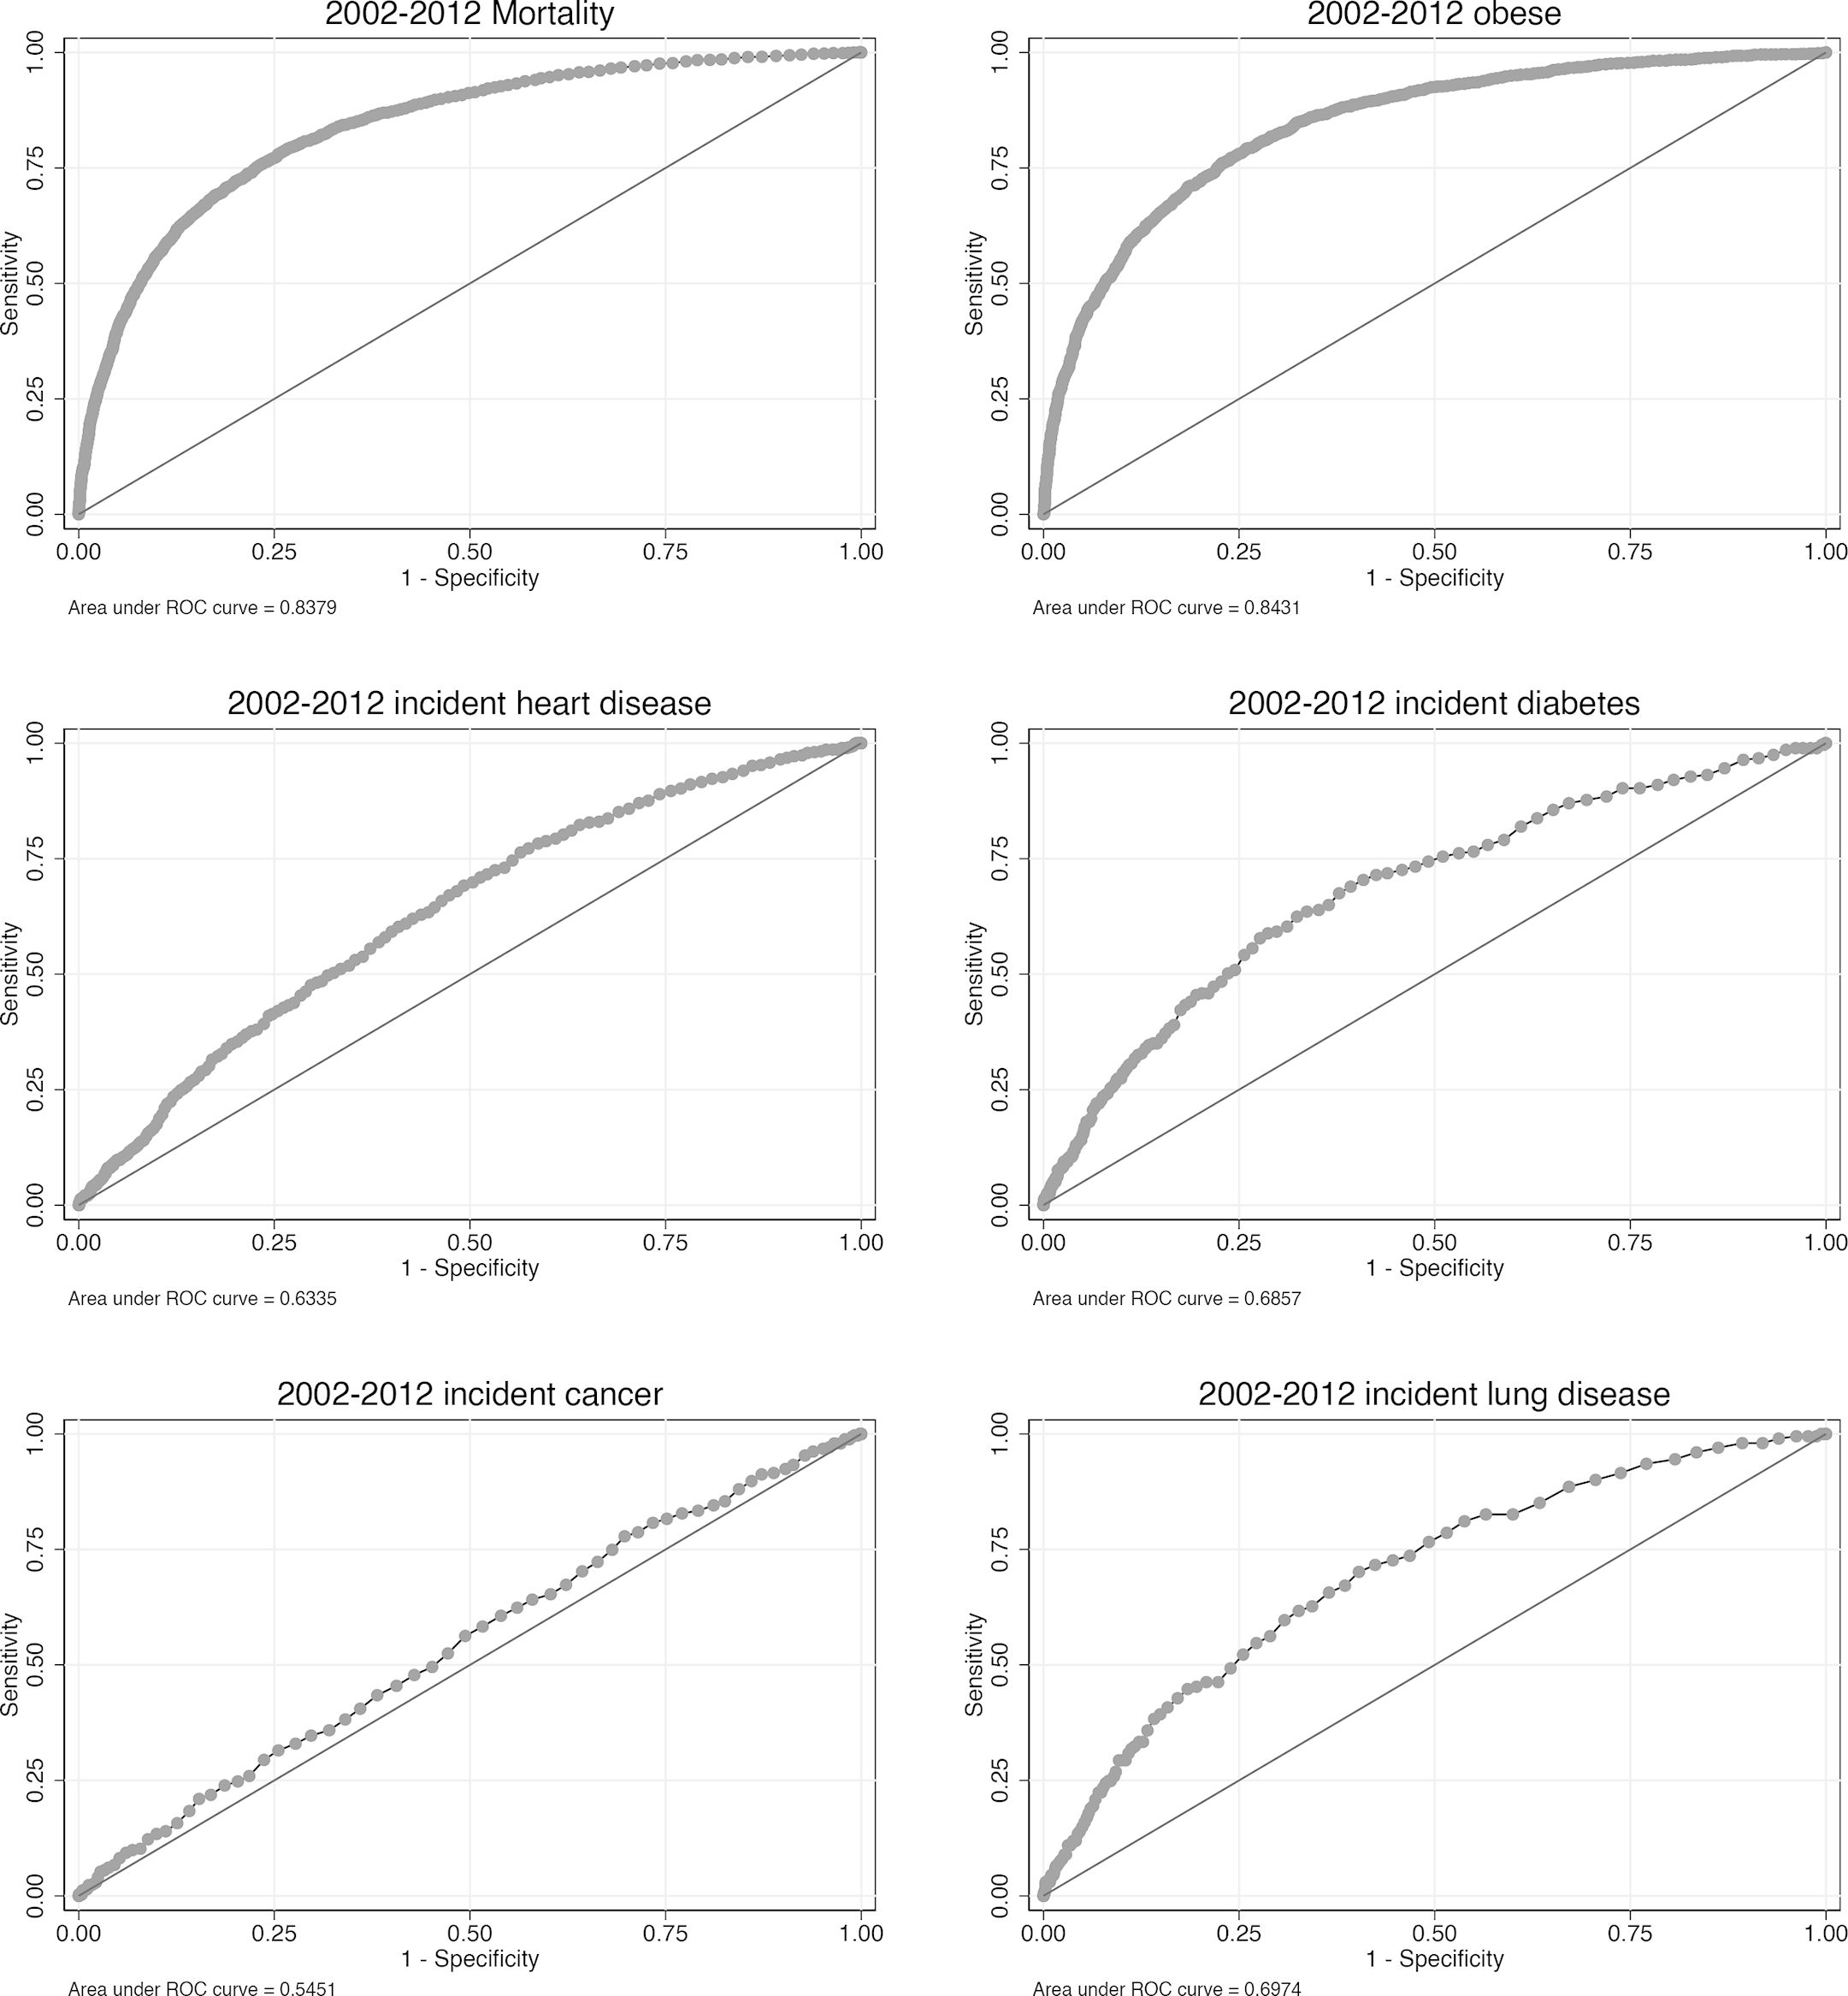
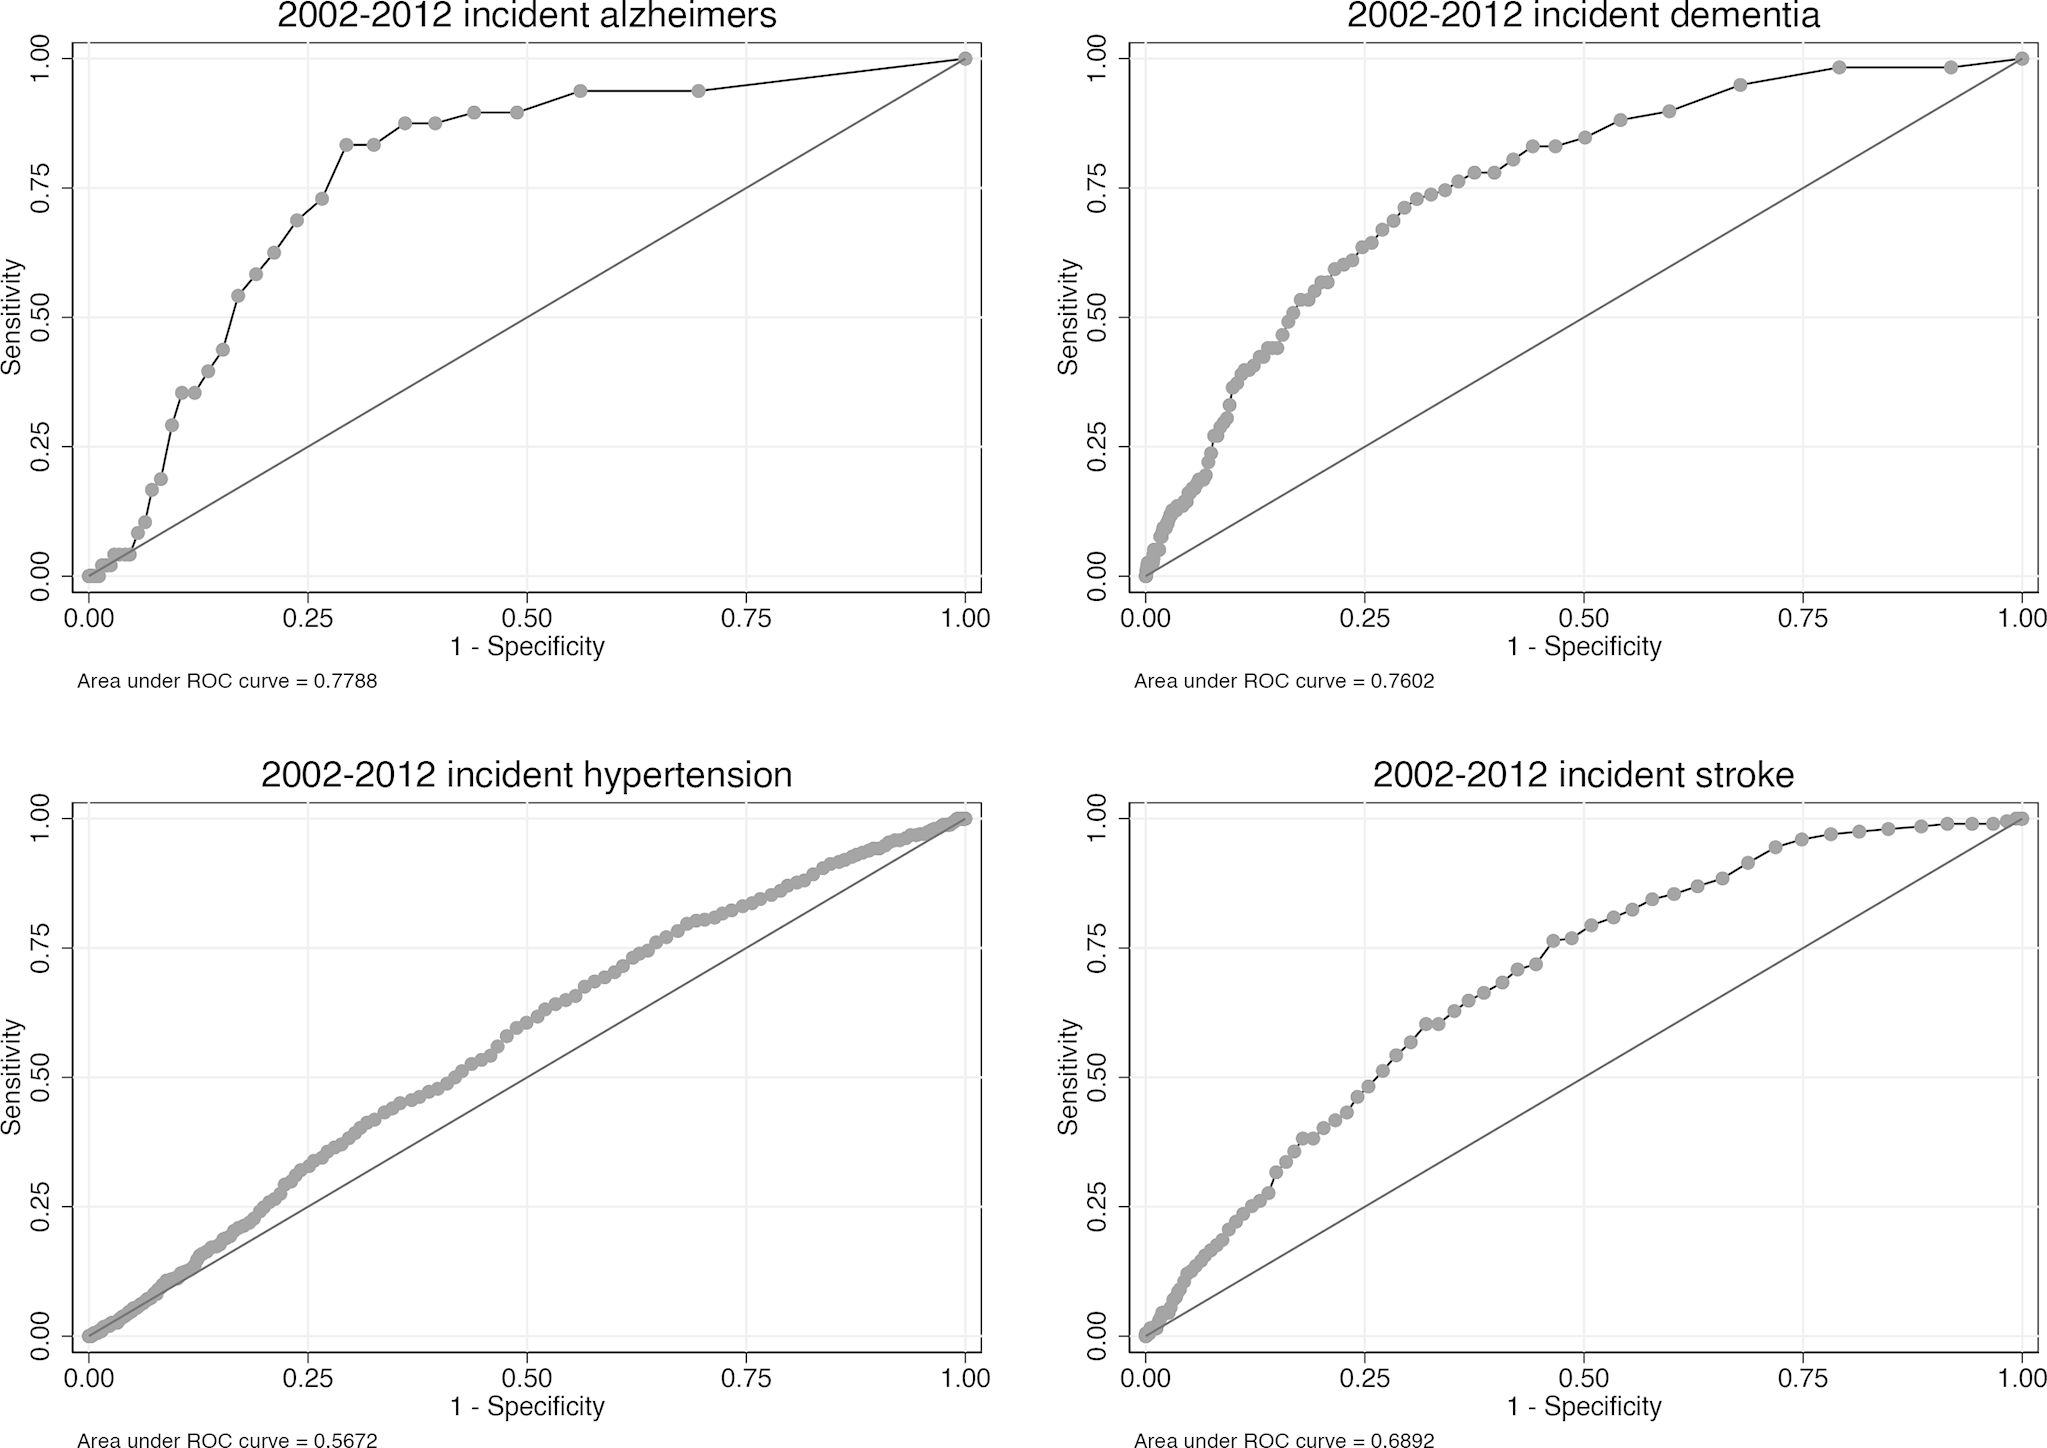
ROC curves for key binary response variables with a 10-year simulation horizon, from 2002 - 2012.

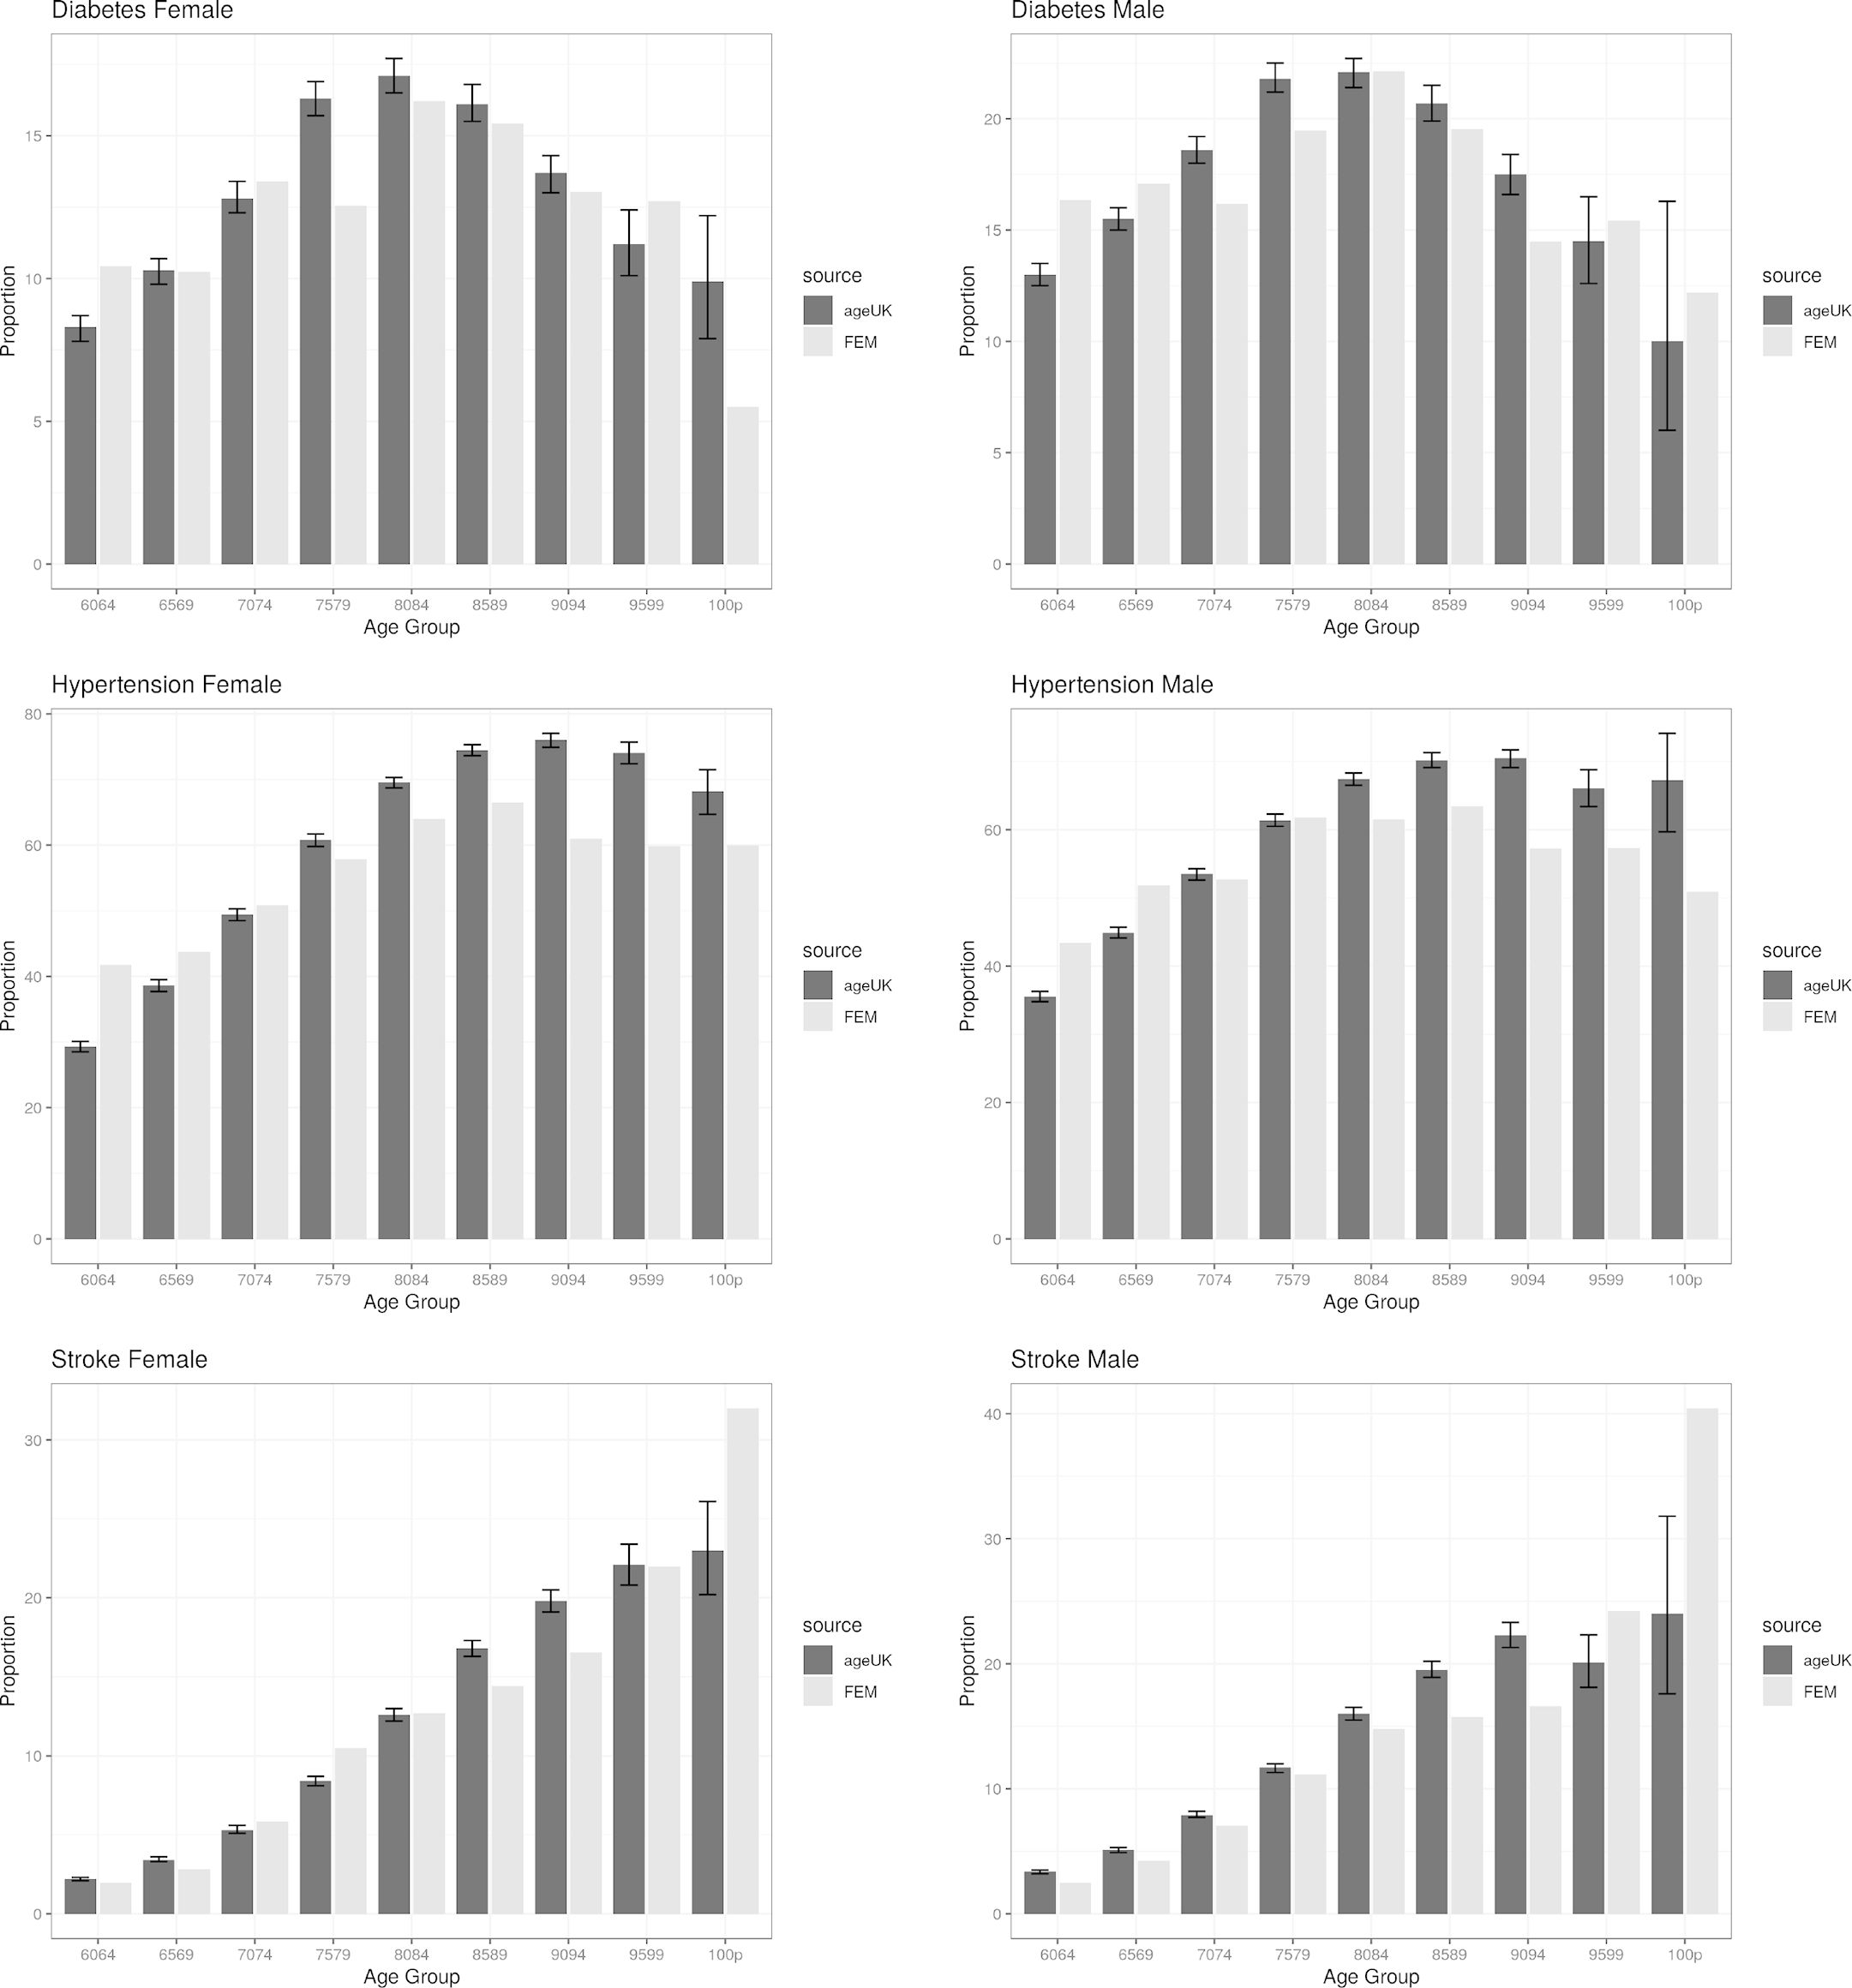
Chronic Disease prevalence comparisons by age group between FEM and AgeUK almanac of chronic disease in 2014. AgeUK figures include 95% confidence intervals.
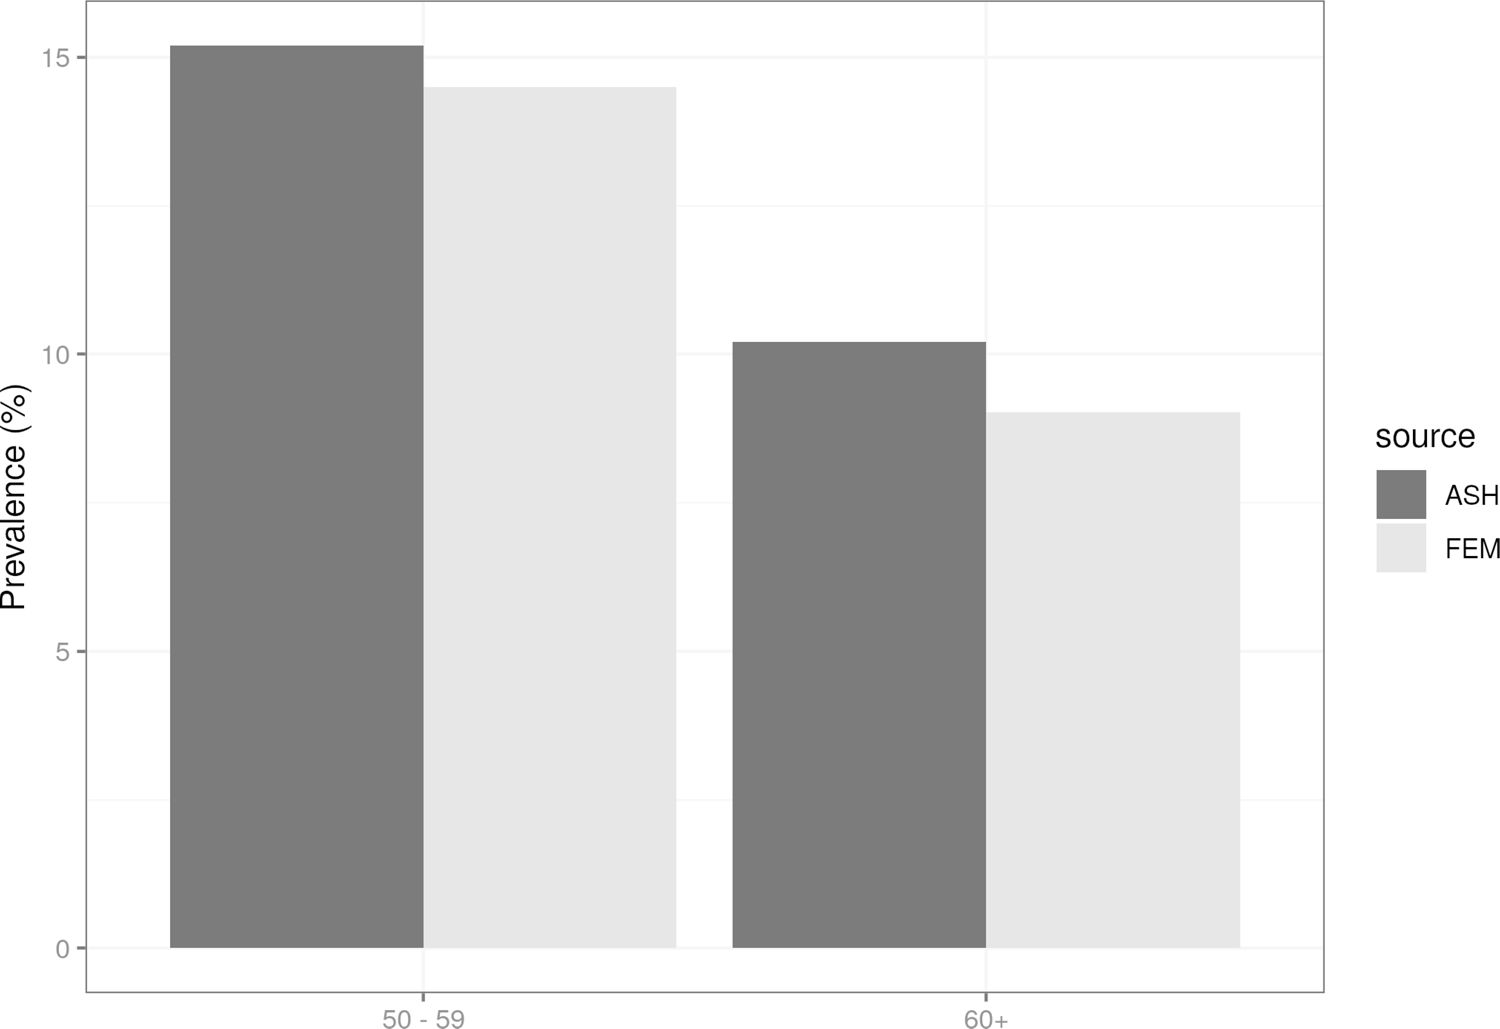
Smoking prevalence comparison by age group in 2018. Simulated data (starting in 2012) compared with prevalence statistics generated by the Action on Smoking and Health charity.

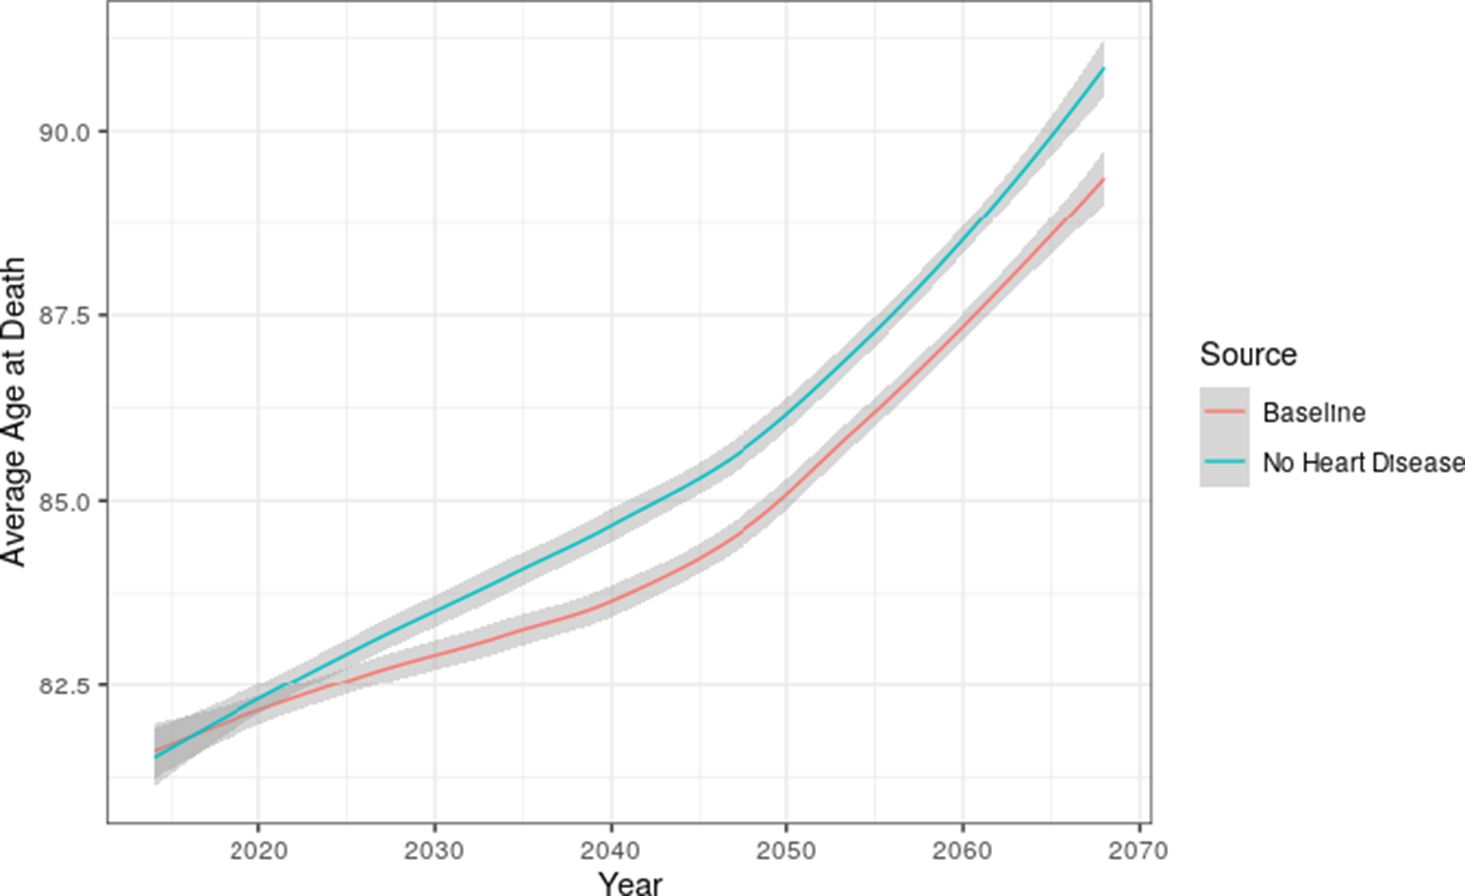
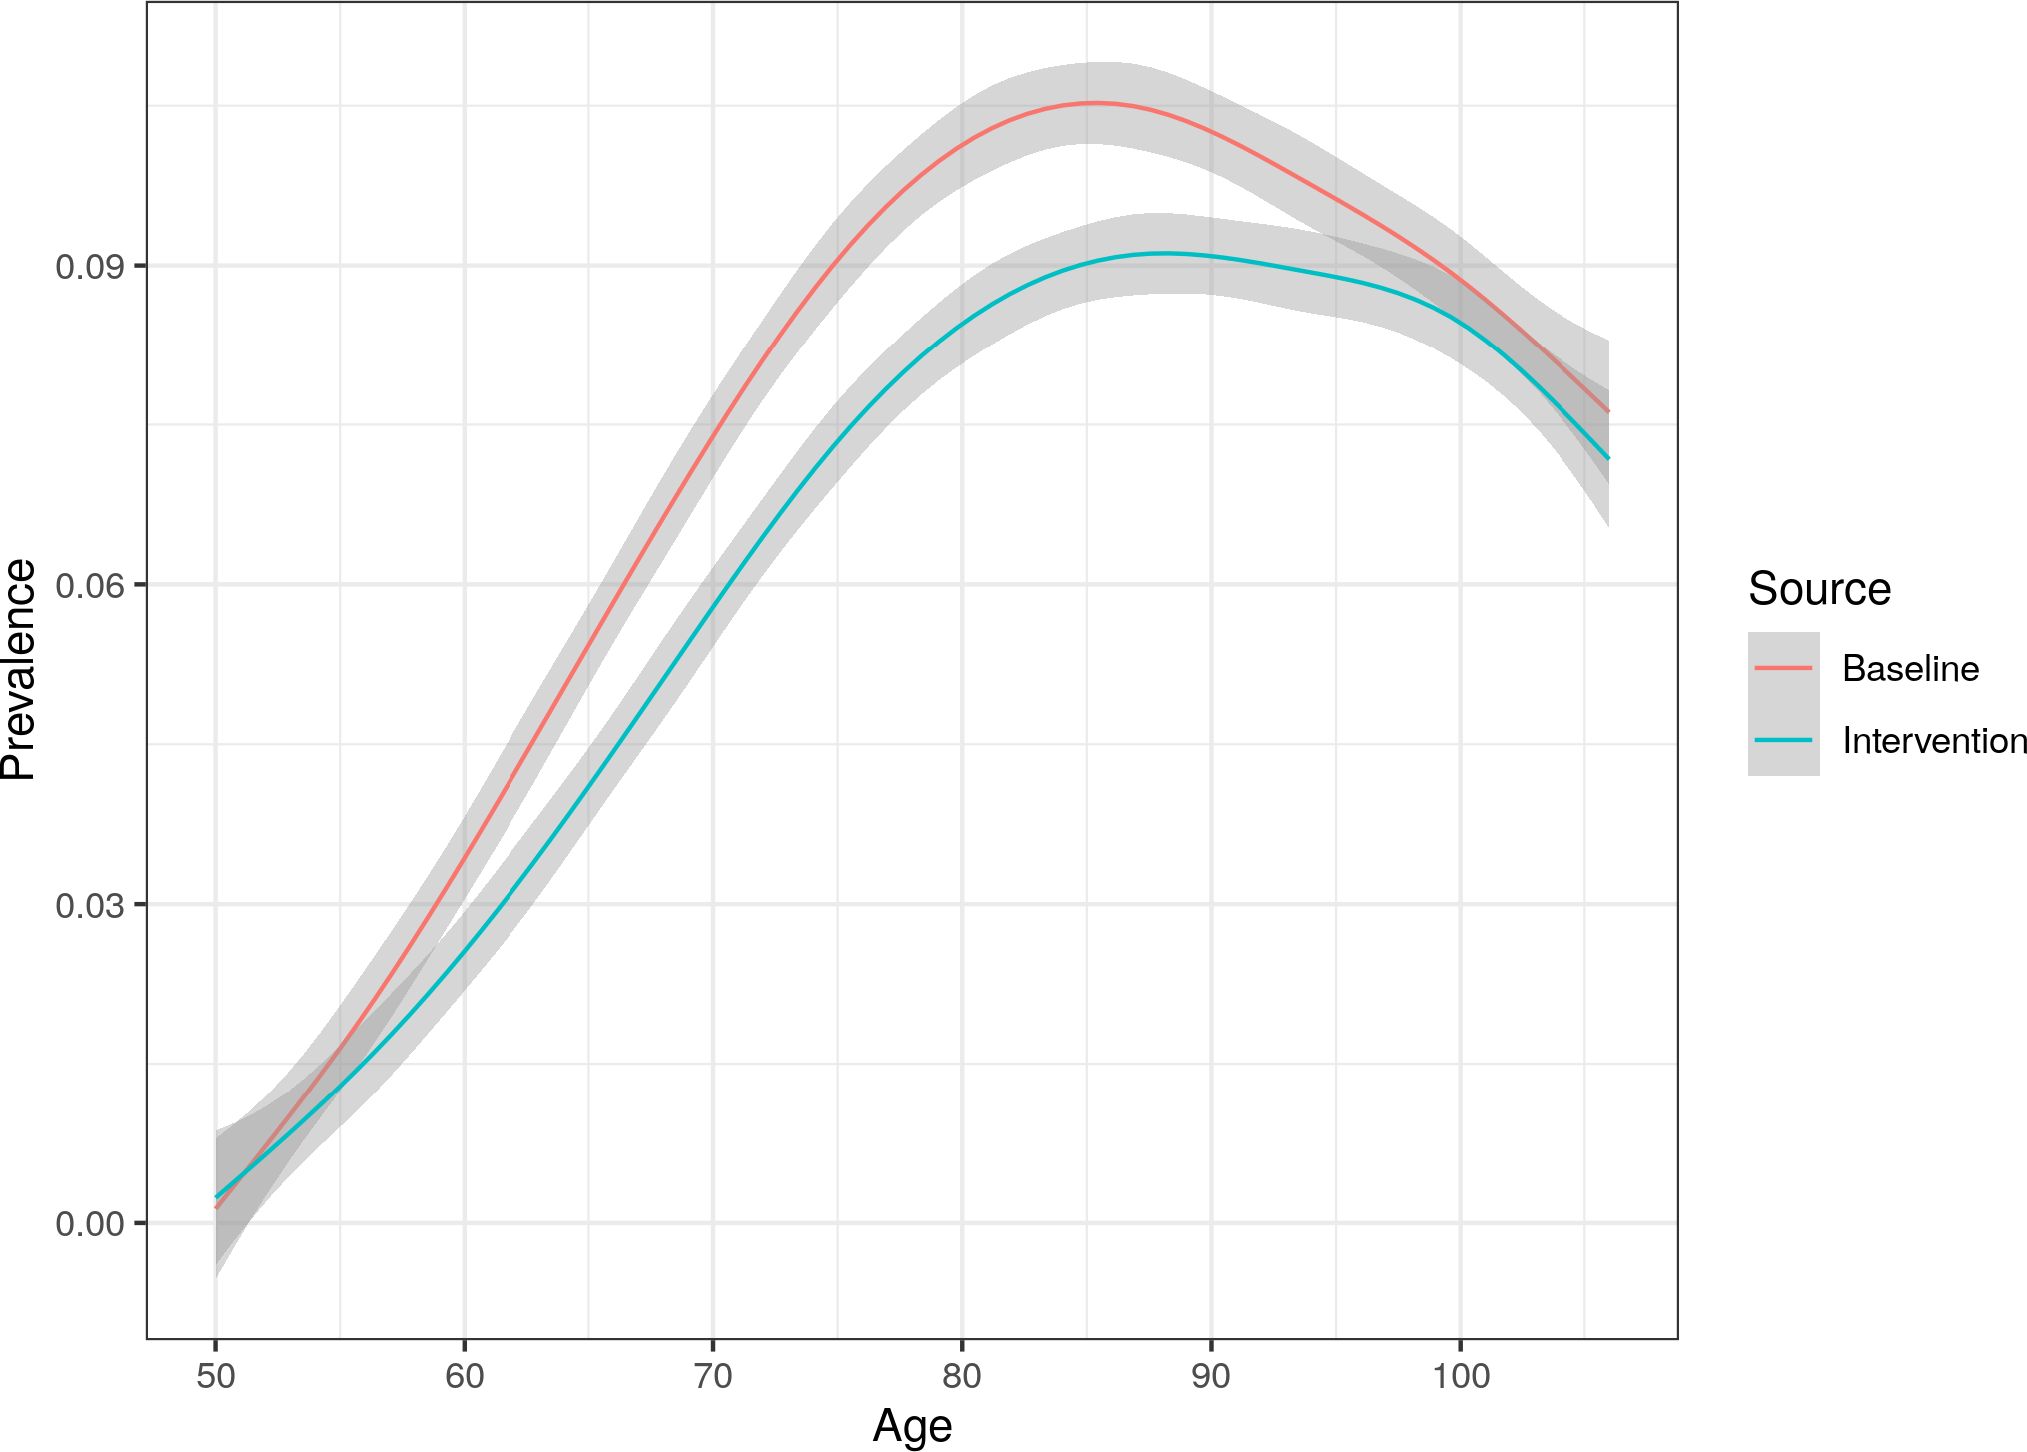
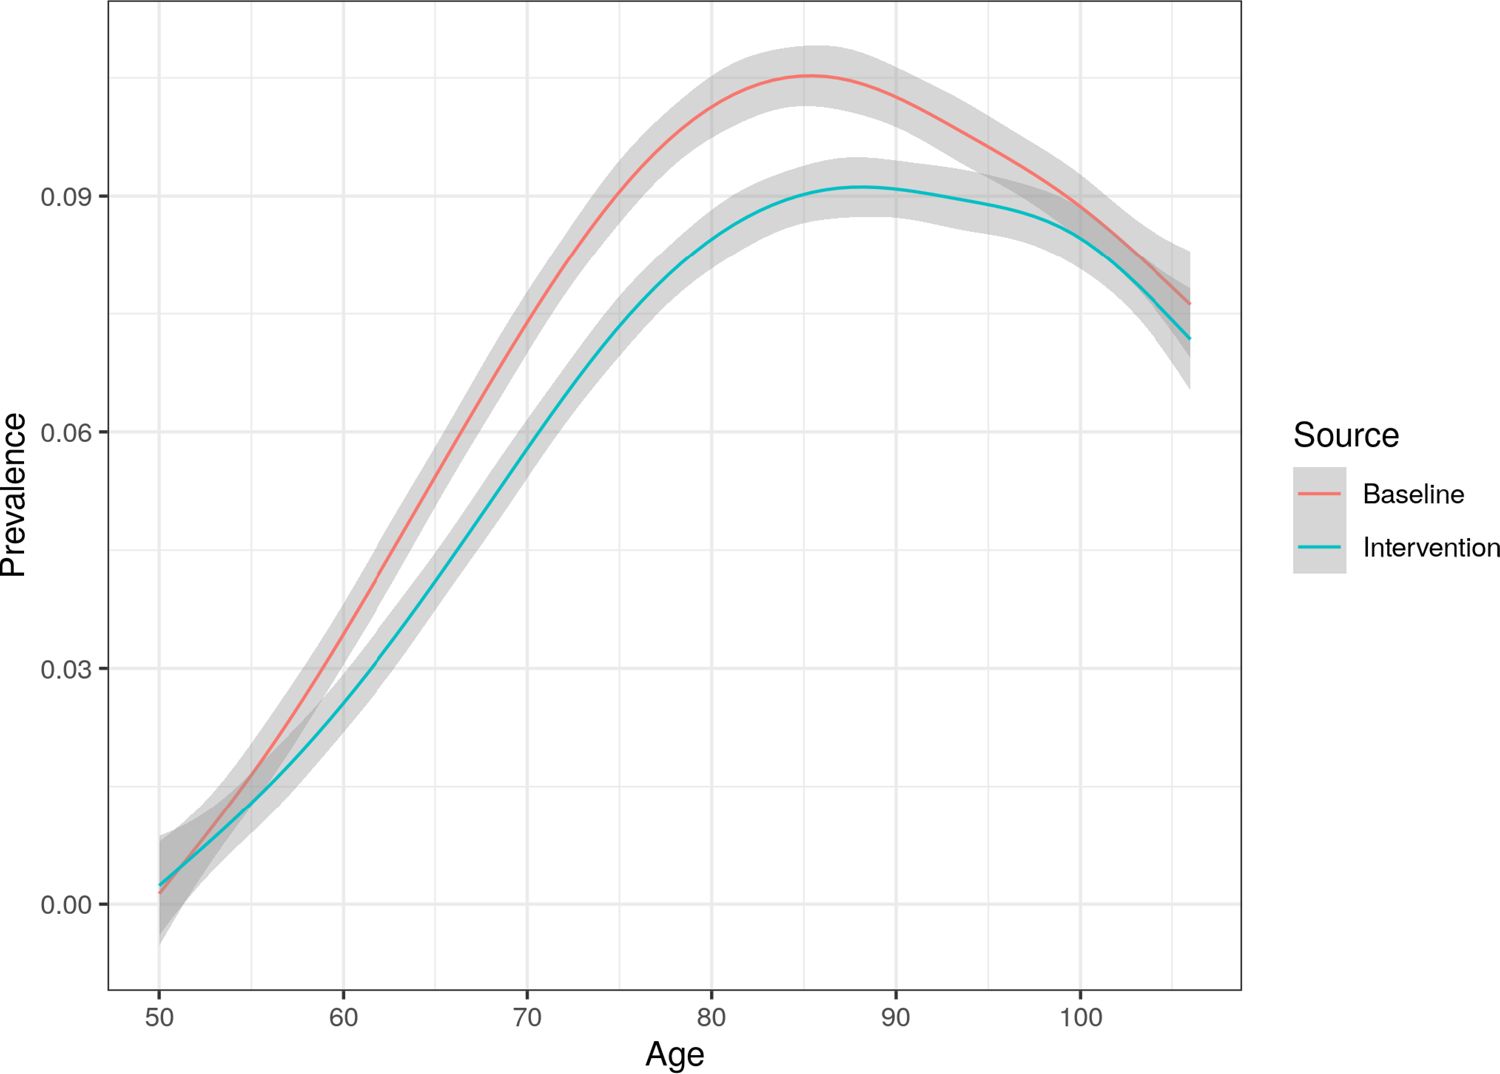
Average age at death comparison between baseline and no heart disease intervention. The shaded bands represent Monte Carlo confidence intervals.
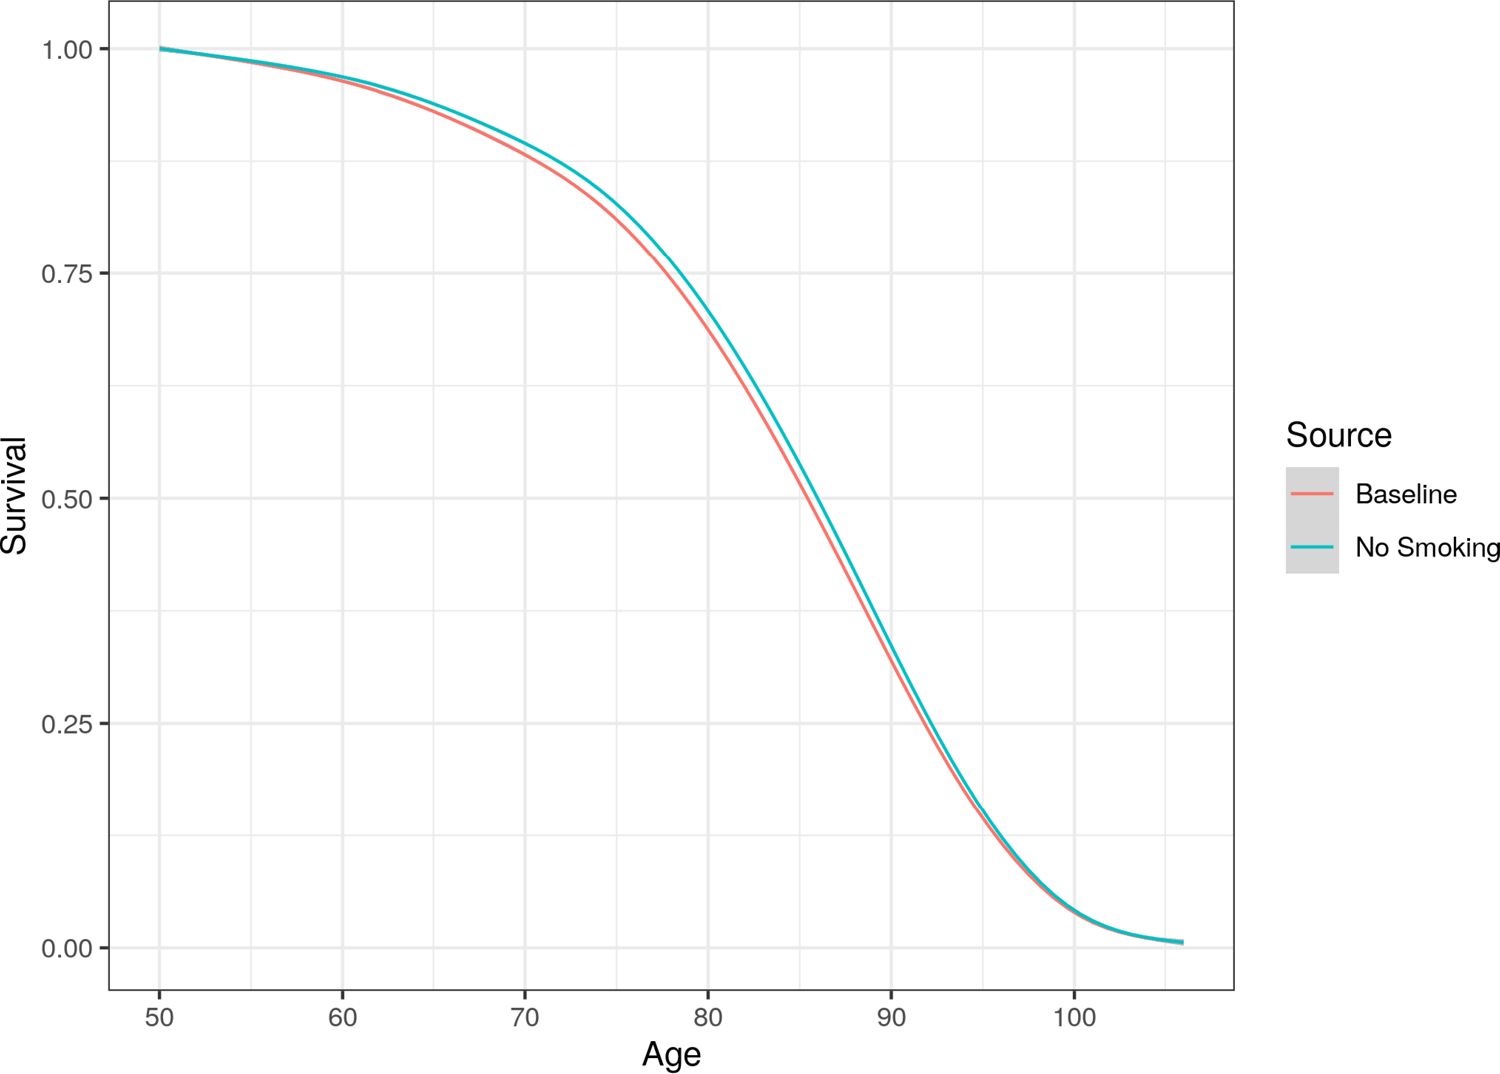
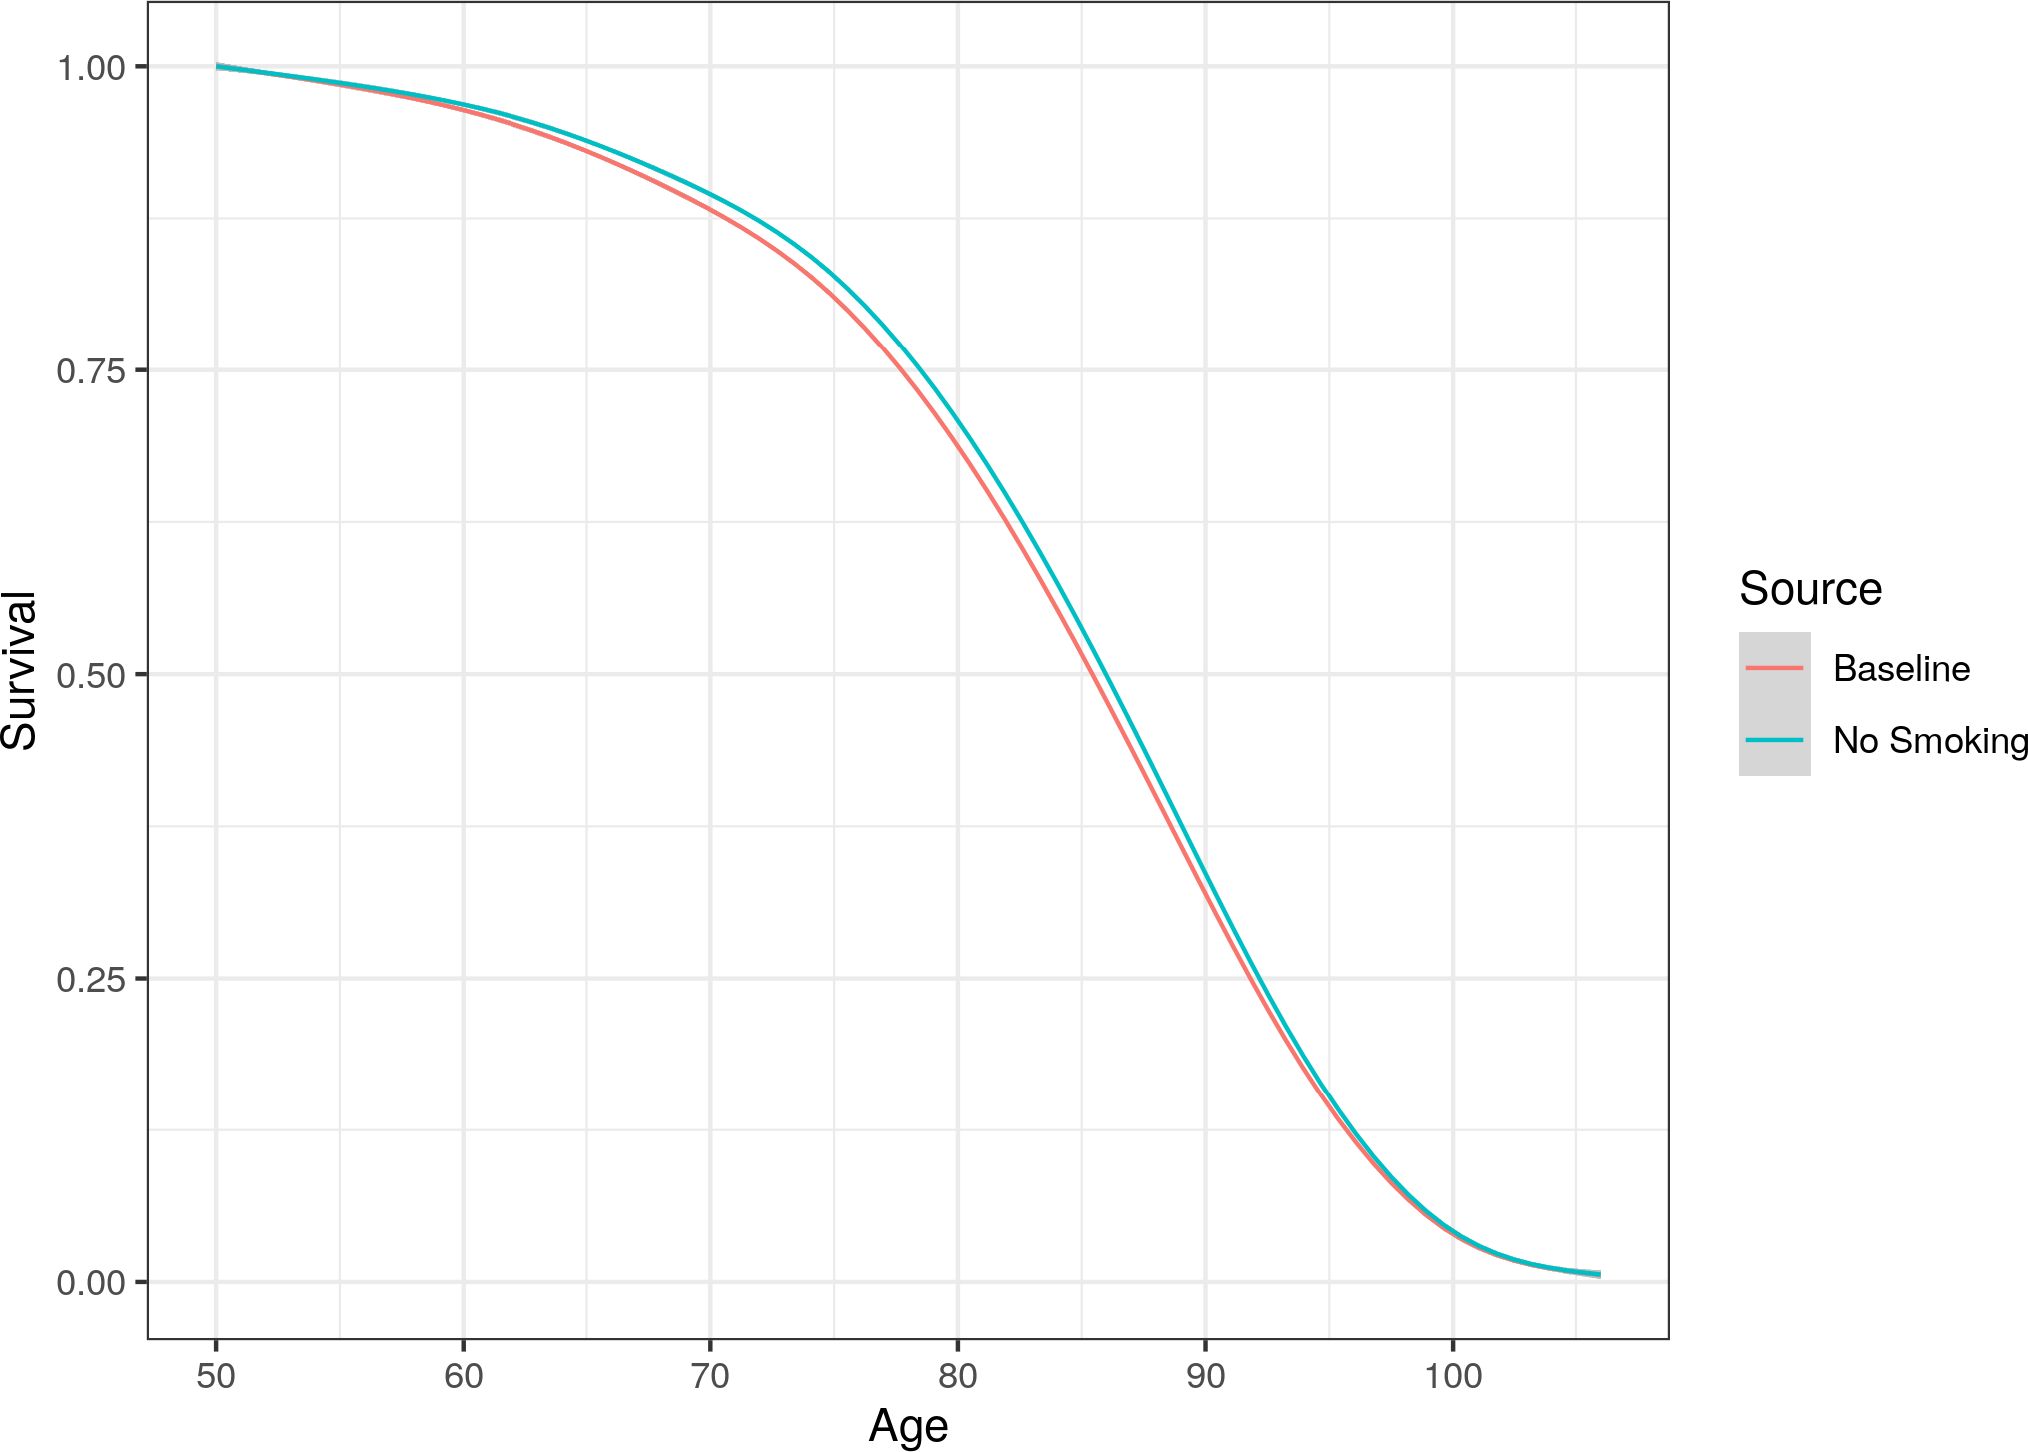
Whole population (including smokers and non-smokers) survival curve compared between the baseline and no smoking scenarios.
Whole population prevalence of lung disease comparison between the baseline and no smoking scenarios, with Monte Carlo confidence intervals.

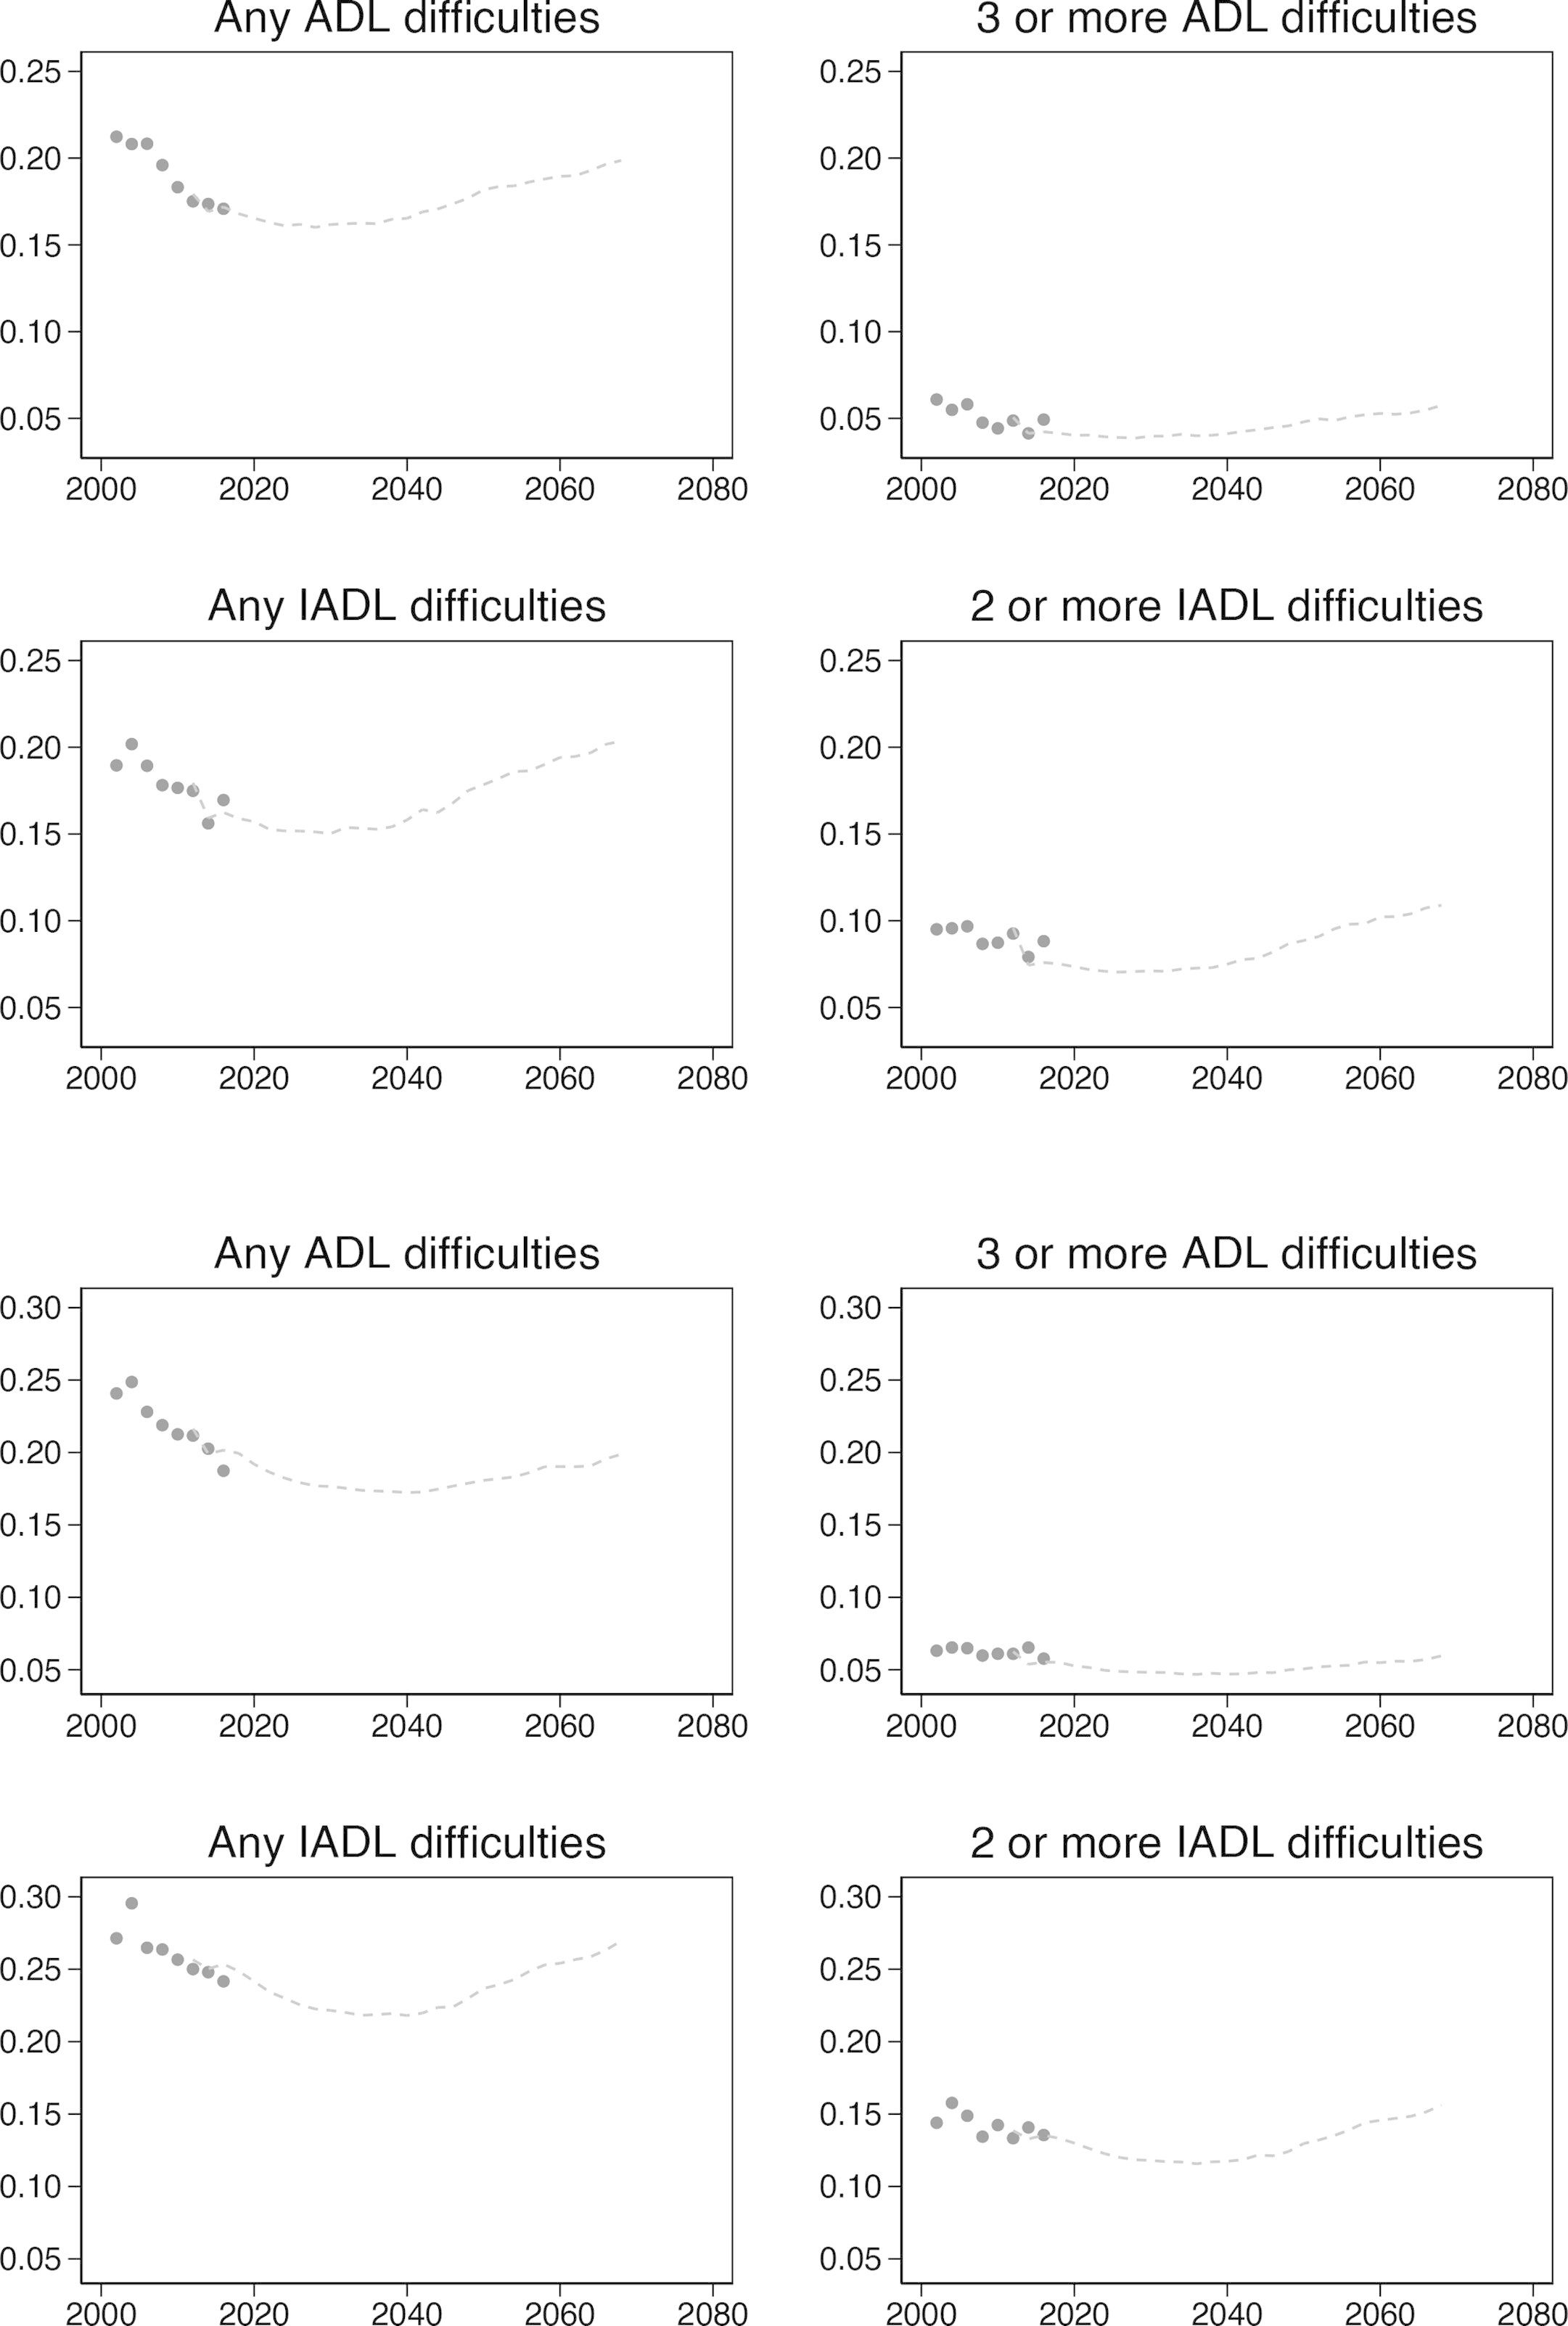
Handover plots for ADLs and IADLs.

Receiver Operating Characteristic curves.
Tables
Variables tracked by the model
| Domain | Variable |
|---|---|
| Health | Mortality, Alzheimers, Cancer, Dementia, Diabetes, Heart Disease, High Cholesterol, Hypertension, Lung Disease, Stroke |
| Risk Factors | BMI, Smoking Status, Alcohol Consumption, Exercise |
| Functional Limitations | Difficulties in Activities of Daily Living (ADLs), and Instrumental Activities of Daily Living (IADLs) |
| Economic | Employed, Unemployed, Retired/Disabled |
Sample attrition in the over 50s in ELSA. The sample was replenished in 2006, 2008, 2012, and 2014
| Year | Sample Size |
|---|---|
| 2002 | 11391 |
| 2004 | 8780 |
| 2006 | 8655 |
| 2008 | 9805 |
| 2010 | 8988 |
| 2012 | 9068 |
| 2014 | 8152 |
| 2016 | 7133 |
Summary statistics on key E-FEM populations.
| Characteristics | Stock | Replenishing | Transition | ||
|---|---|---|---|---|---|
| Year | 2012 | 2012 | 2004 - 2016 | ||
| Wave | 6 | 6 | 2 - 8 | ||
| Age, Mean (SD) | 66.2 (10.8) | 51.5 (0.5) | 66.1 (10.4) | ||
| Female % | 52.9 | 49.7 | 53.0 | ||
| BMI, Mean (SD) | 28.4 (5.4) | 27.8 (5.4) | 28.3 (5.3) | ||
| BMI Category (%) | |||||
| < 25 | 28.3 | 37.1 | 28.0 | ||
| ≥ 25 & < 30 | 38.8 | 34.8 | 39.9 | ||
| ≥ 30 | 33.0 | 28.1 | 32.1 | ||
| Smoking Status % | |||||
| Ever Smoked | 62.3 | 44.5 | 62.3 | ||
| Current Smoker | 13.6 | 13.7 | 14.3 | ||
| Education Level % | |||||
| Less than Secondary | 29.7 | 11.1 | 33.1 | ||
| Upper Secondary and Vocational | 59.9 | 64.1 | 65.7 | ||
| Tertiary | 10.4 | 24.8 | 11.2 | ||
| Disease Prevalence % (Incidence) | |||||
| Cancer | 9.8 | 2.9 | 9.0 (1.46) | ||
| Diabetes | 11.1 | 2.8 | 10.4 (1.34) | ||
| Heart Disease | 18.9 | 7.7 | 18.7 (2.57) | ||
| Stroke | 4.7 | 0.0 | 4.7 (0.85) | ||
| Lung Disease | 6.1 | 0.3 | 6.2 (0.87) | ||
| Hypertension | 41.8 | 20.4 | 42.0 (3.08) | ||
| Alzheimer’s | 0.35 | 0.0 | 0.32 (0.21) | ||
| Dementia | 1.25 | 0.27 | 1.12 (0.58) | ||
| High Cholesterol | 37.0 | 14.9 | 32.5 (3.92) | ||
Information on transitioned variables in the model.
| Outcome | Variable Type | Regression Model | Predictors* | |||
|---|---|---|---|---|---|---|
| Health Status | Risk Behaviours | Economic Predictors | Demographics | |||
| Mortality incidence | Binary Absorbing | Probit | Cancer Diabetes Heart Disease Lung Disease Stroke Dementia |
Smoking | Age Sex Education |
|
| Cancer incidence | Binary Absorbing | Probit | BMI Smoking Alcohol Consumption |
Age Sex Ethnicity Education |
||
| Diabetes incidence | Binary Absorbing | Probit | Hypertension High Cholesterol |
BMI Physical Activity Alcohol Consumption |
Age Sex Ethnicity Education |
|
| Heart Disease incidence | Binary Absorbing | Probit | Diabetes Hypertension High Cholesterol |
BMI Smoking Physical Activity Alcohol Consumption |
Age Sex Ethnicity Education |
|
| Hypertension incidence | Binary Absorbing | Probit | High Cholesterol | BMI Smoking Alcohol Consumption Physical Activity |
Age Sex Ethnicity Education |
|
| Lung Disease incidence | Binary Absorbing | Probit | BMI Smoking |
Age Sex Ethnicity Education |
||
| Stroke incidence | Binary Absorbing | Probit | Hypertension Diabetes High Cholesterol |
BMI Smoking Alcohol Consumption |
Age Sex Ethnicity Education |
|
| High Cholesterol incidence | Binary Absorbing | Probit | BMI Smoking Physical Activity |
Age Sex Ethnicity Education |
||
| Dementia incidence | Binary Absorbing | Probit | Hypertension Stroke |
BMI Smoking |
Age Sex Ethnicity Education |
|
| Alzheimers incidence | Binary Absorbing | Probit | Hypertension Stroke |
BMI Smoking Alcohol Consumption |
Age Sex Ethnicity Education |
|
| Start/Stop Smoking | Binary | Probit | BMI | Age Sex Ethnicity Education |
||
| Alcohol Consumption | Binary | Probit | BMI Physical Activity |
Age Sex Ethnicity Education |
||
| BMI | Continuous | OLS | BMI Physical Activity |
Age Sex Ethnicity Education |
||
| Functional Limitations | Ordered | Oprobit | Stroke Dementia Alzheimers |
BMI Smoking |
Age Sex Ethnicity Education |
|
| Physical Activity | Ordered | Oprobit | Functional Limitations Physical Activity |
Age Sex Ethnicity Education |
||
| Labour Force Participation | Unordered | Mlogit | Functional Limitations | Age Sex Ethnicity Education |
||
-
*
All predictor variables are 2 year lag.
Parameter estimates for probit model of heart disease incidence.
| Heart Disease | |
|---|---|
| Male | 0.108*** |
| White | -0.0729 |
| Less than Secondary Education | -0.0642 |
| Higher or further education | 0.0194 |
| Lag of age spline, less than 65 | 0.0103 |
| Lag of age spline, 65 to 74 | 0.0262*** |
| Lag of age spline, more than 75 | 0.0182*** |
| Lag of BMI spline, less than 30 | 0.163 |
| Lag of BMI spline, more than 30 | 0.218 |
| Lag of ever smoker | 0.0259 |
| Lag of current smoker | 0.0264 |
| Lag of heavy smoker (>20 cigs/day) | 0.0836 |
| Lag of problem drinker (>12 drinks/week) | -0.0318 |
| Lag of doctor ever - Diabetes | 0.0520 |
| Lag of doctor ever - Hypertension | 0.163*** |
| Lag of doctor ever - High Cholesterol | 0.0659* |
| Lag of activity level - Low | 0.174** |
| Lag of activity level - Moderate | 0.0979* |
| Constant | -3.172*** |
| N | 22,333 |
| Pseudo R2 | 0.0335 |
Parameter estimates for probit models of smoking initiation and cessation.
| Smoking | ||
|---|---|---|
| Started | Stopped | |
| Male | 0.112** | 0.0263 |
| White | 0.0228 | 0.257 |
| Less than Secondary education | 0.188*** | -0.106* |
| Higher or Further education | -0.154** | 0.215** |
| Lag of age spline, less than 65 | -0.00572 | 0.0188*** |
| Lag of age spline, 65 to 74 | -0.0186** | -0.00979 |
| Lag of age spline, more than 75 | -0.0289** | 0.0171 |
| Lag of BMI spline, less than 30 | -0.414* | 0.839*** |
| Lag of BMI spline, more than 30 | 0.25 | 0.0703 |
| Constant | -0.649 | -5.060*** |
| N | 41951 | 6157 |
| Pseudo R2 | 0.019 | 0.0129 |
Life year and disability-free life year comparison between baseline and no smoking scenario. This is a treatment on the treated analysis, so only including respondents that smoke.
| Scenario | Life Years | Disability-free Life Years |
|---|---|---|
| Baseline | 24.4 | 16.9 |
| Intervention | 31.4 | 21.4 |
Average improvement in life years and disability-free life years between scenarios by highest level of education.
| Education Level | Life Years Improvement | Disability-free Life Years Improvement |
|---|---|---|
| 1 | 5.5 | 3.4 |
| 2 | 8.4 | 5.3 |
| 3 | 7.7 | 5.4 |
Summary statistics for raw and imputed stock populations, including the percentage of missing data where applicable.
| Characteristics | Raw Stock | Imputed | Missing (%) |
|---|---|---|---|
| Age, Mean (SD) | 66.5 (10.8) | 66.2 (10.8) | 0 |
| Female (%) | 52.9 | 52.9 | 0 |
| BMI, Mean (SD) | 28.4 (5.4) | 28.4 (5.4) | 19.2 |
| BMI Category (%) | |||
| < 25 | 28.3 | 28.3 | - |
| ≥ 25 & < 30 | 42.2 | 42.2 | - |
| ≥ 30 | 29.5 | 29.5 | - |
| Smoking Status (%) | |||
| Ever Smoked | 62.5 | 62.3 | 1.83 |
| Current Smoker | 12.2 | 13.6 | 0.05 |
| Education Level (%) | 20.9 | ||
| Less than Secondary | 38.6 | 38.6 | - |
| Upper Secondary and Vocational | 48.0 | 47.9 | - |
| Some University or more | 13.5 | 13.5 | - |
| Initial Disease Prevalence (%) | |||
| Cancer | 9.8 | 9.8 | 0.009 |
| Diabetes | 11.1 | 11.1 | 0.009 |
| Heart Disease | 18.9 | 18.9 | 0.009 |
Raw vs imputed BMI mean and standard deviation at each wave of ELSA.
| Wave | Raw BMI | Imputed BMI |
|---|---|---|
| 1 | - | 28.0 (5.3) |
| 2 | 28.0 (4.9) | 28.0 (5.0) |
| 3 | - | 28.2 (5.2) |
| 4 | 28.3 (5.4) | 28.4 (5.4) |
| 5 | - | 28.4 (5.4) |
| 6 | 28.4 (5.3) | 28.4 (5.4) |
| 7 | - | 28.4 (5.4) |
| 8 | 28.3 (5.5) | 28.3 (5.5) |
T-test results for health outcomes.
| Variable | FEM 3 | ELSA 3 | P value 3 | FEM 5 | ELSA 5 | P value 5 | FEM 8 | ELSA 8 | P value 8 |
|---|---|---|---|---|---|---|---|---|---|
| Alzheimers | 0.0067 | 0.00325 | 0.00076 | 0.0103 | 0.00404 | 0 | 0.0178 | 0.0119 | 0.0204 |
| Any ADLs | 0.184 | 0.213 | 0 | 0.199 | 0.234 | 0 | 0.241 | 0.225 | 0.0938 |
| Any IADLs | 0.204 | 0.222 | 0.012 | 0.230 | 0.255 | 0.00292 | 0.268 | 0.266 | 0.839 |
| Cancer | 0.1 | 0.0863 | 0.00448 | 0.130 | 0.119 | 0.0836 | 0.176 | 0.164 | 0.182 |
| Dementia | 0.0159 | 0.0102 | 0.00156 | 0.0226 | 0.0194 | 0.24 | 0.0324 | 0.164 | 0.0214 |
| Diabetes | 0.109 | 0.0937 | 0.00275 | 0.132 | 0.128 | 0.571 | 0.164 | 0.151 | 0.125 |
| Heart disease | 0.220 | 0.175 | 0 | 0.26 | 0.222 | 0 | 0.328 | 0.29 | 0.00031 |
| Hypertension | 0.453 | 0.448 | 0.555 | 0.491 | 0.506 | 0.115 | 0.549 | 0.538 | 0.381 |
| Lung disease | 0.0836 | 0.0719 | 0.00989 | 0.0957 | 0.0863 | 0.0857 | 0.111 | 0.0898 | 0.00167 |
| Stroke | 0.0558 | 0.0504 | 0.156 | 0.0667 | 0.06743 | 0.875 | 0.082 | 0.089 | 0.289 |
t-test results for economic outcomes.
| Variable | FEM 3 | ELSA 3 | P value 3 | FEM 5 | ELSA 5 | P value 5 | FEM 8 | ELSA 8 | P value 8 |
|---|---|---|---|---|---|---|---|---|---|
| Employed | 0.284 | 0.285 | 0.906 | 0.194 | 0.179 | 0.0412 | 0.0809 | 0.0842 | 0.606 |
| Unemployed | 0.00102 | 0.00662 | 0.0132 | 0.00519 | 0.00675 | 0.321 | 0.00137 | 0.00092 | 0.529 |
| Retired/Disabled | 0.706 | 0.707 | 0.0.84 | 0.801 | 0.811 | 0.167 | 0.918 | 0.912 | 0.411 |
t-test results for risk behaviours.
| Variable | FEM 3 | ELSA 3 | P value 3 | FEM 5 | ELSA 5 | P value 5 | FEM 8 | ELSA 8 | P value 8 |
|---|---|---|---|---|---|---|---|---|---|
| BMI* | 28.4 | 28.0 | 0.0014 | ||||||
| Drinks Alcohol | 0.866 | 0.874 | 0.205 | 0.859 | 0.851 | 0.239 | 0.844 | 0.839 | 0.552 |
| Problem Drinker | 0.12 | 0 | 0 | 0.122 | 0.127 | 0.487 | 0.109 | 0.113 | 0.567 |
| Activity - Low | 0.0907 | 0.101 | 0.0426 | 0.099 | 0.13 | 0 | 0.112 | 0.129 | 0.0304 |
| Activity - Moderate | 0.164 | 0.162 | 0.739 | 0.168 | 0.181 | 0.0775 | 0.183 | 0.201 | 0.0508 |
| Activity - High | 0.745 | 0.736 | 0.231 | 0.733 | 0.689 | 0 | 0.706 | 0.669 | 0.00097 |
| Smoke Now | 0.132 | 0.143 | 0.0678 | 0.106 | 0.116 | 0.106 | 0.076 | 0.0708 | 0.391 |
| Smoke Ever | 0.637 | 0.628 | 0.279 | 0.639 | 0.648 | 0.322 | 0.638 | 0.658 | 0.0646 |
| Heavy Smoker | 0.0234 | 0.0297 | 0.906 | 0.0214 | 0.0229 | 0.595 | 0.0128 | 0.0136 | 0.761 |
-
*
ELSA only reports BMI information for even waves.
t-test results for mortality.
| Variable | FEM 3 | ELSA 3 | P value 3 | FEM 5 | ELSA 5 | P value 5 | FEM 8 | ELSA 8* | P value 8 |
|---|---|---|---|---|---|---|---|---|---|
| Died | 0.0294 | 0.0412 | 0.00033 | 0.0435 | 0.0602 | 0 | 0.0596 | 0 | 0 |
-
*
End of life interviews are only reporte for waves 2-6 (excluding wave 5). There is therefore no mortality informationfor waves 7 or 8.
Data and code availability
The English Longitudinal Study of Ageing is available at the UK Data Service website (www.ukdataservice.ac.uk). The data is available for scientific research only upon registration. The script to harmonise the data is publicly available from the Gateway to Global Aging Data (www.g2aging.org). Census data used for reweighting populations by sex, age, and educational attainment were freely obtained from both the Office of National Statistics (ONS) (www.ons.gov.uk) and nomisweb (www.nomisweb.co.uk) websites. To re-weight the initial populations by sex and age from 2002 to 2018, population estimate data was obtained from the nomisweb data query tool. For re-weighting from 2018 onwards, National Population Projections were used from the ONS, available at www.ons.gov.uk/peoplepopulationandcommunity/populationandmigration/populationprojections/datasets/z3zippedpopulationprojectionsdatafilesengland. Data used for re-weighting populations by highest level of education was again obtained from the ONS at www.ons.gov.uk/peoplepopulationandcommunity/educationandchildcare/adhocs/004283ct04692011censussexbyagebyhighestlevelofqualificationbynssecengland. The code used in the creation of this model is freely accessible on Github at the following link: github.com/ld-archer/E_FEM.