A Microsimulation Model for the Land Rental Market in Irish Farming
- Teagasc Rural Economy and Development Programme, Ireland
- Cork University Business School, Ireland
Figures

Description of the Agent-Based Model of the Agricultural Land Market

Market for Good Agricultural Land in South-West and Mid-West Region

Market for Good Agricultural Land in East Region

Market for Good Agricultural Land in BMW Region

Total Number of Agricultural Land Rental Transactions in Ireland Qualifying for Relief from Rental Income. Source: Revenue (2021)

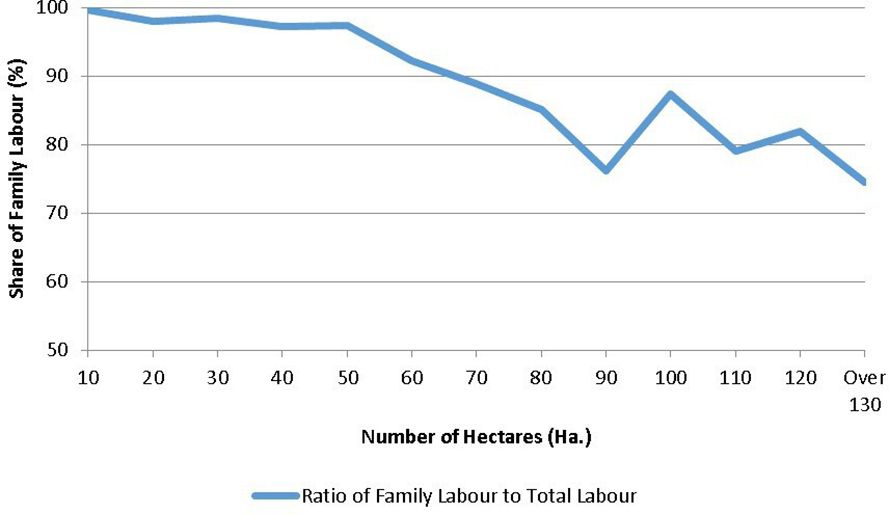
Share of Family Labour in Total Labour by Farm Size (Ha.). Source: Authors calculations using Teagasc National Farm Survey 2017**Tillage farms excluded
Tables
Summary Statistics for Six Regional Markets
| Region | Soil Quality | No. Farms | Weighted No. Farms | UAA (Ha.) | Rental Share |
|---|---|---|---|---|---|
| South-West, Mid-West | Good | 115 | 9,470 | 428,760 | 16.5% |
| East | Good | 194 | 17,400 | 822,733 | 21.9% |
| BMW | Good | 167 | 19,366 | 773,374 | 15.6% |
| BMW | Medium | 200 | 25,532 | 881,532 | 20.3% |
| South-West, Mid-West | Medium | 76 | 6,920 | 284,190 | 16.8% |
| East | Medium | 75 | 6,427 | 318,104 | 18.4% |
-
Source: Authors calculations using Teagasc National Farm Survey from 2017.
Rental Price Statistics for Six Regional Markets
| Region | Soil Quality | Median Rented Price (€) | 25th Percentile of Rented Price | 75th Percentile of Rented Price |
|---|---|---|---|---|
| South-West, Mid-West | Good | 362 | 250 | 441 |
| East | Good | 354 | 250 | 431 |
| BMW | Good | 252 | 209 | 355 |
| BMW | Medium | 223 | 150 | 291 |
| South-West, Mid-West | Medium | 314 | 240 | 410 |
| East | Medium | 250 | 222 | 357 |
-
Source: Authors calculations using Teagasc National Farm Survey from 2017.
Simulated Average Farm Size by System
| System | Average Farm Size (Ha.) | Average Farm Size [Post-Simulation] | Change in Farm Size (Ha.) |
|---|---|---|---|
| Dairying | 58.4 | 73.6 | 15.2 |
| Cattle | 33.5 | 27.6 | -5.9 |
| Sheep | 46.9 | 38.2 | -8.7 |
| Other | 73.7 | 83.5 | 9.8 |
| Tillage | 59.1 | 64.8 | 5.6 |
-
Source: Teagasc NFS 2017 and Author’s simulations using Teagasc NFS 2015-2017.
Simulated Share of Agricultural Land by System
| System | Initial Share | Share Post-Simulation | Percentage Change |
|---|---|---|---|
| Specialist Dairying | 24.0% | 31.5% | 7.4% |
| Cattle | 46.0% | 39.3% | -6.7% |
| Sheep | 17.1% | 14.4% | -2.6% |
| Other | 2.5% | 3.0% | 0.4% |
| Tillage | 10.3% | 11.8% | 1.4% |
Change in Average Farm Size by System 2017 to 2020
| System | Average Farm Size 2017 (Ha.) | Average Farm Size 2020 [Ha.] | Change in Farm Size (Ha.) | Average Farm Size 2020 [Ha.] | Change in Farm Size (Ha.) |
|---|---|---|---|---|---|
| 2017 Weights | 2020 Weights | ||||
| Dairying | 58.4 | 61.7 | 3.3 | 65.9 | 7.5 |
| Cattle | 33.5 | 33.6 | 0.1 | 31.5 | -2.0 |
| Sheep | 46.9 | 47.3 | 0.4 | 49.5 | 2.6 |
| Tillage | 59.1 | 61.7 | 2.6 | 73.2 | 14.1 |
-
Source: Teagasc NFS 2017 and 2020.
Total Agricultural Area by Farming System 2010-2020
| System | 2010 (Ha.) | 2020 (Ha.) | Change (Ha.) | Percentage Change | Percentage Change in Share of Land |
|---|---|---|---|---|---|
| Dairying | 865,666 | 997,267 | 131,601 | 15.2% | 3.2% |
| Cattle | 2,153,343 | 1,994,877 | -158,466 | -7.4% | -2.9% |
| Sheep | 417,494 | 503,872 | 86,378 | 20.7% | 2.0% |
| Tillage | 268,520 | 290,461 | 21,941 | 8.2% | 0.6% |
| Mixed Grazing Livestock | 527,622 | 381,158 | -146,464 | -27.8% | -3.1% |
| Mixed Crops And Livestock | 137,541 | 114,159 | -23,382 | -17.0% | -0.5% |
| Mixed Field Crops | 162,832 | 186,559 | 23,728 | 14.6% | 0.6% |
| Other | 33,038 | 37,077 | 4,039 | 12.2% | 0.1% |
-
Source: Censuses of Agriculture 2010 and 2020.
Farm Size Inequality by Group under Profit Maximisation
| Group | Region | Soil Type | Initial Gini Coefficient 2017 Data | Gini Coefficient [Simulation] | Gini Coefficient 2020 Data |
|---|---|---|---|---|---|
| 1 | South-West, Mid-West | Good | 35.8 | 45.0 | 36.8 |
| 2 | East | Good | 39.8 | 47.4 | 42.8 |
| 3 | BMW | Good | 36.2 | 50.8 | 42.7 |
| 4 | South-West, Mid-West | Medium | 31.7 | 48.9 | 37.4 |
| 5 | East | Medium | 32.4 | 49.9 | 38.1 |
| 6 | BMW | Medium | 32.4 | 41.8 | 38.0 |
Mid-Point Hectare Statistic by Group under Profit Maximisation
| Group | Region | Soil Type | Initial Midpoint Hectare | Midpoint Hectare [Post-Simulation] | Midpoint Hectare 2020 |
|---|---|---|---|---|---|
| 1 | South-West, Mid-West | Good | 58 | 73 | 67 |
| 2 | East | Good | 64 | 77 | 66 |
| 3 | BMW | Good | 45 | 67 | 59 |
| 4 | South-West, Mid-West | Medium | 47 | 72 | 50 |
| 5 | East | Medium | 62 | 91 | 64 |
| 6 | BMW | Medium | 40 | 46 | 41 |
Progressivity or Regressivity of Distribution in Post-Simulation
| Group | Region | Soil Type | Progressivity+ Regressivity- |
|---|---|---|---|
| 1 | South-West, Mid-West | Good | +0.047 |
| 2 | East | Good | -0.006 |
| 3 | BMW | Good | +0.013 |
| 4 | South-West, Mid-West | Medium | -0.059 |
| 5 | East | Medium | -0.059 |
| 6 | BMW | Medium | +0.029 |
Description of Soil Categories
| Soil Category | Description |
|---|---|
| Good Soils (Classes 1 and 2) | Soils of wide use range have no limitations which cannot be overcome by normal management practices or |
| Moderately wide use-range refers to soils with minor limitations such as coarse texture, moderately high altitude, less favourable climatic conditions, somewhat shallow depth, hummocky topography and somewhat weak structure. | |
| Medium Soils (Classes 3 and 4) | The somewhat limited use range category is used for soils with similar limitations to those of Class 2 but these are present to a greater degree. For example, soils with altitude limitations in this category usually occur between 150 m and 365 m, whereas those of the moderately wide use range with altitude limitations are at elevations mostly between 90 and 150 m |
| Soils in this category- are generally unsuited to tillage but suited to a permanent grassland system. The predominant limitation is poor drainage | |
| Poor Soils | This class contains those soils whose agricultural potential is greatly restricted. They are widespread in the western and north-western regions, particularly in the mountain zones where high altitude and steep slopes are major limitations. |
-
Source: Teagasc National Farm Survey
Assumptions of the ABM and Equilibrium Models
| ABM model | Equilibrium Model | |
|---|---|---|
| Time | Transactions take place under an iterative sequential process | Transactions occurring instantly at an equilibrium price |
| Price Determination | Bilateral negotiation between landowner and potential tenant with reference to prevailing rental prices | Rental prices are determined solely by aggregate supply and aggregate demand |
| Capitalisation of Direct Payments | 50 per cent of the value of direct payments are added to each bid and each reservation price | 50 per cent of the value of direct payments are added to each bid and each reservation price |
| Reservation prices | The landowner makes decisions with reference to a reservation price, below which the landowner will not release land to the market | The landowner makes decisions with reference to a reservation price, below which the landowner will not release land to the market |
| Farming System | Assumed that farms remain in their current farming system. | Assumed that farms remain in their current farming system. |
| Farm Size Limits | Limits on farm size growth can be enforced by a central authority at the regional or national level. | No assumptions to restrict farm size growth |
| Rental Share | The land rental market comes to a close when the land rental share in the region reaches 30 per cent. This prevents farm exits from occuring. | No assumptions around rental share and farm exits may occur |
| Bid Values | The recent history of farm profitability is used to form predictions about future profitability and these predictions underline the bids and reservation prices for particular land parcels. | The recent history of farm profitability is used to form predictions about future profitability and these predictions underline the bids and reservation prices for particular land parcels. |
| Costs of Scale | Decreasing returns to scale - Farmers who expand beyond a certain threshold are assumed to encounter additional costs associated with the purchase of new machinery, livestock and buildings. | Constant returns to scale |
| Initial State | We do not assume that the initial state of the land market is perfectly competitive. | |
| Land Tenure | Assume rented and owned land are farmed to the same profitability | Assume rented and owned land are farmed to the same profitability |
| Intermediary | Assumed that a market agent mediates between the land owner and tenant in negotiating each individual transaction | Walrasian auctioneer |
Data and code availability
The precise dataset cannot be published in an openly accessible trusted data repository. We therefore commit to preserving the dataset for a period of no less than five years following publication of the manuscript, and to providing reasonable assistance to requests for clarification and replication. The authors have precisely documented the source code so that other researchers can replicate the findings.The research is based on Teagasc National Farm survey data and researchers may access this data by completing a data access form on the ISSDA website at the following address https://www.ucd.ie/issda/data/teagascnationalfarmsurvey/.