Simulations of Policy Responses During the COVID-19 Crisis in Argentina: Effects on Socioeconomic Indicators
- Center for Distributive, Labor and Social Studies (CEDLAS). Institute of Economic Research of the Faculty of Economic Sciences at the National University of La Plata (UNLP), Argentina
Figures

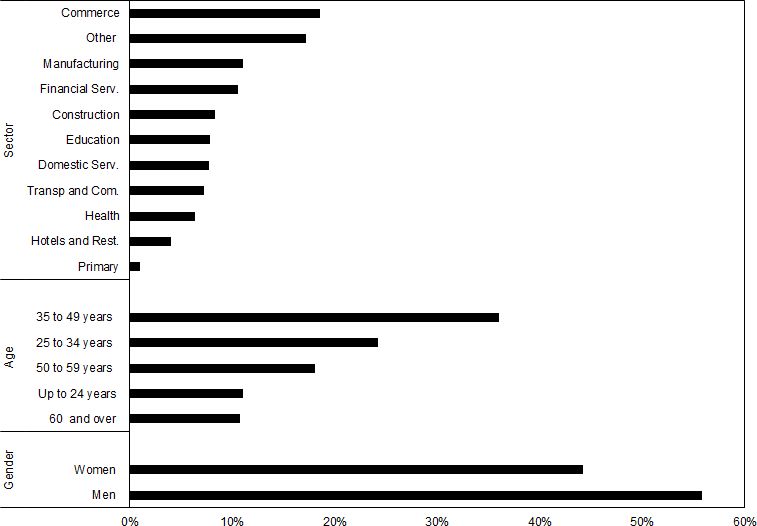
Pre-COVID-19 scenario. Distribution of workers by gender, age groups, and sectors.. Source: Authors’ own calculations based on Ministry of Labor, Employment and Social Security and INDEC. Notes: In percentage.

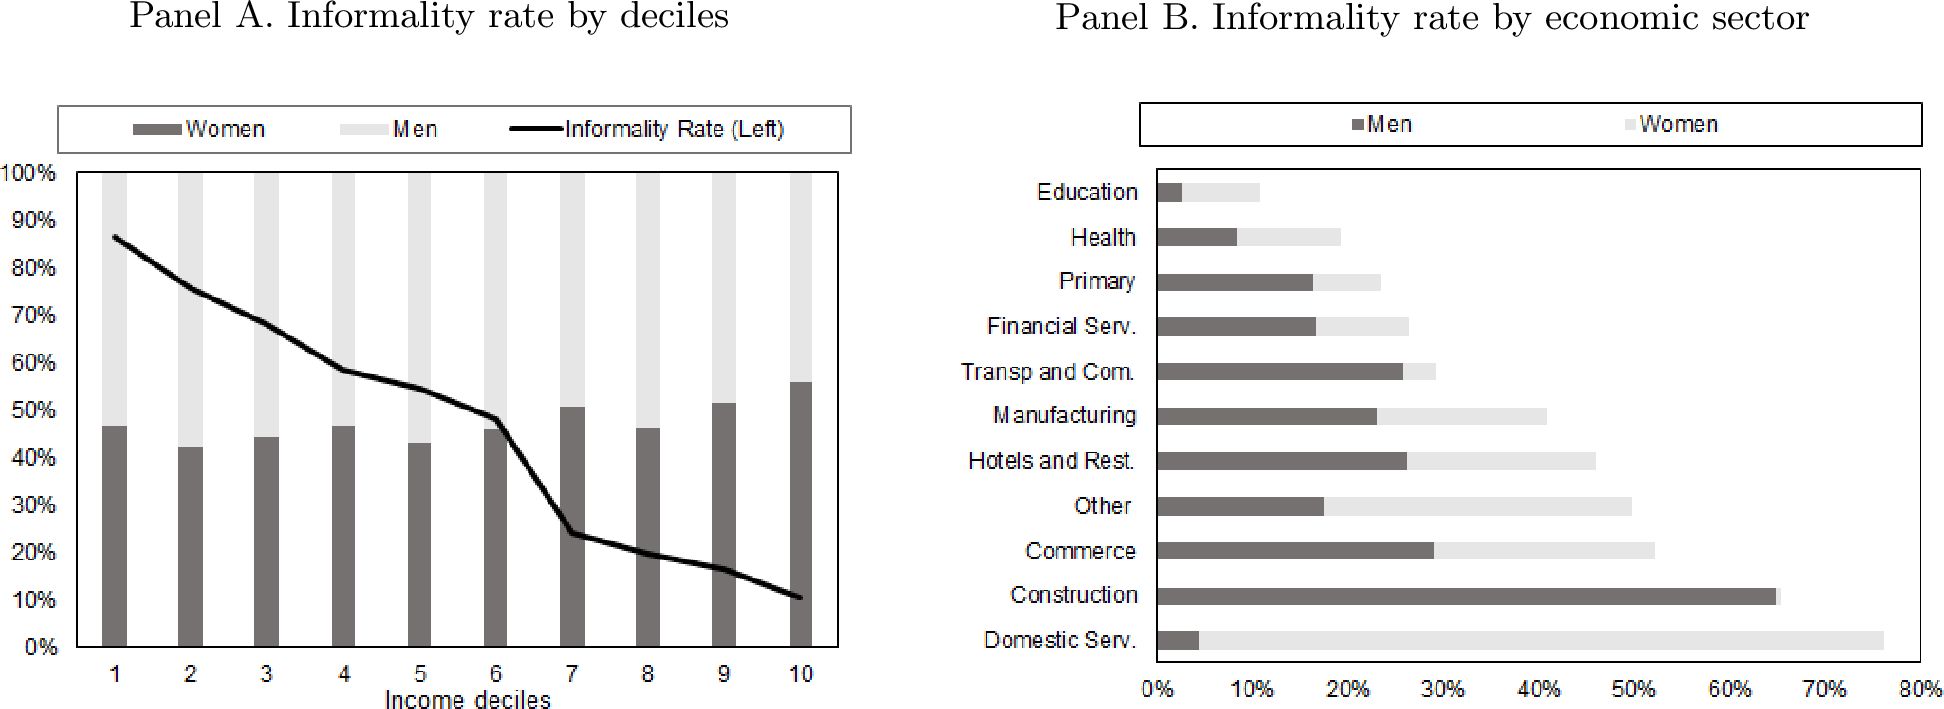
Pre-COVID-19 scenario. Share of informal workers by deciles, gender, and sectors.

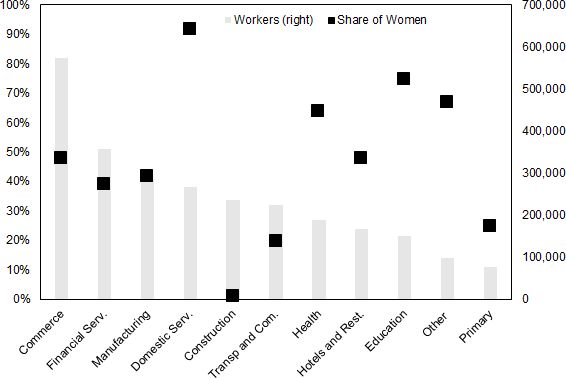
Post-COVID-19 scenario. Simulation of employment loss and relative participation of woman. By sectors.. Source: Authors’ own calculations based on Ministry of Labor, Employment and Social Security and INDEC. Notes: In thousands of workers and percentage. Second quarter of 2020.

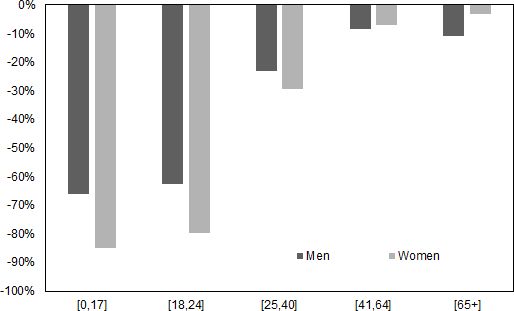
Post-COVID-19 scenario. Change on employment rate by age groups and gender.. Source: Authors’ own calculations based on Ministry of Labor, Employment and Social Security and INDEC. Notes: In percentage. Second quarter versus first quarter 2020.

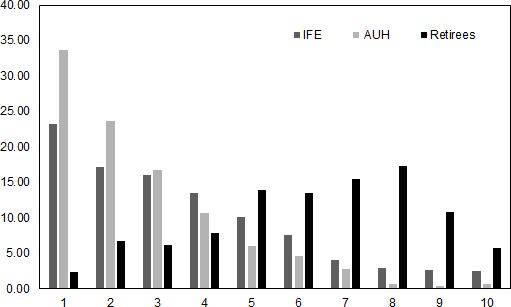
Distribution of public assistance beneficiaries.. Source: Authors’ own calculations based on EPH-INDEC. Notes: In percentage. By deciles of per capita income. Second quarter of 2020.
Tables
Average per capita income by deciles. Pre- and post-COVID-19 scenarios with and without policy responses.
| Pre-COVID-19 | Post-COVID-19 scenario (without policy responses) | Post-COVID-19 scenario (with policy responses) | |||||||||||
|---|---|---|---|---|---|---|---|---|---|---|---|---|---|
| 1st quarter 2020 | 1 quarter ahead | 2 quarters ahead | 3 quarters ahead | 1 quarter ahead | 2 quarters ahead | 3 quarters ahead | |||||||
| Decile | [1] | [2] | [3] | [4] | [5] | [6] | [7] | [8] | [9] | [10] | [11] | [12] | [13] |
| Level | Level | Level | Change [4] - [1] (in %) | Level | Change [6] - [2] (in %) | Level | Change [8] - [2] (in %) | Level | Change [10] - [1] (in %) | Level | Change [12] - [6] (in %) | ||
| 1 | 2841.8 | 1974.0 | 2396.1 | -15.69 | 2387.2 | 20.9 | 2842.7 | 44.0 | 3205.8 | 12.8 | 2977.3 | 24.7 | |
| 2 | 5822.4 | 4250.3 | 5004.4 | -14.05 | 4813.7 | 13.3 | 4924.5 | 15.9 | 5623.7 | -3.4 | 5272.9 | 9.5 | |
| 3 | 8189.0 | 6176.9 | 7258.7 | -11.36 | 6884.8 | 11.5 | 6762.2 | 9.5 | 7777.8 | -5.0 | 7216.8 | 4.8 | |
| 4 | 10367.5 | 7807.2 | 9200.6 | -11.26 | 8641.3 | 10.7 | 8294.3 | 6.2 | 9628.1 | -7.1 | 8882.4 | 2.8 | |
| 5 | 12978.9 | 10347.1 | 11763.7 | -9.36 | 11096.3 | 7.2 | 10769.7 | 4.1 | 12139.6 | -6.5 | 11302.5 | 1.9 | |
| 6 | 16019.6 | 12918.2 | 14818.0 | -7.50 | 13599.7 | 5.3 | 13262.0 | 2.7 | 15125.3 | -5.6 | 13778.4 | 1.3 | |
| 7 | 19789.5 | 16368.6 | 18590.6 | -6.06 | 17035.5 | 4.1 | 16628.7 | 1.6 | 18830.7 | -4.8 | 17201.9 | 1.0 | |
| 8 | 25037.3 | 21413.7 | 23702.7 | -5.33 | 21507.7 | 0.4 | 21645.3 | 1.1 | 23917.8 | -4.5 | 21648.2 | 0.7 | |
| 9 | 33516.6 | 28733.5 | 32248.0 | -3.78 | 28544.9 | -0.7 | 28899.3 | 0.6 | 32393.6 | -3.4 | 28632.5 | 0.3 | |
| 10 | 64559.5 | 54499.1 | 62174.1 | -3.69 | 53405.3 | -2.0 | 54617.7 | 0.2 | 62283.2 | -3.5 | 53458.7 | 0.1 | |
| All | 19914.0 | 16450.4 | 18717.4 | -6.01 | 16793.1 | 2.1 | 16866.1 | 2.5 | 19094.2 | -4.1 | 17038.6 | 1.5 | |
-
Source: Authors’ own calculations based on Ministry of Production and Labor and EPH-INDEC. Notes: In pesos and percentage change. Deciles of per capita income. Workers in Argentina benefit from a wage bonus, aguinaldos, that is paid twice a year in June and December. Therefore, they are registered and included in the first and third quarters of our simulations but not in the second and fourth ones. Thus, to provide an accurate comparison, the pre-COVID-19 scenario should be compared with the second-quarter-ahead scenario. This is valid for both the scenario with and without policy responses.
Average per capita income by economic sector. Pre- and post-COVID-19 scenarios with and without policy responses.
| Pre-COVID-19 | Post-COVID-19 scenario (without policy responses) | Post-COVID-19 scenario (with policy responses) | |||||||||||
|---|---|---|---|---|---|---|---|---|---|---|---|---|---|
| 1st quarter 2020 | 1 quarter ahead | 2 quarters ahead | 3 quarters ahead | 1 quarter ahead | 2 quarters ahead | 3 quarters ahead | |||||||
| Sector | [1] | [2] | [3] | [4] | [5] | [6] | [7] | [8] | [9] | [10] | [11] | [12] | [13] |
| Level | Level | Level | Change [4] - [1] (in %) | Level | Change [6] - [2] (in %) | Level | Change [8] - [2] (in %) | Level | Change [10] - [1] (in %) | Level | Change [12] - [6] (in %) | ||
| Primary activities | 35381.3 | 21090.5 | 30087.9 | -15.0 | 26230.8 | 24.4 | 21475.7 | 1.8 | 30381.8 | -14.1 | 26371.9 | 0.5 | |
| Manufacturing | 19020.6 | 15046.6 | 17550.6 | -7.7 | 15612.8 | 3.8 | 15475.1 | 2.8 | 17934.3 | -5.7 | 15805.1 | 1.2 | |
| Construction | 14493.5 | 11537.6 | 13414.3 | -7.4 | 12220.9 | 5.9 | 12143.8 | 5.3 | 13973.7 | -3.6 | 12508.1 | 2.3 | |
| Commerce | 18401.6 | 14723.3 | 17100.0 | -7.1 | 15525.3 | 5.4 | 15222.0 | 3.4 | 17555.6 | -4.6 | 15757.6 | 1.5 | |
| Hotels and rest. | 17049.4 | 12384.3 | 15147.9 | -11.2 | 13652.5 | 10.2 | 12929.2 | 4.4 | 15621.6 | -8.4 | 13863.4 | 1.5 | |
| Transp. and com. | 24533.3 | 19042.1 | 22514.4 | -8.2 | 19857.1 | 4.3 | 19379.4 | 1.8 | 22809.8 | -7.0 | 20001.7 | 0.7 | |
| Financial serv. | 28750.7 | 23060.5 | 26614.6 | -7.4 | 23550.0 | 2.1 | 23382.0 | 1.4 | 26895.2 | -6.5 | 23663.0 | 0.5 | |
| Education | 27983.4 | 23147.5 | 26406.0 | -5.6 | 22707.2 | -1.9 | 23274.8 | 0.5 | 26517.7 | -5.2 | 22749.4 | 0.2 | |
| Social-health serv. | 28959.7 | 24465.7 | 27630.8 | -4.6 | 23864.5 | -2.5 | 24641.0 | 0.7 | 27787.5 | -4.0 | 23940.1 | 0.3 | |
| Domestic serv. | 12080.5 | 9108.9 | 10891.3 | -9.8 | 9969.3 | 9.4 | 9935.1 | 9.1 | 11662.2 | -3.5 | 10285.2 | 3.2 | |
| Other serv. | 21463.2 | 17921.9 | 20225.8 | -5.8 | 18127.4 | 1.1 | 18367.1 | 2.5 | 20634.8 | -3.9 | 18318.0 | 1.1 | |
| All | 24460.2 | 19423.3 | 22737.1 | -7.0 | 19843.0 | 2.2 | 19819.1 | 2.0 | 23093.7 | -5.6 | 20004.7 | 0.8 | |
-
Source: Authors’ own calculations based on Ministry of Production and Labor and EPH-INDEC. Notes: In pesos and percentage change. Deciles of per capita income. Workers in Argentina benefit from a wage bonus, aguinaldos, that is paid twice a year in June and December. Therefore, they are registered and included in the first and third quarters of our simulations but not in the second and fourth ones. Thus, to provide an accurate comparison, the pre-COVID-19 scenario should be compared with the second-quarter-ahead scenario. This is valid for both the scenario with and without policy responses.
Poverty, inequality indicators, and number of poor by gender. Pre- and post-COVID-19 scenarios with and without policy responses.
| Pre-COVID-19 | Post-COVID-19 scenario (without policy responses) | Post-COVID-19 scenario (with policy responses) | ||||||||||||
|---|---|---|---|---|---|---|---|---|---|---|---|---|---|---|
| 1st quarter 2020 | 1 quarter ahead | 2 quarters ahead | 3 quarters ahead | 1 quarter ahead | 2 quarters ahead | 3 quarters ahead | ||||||||
| Sector | Group | [1] | [2] | [3] | [4] | [5] | [6] | [7] | [8] | [9] | [10] | [11] | [12] | [13] |
| Level | Level | Level | Change [4] - [1] (in %) | Level | Change [6] - [2] (in %) | Level | Change [8] - [2] (in %) | Level | Change [10] - [1] (in %) | Level | Change [12] - [6] (in %) | |||
| Panel A. Indigence, poverty, and inequality indicators | ||||||||||||||
| Extreme poverty | ||||||||||||||
| FGT (0) | 8.6 | 18.0 | 12.5 | 45.3 | 13.3 | -26.3 | 15.3 | -14.8 | 10.0 | 16.6 | 11.2 | -15.3 | ||
| FGT (1) | 3.2 | 10.1 | 6.1 | 90.9 | 6.1 | -40.3 | 7.1 | -30.4 | 4.1 | 28.9 | 4.8 | -20.2 | ||
| FGT (2) | 1.9 | 7.7 | 4.3 | 123.7 | 4.2 | -46.1 | 4.5 | -42.4 | 2.5 | 31.0 | 3.3 | -20.6 | ||
| Moderate poverty | ||||||||||||||
| FGT (0) | 34.6 | 45.6 | 39.2 | 13.5 | 43.3 | -5.2 | 43.8 | -4.0 | 37.3 | 7.9 | 42.0 | -3.0 | ||
| FGT (1) | 13.6 | 22.9 | 17.7 | 29.7 | 19.0 | -16.9 | 20.2 | -11.7 | 15.5 | 13.4 | 17.5 | -7.9 | ||
| FGT (2) | 7.6 | 15.6 | 11.1 | 46.0 | 11.6 | -25.5 | 12.6 | -18.9 | 8.9 | 17.7 | 10.2 | -12.0 | ||
| Inequality | ||||||||||||||
| Gini | 0.441 | 0.465 | 0.455 | 3.1 | 0.444 | -4.7 | 0.465 | -0.1 | 0.450 | 1.9 | 0.435 | -2.0 | ||
| Theil | 0.345 | 0.382 | 0.366 | 6.0 | 0.347 | -9.1 | 0.381 | -0.2 | 0.357 | 3.5 | 0.333 | -4.0 | ||
| ATK (0) | 0.000 | 0.000 | 0.000 | 0.000 | 0.000 | 0.000 | 0.000 | |||||||
| ATK (0.5) | 0.160 | 0.181 | 0.171 | 6.9 | 0.162 | -10.4 | 0.180 | -0.4 | 0.167 | 4.2 | 0.154 | -4.7 | ||
| ATK (1) | 0.300 | 0.347 | 0.323 | 7.9 | 0.306 | -11.8 | 0.344 | -0.8 | 0.315 | 5.1 | 0.289 | -5.5 | ||
| ATK (2) | 0.546 | 0.645 | 0.596 | 9.0 | 0.562 | -12.9 | 0.625 | -3.1 | 0.582 | 6.4 | 0.525 | -6.7 | ||
| Panel B. Poverty and inequality indicators, by gender | ||||||||||||||
| Moderate poverty | ||||||||||||||
| Poverty | Head male | 31.8 | 43.3 | 36.4 | 14.3 | 41.3 | -4.6 | 41.4 | -4.5 | 34.3 | 8.0 | 40.2 | -2.9 | |
| Incidence | Head female | 38.6 | 49.0 | 43.4 | 12.5 | 46.1 | -5.9 | 47.4 | -3.4 | 41.6 | 7.9 | 44.6 | -5.9 | |
| Population | 34.6 | 45.6 | 39.2 | 13.5 | 43.3 | -5.2 | 43.8 | -4.0 | 37.3 | 7.9 | 42.0 | -4.2 | ||
| Inequality | ||||||||||||||
| Gini | Head male | 0.429 | 0.444 | 0.439 | 2.4 | 0.428 | -3.5 | 0.446 | 0.3 | 0.435 | 1.4 | 0.420 | -5.6 | |
| Head female | 0.458 | 0.496 | 0.478 | 4.2 | 0.465 | -6.2 | 0.492 | -0.9 | 0.470 | 2.5 | 0.454 | -7.6 | ||
| Population | 0.441 | 0.465 | 0.455 | 3.1 | 0.444 | -4.7 | 0.465 | -0.1 | 0.450 | 1.9 | 0.435 | -6.5 | ||
| Panel C. Number of poor | ||||||||||||||
| Head male | 5,376,778 | 7,324,550 | 6,147,894 | 771,116 | 6,986,696 | -337,854 | 6,997,154 | -327,396 | 5,804,325 | 427,547 | 6,795,035 | -191,661 | ||
| Head female | 4,489,291 | 5,698,983 | 5,045,405 | 556,114 | 5,365,024 | -333,959 | 5,505,334 | -193,649 | 4,841,836 | 352,545 | 5,181,325 | -183,699 | ||
| Population | 9,866,069 | 13,023,533 | 11,193,299 | 1,327,230 | 12,351,720 | -671,813 | 12,502,488 | -521,045 | 10,646,161 | 780,092 | 11,976,360 | -375,360 | ||
-
Source: Authors’ own calculations based on Ministry of Production and Labor and EPH-INDEC. Notes: Workers in Argentina benefit from a wage bonus, aguinaldos, that is paid twice a year in June and December. Therefore, they are registered and included in the first and third quarters of our simulations but not in the second and fourth ones. Thus, to provide an accurate comparison, the pre-COVID-19 scenario should be compared with the second-quarter-ahead scenario. This is valid for both the scenario with and without policy responses.
Employment and wage variations.
| Employment variations | ||||||
|---|---|---|---|---|---|---|
| Sector | 1q ahead | 2q ahead | 3q ahead | |||
| Formal | Informal | Formal | Informal | Formal | Informal | |
| Primary | -0.63 | -0.90 | -0.36 | -0.52 | -0.30 | -0.43 |
| Manufacturing | -0.18 | -0.33 | -0.10 | -0.19 | -0.08 | -0.16 |
| Construction | -0.17 | -0.27 | -0.10 | -0.15 | -0.08 | -0.13 |
| Commerce | -0.12 | -0.44 | -0.07 | -0.25 | -0.06 | -0.21 |
| Hotels and rest. | -0.31 | -0.45 | -0.18 | -0.26 | -0.15 | -0.21 |
| Transp. and com. | -0.19 | -0.44 | -0.11 | -0.25 | -0.09 | -0.21 |
| Financial serv. | -0.25 | -0.44 | -0.14 | -0.26 | -0.12 | -0.21 |
| Education | -0.28 | -0.72 | -0.16 | -0.42 | -0.13 | -0.34 |
| Health | -0.17 | -0.58 | -0.10 | -0.33 | -0.08 | -0.27 |
| Domestic serv. | -0.24 | -0.29 | -0.14 | -0.17 | -0.11 | -0.14 |
| Other | -0.12 | -0.33 | -0.07 | -0.19 | -0.06 | -0.15 |
| Average | -0.24 | -0.47 | -0.14 | -0.27 | -0.11 | -0.22 |
| Wage variations | ||||||
| Formal | Informal | Formal | Informal | Formal | Informal | |
| -0.0034 | 0.02 | 0.05 | 0.13 | 0.16 | 0.25 | |
-
Source: Authors’ own calculations based on Ministry of Production and Labor and EPH-INDEC. Notes: We assume zero variations on public employment. For wage variations, we use the same criteria than for the rest of employees (INDEC). These are, for each quarter, 1,95 percent, 7.19 percent, and 15.22 percent, respectively.
Logistic regression on the probability of being employed: Formal and informal workers.
| Pr (employed=1) | ||
|---|---|---|
| Formal | Informal | |
| Gender (male==1) | 1.307*** | 1.275*** |
| (0.344) | (0.317) | |
| Age | 0.212*** | 0.0964*** |
| (0.0157) | (0.0135) | |
| Age2 | -0.00198*** | -0.000818*** |
| (0.000184) | (0.000165) | |
| Incomplete primary | -0.265 | -0.891 |
| (0.976) | (0.804) | |
| Complete primary | 0.496 | -0.561 |
| (0.925) | (0.782) | |
| Incomplete secondary | 0.334 | -0.773 |
| (0.918) | (0.776) | |
| Complete secondary | 0.637 | -0.86 |
| (0.915) | (0.774) | |
| Incomplete tertiary | 0.406 | -0.897 |
| (0.917) | (0.776) | |
| Complete tertiary | 1.053 | -1.14 |
| (0.904) | (0.763) | |
| Head of HH | 0.845*** | 0.484*** |
| (0.121) | (0.104) | |
| # of children | 0.237** | 0.127 |
| (0.111) | (0.0968) | |
| Marriage status | 0.627*** | 0.368*** |
| (0.0796) | (0.0674) | |
| # HH members | 0.156*** | 0.0783*** |
| (0.0231) | (0.0177) | |
| HH per capita income (log) | 2.013*** | 0.552*** |
| (0.062) | (0.0439) | |
| Observations | 11,656 | 8,478 |
| R2 | 0.3613 | 0.0645 |
-
Source: Authors’ own estimates based on the Permanent Household Survey (EPH). Notes: Robust standard errors are in parentheses. Statistical significance *** p < 0.01, ** p < 0.05, * p < 0.1. Interaction terms and intercept are included but not reported for briefness.
Employment by gender. Pre-COVID-19 (1st quarter of 2020) versus Post-COVID-19 (2nd quarter of 2020). Number of employed people and percentage change.
| 1st quarter 2020 | 2nd quarter 2020 | Change | |||||||
|---|---|---|---|---|---|---|---|---|---|
| Level | Level | % | |||||||
| Male | Female | All | Male | Female | All | Male | Female | All | |
| Primary | 91,750 | 29,883 | 121,633 | 34,636 | 10,945 | 45,581 | -62.2 | -63.4 | -62.5 |
| Manufacturing | 874,726 | 451,827 | 1,326,553 | 708,487 | 332,908 | 1,041,395 | -19.0 | -26.3 | -21.5 |
| Construction | 1,044,273 | 22,001 | 1,066,274 | 810,563 | 19,909 | 830,472 | -22.4 | -9.5 | -22.1 |
| Commerce | 1,311,071 | 883,783 | 2,194,854 | 1,012,360 | 608,865 | 1,621,225 | -22.8 | -31.1 | -26.1 |
| Hotels and rest. | 278,457 | 183,943 | 462,400 | 191,980 | 104,309 | 296,289 | -31.1 | -43.3 | -35.9 |
| Transp. and com. | 778,999 | 135,834 | 914,833 | 598,012 | 91,637 | 689,649 | -23.2 | -32.5 | -24.6 |
| Financial serv. | 783,739 | 528,898 | 1,312,637 | 566,354 | 389,737 | 956,091 | -27.7 | -26.3 | -27.2 |
| Education | 239,797 | 735,108 | 974,905 | 201,445 | 623,182 | 824,627 | -16.0 | -15.2 | -15.4 |
| Health | 1,033,530 | 1,123,807 | 2,157,337 | 965,203 | 1,004,377 | 1,969,580 | -6.6 | -10.6 | -8.7 |
| Domestic serv. | 47,380 | 942,717 | 990,097 | 24,948 | 697,099 | 722,047 | -47.3 | -26.1 | -27.1 |
| Other | 246,806 | 276,809 | 523,615 | 214,327 | 211,890 | 426,217 | -13.2 | -23.5 | -18.6 |
| Total | 6,730,528 | 5,314,610 | 12,045,138 | 5,328,315 | 4,094,858 | 9,423,173 | -20.8 | -23.0 | -21.8 |
-
Source: Authors’ own estimates based on Permanent Household Survey (EPH). Notes: The table includes all types of employment (public, private, and self-employment).
Average per capita income by deciles and by gender. Pre- and post-COVID-19 scenarios with and without policy responses. In pesos and percentage change.
| Pre-COVID-19 | Post-COVID-19 scenario (without policy responses) | Post-COVID-19 scenario (with policy responses) | ||||||||||||
|---|---|---|---|---|---|---|---|---|---|---|---|---|---|---|
| 1st quarter 2020 | 1 quarter ahead | 2 quarters ahead | 3 quarters ahead | 1 quarter ahead | 2 quarters ahead | 3 quarters ahead | ||||||||
| Decil | Group | [1] | [2] | [3] | [4] | [5] | [6] | [7] | [8] | [9] | [10] | [11] | [12] | [13] |
| Level | Level | Level | Change[4] - [1](in %) | Level | Change[6] - [2](in %) | Level | Change [8] - [2](in %) | Level | Change [10] - [1](in %) | Level | Change [12] - [6] (in %) | |||
| 1 | Head male | 2876.8 | 2019.1 | 2386.4 | -17.05 | 2382.7 | 18.0 | 2812.6 | 39.3 | 3114.0 | 8.2 | 2856.4 | 19.9 | |
| Head female | 2810.4 | 1933.5 | 2404.7 | -14.43 | 2391.3 | 23.7 | 2869.8 | 48.4 | 3288.3 | 17.0 | 3085.9 | 29.1 | ||
| Decile | 2841.8 | 1974.0 | 2396.1 | -15.69 | 2387.2 | 20.9 | 2842.7 | 44.0 | 3205.8 | 12.8 | 2977.3 | 24.7 | ||
| 2 | Head male | 5881.1 | 4534.6 | 5227.2 | -11.12 | 5008.1 | 10.4 | 5173.8 | 14.1 | 5795.6 | -1.5 | 5413.6 | 8.1 | |
| Head female | 5754.5 | 3920.8 | 4746.2 | -17.52 | 4588.4 | 17.0 | 4635.6 | 18.2 | 5424.5 | -5.7 | 5109.7 | 11.4 | ||
| Decile | 5822.4 | 4250.3 | 5004.4 | -14.05 | 4813.7 | 13.3 | 4924.5 | 15.9 | 5623.7 | -3.4 | 5272.9 | 9.5 | ||
| 3 | Head male | 8223.8 | 6429.1 | 7382.5 | -10.23 | 6966.7 | 8.4 | 7001.6 | 8.9 | 7889.2 | -4.1 | 7301.9 | 4.8 | |
| Head female | 8138.5 | 5810.2 | 7078.7 | -13.02 | 6765.8 | 16.4 | 6414.1 | 10.4 | 7615.7 | -6.4 | 7093.1 | 4.8 | ||
| Decile | 8189.0 | 6176.9 | 7258.7 | -11.36 | 6884.8 | 11.5 | 6762.2 | 9.5 | 7777.8 | -5.0 | 7216.8 | 4.8 | ||
| 4 | Head male | 10352.4 | 7943.7 | 9356.1 | -9.62 | 8676.8 | 9.2 | 8400.7 | 5.8 | 9757.7 | -5.7 | 8876.9 | 2.3 | |
| Head female | 10389.5 | 7609.1 | 8974.6 | -13.62 | 8589.7 | 12.9 | 8139.7 | 7.0 | 9439.9 | -9.1 | 8890.4 | 3.5 | ||
| Decile | 10367.5 | 7807.2 | 9200.6 | -11.26 | 8641.3 | 10.7 | 8294.3 | 6.2 | 9628.1 | -7.1 | 8882.4 | 2.8 | ||
| 5 | Head male | 12904.4 | 10491.4 | 11875.5 | -7.97 | 11122.0 | 6.0 | 10852.8 | 3.4 | 12204.3 | -5.4 | 11323.5 | 1.8 | |
| Head female | 13082.1 | 10147.3 | 11608.8 | -11.26 | 11060.8 | 9.0 | 10654.5 | 5.0 | 12050.0 | -7.9 | 11273.4 | 1.9 | ||
| Decile | 12978.9 | 10347.1 | 11763.7 | -9.36 | 11096.3 | 7.2 | 10769.7 | 4.1 | 12139.6 | -6.5 | 11302.5 | 1.9 | ||
| 6 | Head male | 16017.4 | 13231.7 | 14856.3 | -7.25 | 13547.2 | 2.4 | 13519.3 | 2.2 | 15123.6 | -5.6 | 13710.4 | 1.2 | |
| Head female | 16023.9 | 12326.6 | 14745.6 | -7.98 | 13698.8 | 11.1 | 12776.4 | 3.6 | 15128.6 | -5.6 | 13906.7 | 1.5 | ||
| Decile | 16019.6 | 12918.2 | 14818.0 | -7.50 | 13599.7 | 5.3 | 13262.0 | 2.7 | 15125.3 | -5.6 | 13778.4 | 1.3 | ||
| 7 | Head male | 19768.0 | 16373.9 | 18662.9 | -5.59 | 17113.0 | 4.5 | 16612.0 | 1.5 | 18883.1 | -4.5 | 17261.5 | 0.9 | |
| Head female | 19819.5 | 16361.2 | 18490.0 | -6.71 | 16927.5 | 3.5 | 16651.9 | 1.8 | 18757.7 | -5.4 | 17118.9 | 1.1 | ||
| Decile | 19789.5 | 16368.6 | 18590.6 | -6.06 | 17035.5 | 4.1 | 16628.7 | 1.6 | 18830.7 | -4.8 | 17201.9 | 1.0 | ||
| 8 | Head male | 24920.4 | 21226.2 | 23533.0 | -5.57 | 21187.1 | -0.2 | 21430.0 | 1.0 | 23721.8 | -4.8 | 21320.8 | 0.6 | |
| Head female | 25243.5 | 21744.7 | 24002.2 | -4.92 | 22073.2 | 1.5 | 22025.2 | 1.3 | 24263.6 | -3.9 | 22225.9 | 0.7 | ||
| Decile | 25037.3 | 21413.7 | 23702.7 | -5.33 | 21507.7 | 0.4 | 21645.3 | 1.1 | 23917.8 | -4.5 | 21648.2 | 0.7 | ||
| 9 | Head male | 33505.8 | 28632.5 | 32187.2 | -3.94 | 28267.5 | -1.3 | 28791.9 | 0.6 | 32330.1 | -3.5 | 28354.1 | 0.3 | |
| Head female | 33536.6 | 28922.2 | 32361.5 | -3.50 | 29063.2 | 0.5 | 29100.1 | 0.6 | 32512.2 | -3.1 | 29152.7 | 0.3 | ||
| Decile | 33516.6 | 28733.5 | 32248.0 | -3.78 | 28544.9 | -0.7 | 28899.3 | 0.6 | 32393.6 | -3.4 | 28632.5 | 0.3 | ||
| 10 | Head male | 64176.4 | 53944.6 | 61847.3 | -3.63 | 52654.1 | -2.4 | 54050.2 | 0.2 | 61947.0 | -3.5 | 52708.0 | 0.1 | |
| Head female | 65193.7 | 55416.9 | 62714.9 | -3.80 | 54648.5 | -1.4 | 55557.0 | 0.3 | 62839.6 | -3.6 | 54701.1 | 0.1 | ||
| Decile | 64559.5 | 54499.1 | 62174.1 | -3.69 | 53405.3 | -2.0 | 54617.7 | 0.2 | 62283.2 | -3.5 | 53458.7 | 0.1 | ||
| All | Head male | 20717.0 | 17218.3 | 19557.8 | -5.60 | 17406.4 | 1.1 | 17583.7 | 2.1 | 19888.1 | -4.0 | 17616.4 | 1.2 | |
| Head female | 18746.6 | 15334.1 | 17495.6 | -6.67 | 15901.6 | 3.7 | 15823.0 | 3.2 | 17940.1 | -4.3 | 16198.6 | 1.9 | ||
| Population | 19914.0 | 16450.4 | 18717.4 | -6.01 | 16793.1 | 2.1 | 16866.1 | 2.5 | 19094.2 | -4.1 | 17038.6 | 1.5 | ||
-
Source: Authors’ own calculations based on Ministry of Production and Labor and EPH-INDEC. Notes: Workers in Argentina benefit from a wage bonus, aguinaldos, that is paid twice a year in June and December. Therefore, they are registered and included in the first and third quarters of our simulations but not in the second and fourth ones. Thus, to provide an accurate comparison, the pre-COVID-19 scenario should be compared with the second-quarter-ahead scenario. This is valid for both the scenario with and without policy responses.
Average per capita income by economic sector and by gender. Pre- and post-COVID-19 scenarios with and without policy responses. In pesos and percentage change.
| Pre-COVID-19 | Post-COVID-19 scenario (without policy responses) | Post-COVID-19 scenario (with policy responses) | ||||||||||||
|---|---|---|---|---|---|---|---|---|---|---|---|---|---|---|
| 1st quarter 2020 | 1 quarter ahead | 2 quarters ahead | 3 quarters ahead | 1 quarter ahead | 2 quarters ahead | 3 quarters ahead | ||||||||
| Sector | Group | [1] | [2] | [3] | [4] | [5] | [6] | [7] | [8] | [9] | [10] | [11] | [12] | [13] |
| Level | Level | Level | Change [4] - [1] (in %) | Level | Change [6] - [2] (in %) | Level | Change [8] - [2] (in %) | Level | Change [10] - [1] (in %) | Level | Change [12] - [6] (in %) | |||
| Primary act. | Head male | 36813.8 | 22837.4 | 32161.1 | -12.6 | 27830.7 | 21.9 | 23202.8 | 1.6 | 32424.3 | -11.9 | 27945.6 | 0.4 | |
| Head female | 30860.1 | 15576.9 | 23544.3 | -23.7 | 21181.2 | 36.0 | 16024.4 | 2.9 | 23934.9 | -22.4 | 21405.0 | 1.1 | ||
| Sector | 35381.3 | 21090.5 | 30087.9 | -15.0 | 26230.8 | 24.4 | 21475.7 | 1.8 | 30381.8 | -14.1 | 26371.9 | 0.5 | ||
| Manufac- turing | Head male | 19989.8 | 16026.3 | 18621.2 | -6.8 | 16331.7 | 1.9 | 16396.8 | 2.3 | 18954.0 | -5.2 | 16485.8 | 0.9 | |
| Head female | 17260.7 | 13267.5 | 15606.6 | -9.6 | 14307.4 | 7.8 | 13801.5 | 4.0 | 16082.7 | -6.8 | 14568.9 | 1.8 | ||
| Sector | 19020.6 | 15046.6 | 17550.6 | -7.7 | 15612.8 | 3.8 | 15475.1 | 2.8 | 17934.3 | -5.7 | 15805.1 | 1.2 | ||
| Constru- ction | Head male | 14908.3 | 12140.8 | 13967.8 | -6.3 | 12659.0 | 4.3 | 12779.0 | 5.3 | 14558.4 | -2.3 | 12928.4 | 2.1 | |
| Head female | 13641.8 | 10299.1 | 12277.8 | -10.0 | 11321.5 | 9.9 | 10839.4 | 5.2 | 12773.2 | -6.4 | 11645.0 | 2.9 | ||
| Sector | 14493.5 | 11537.6 | 13414.3 | -7.4 | 12220.9 | 5.9 | 12143.8 | 5.3 | 13973.7 | -3.6 | 12508.1 | 2.3 | ||
| Commerce | Head male | 18750.6 | 15335.0 | 17579.7 | -6.2 | 15853.3 | 3.4 | 15799.7 | 3.0 | 18006.8 | -4.0 | 16066.3 | 1.3 | |
| Head female | 17827.3 | 13716.8 | 16310.7 | -8.5 | 14985.7 | 9.3 | 14271.4 | 4.0 | 16813.1 | -5.7 | 15249.8 | 1.8 | ||
| Sector | 18401.6 | 14723.3 | 17100.0 | -7.1 | 15525.3 | 5.4 | 15222.0 | 3.4 | 17555.6 | -4.6 | 15757.6 | 1.5 | ||
| Hotels and rest. | Head male | 17423.5 | 13116.4 | 15739.9 | -9.7 | 14196.0 | 8.2 | 13640.7 | 4.0 | 16204.1 | -7.0 | 14368.0 | 1.2 | |
| Head female | 16560.2 | 11427.0 | 14373.7 | -13.2 | 12941.8 | 13.3 | 11998.8 | 5.0 | 14859.8 | -10.3 | 13203.5 | 2.0 | ||
| Sector | 17049.4 | 12384.3 | 15147.9 | -11.2 | 13652.5 | 10.2 | 12929.2 | 4.4 | 15621.6 | -8.4 | 13863.4 | 1.5 | ||
| Tran. and com. | Head male | 24247.9 | 19141.4 | 22432.7 | -7.5 | 19678.4 | 2.8 | 19477.1 | 1.8 | 22731.1 | -6.3 | 19824.2 | 0.7 | |
| Head female | 25173.4 | 18819.4 | 22697.5 | -9.8 | 20257.9 | 7.6 | 19160.1 | 1.8 | 22986.2 | -8.7 | 20399.6 | 0.7 | ||
| Sector | 24533.3 | 19042.1 | 22514.4 | -8.2 | 19857.1 | 4.3 | 19379.4 | 1.8 | 22809.8 | -7.0 | 20001.7 | 0.7 | ||
| Financial serv. | Head male | 29727.0 | 24441.8 | 27713.6 | -6.8 | 24574.5 | 0.5 | 24728.0 | 1.2 | 27967.8 | -5.9 | 24683.9 | 0.4 | |
| Head female | 26969.8 | 20540.5 | 24609.8 | -8.8 | 21681.1 | 5.6 | 20926.5 | 1.9 | 24938.6 | -7.5 | 21800.6 | 0.6 | ||
| Sector | 28750.7 | 23060.5 | 26614.6 | -7.4 | 23550.0 | 2.1 | 23382.0 | 1.4 | 26895.2 | -6.5 | 23663.0 | 0.5 | ||
| Education | Head male | 28563.8 | 23565.4 | 26985.3 | -5.5 | 22982.5 | -2.5 | 23658.5 | 0.4 | 27069.8 | -5.2 | 23015.4 | 0.1 | |
| Head female | 27261.2 | 22627.4 | 25685.2 | -5.8 | 22364.7 | -1.2 | 22797.2 | 0.8 | 25830.7 | -5.2 | 22418.4 | 0.2 | ||
| Sector | 27983.4 | 23147.5 | 26406.0 | -5.6 | 22707.2 | -1.9 | 23274.8 | 0.5 | 26517.7 | -5.2 | 22749.4 | 0.2 | ||
| Soc. and health | Head male | 30351.3 | 25821.1 | 29034.2 | -4.3 | 25062.0 | -2.9 | 25963.8 | 0.6 | 29162.2 | -3.9 | 25120.4 | 0.2 | |
| Head female | 26952.0 | 22510.3 | 25606.0 | -5.0 | 22136.8 | -1.7 | 22732.7 | 1.0 | 25804.1 | -4.3 | 22237.4 | 0.5 | ||
| Sector | 28959.7 | 24465.7 | 27630.8 | -4.6 | 23864.5 | -2.5 | 24641.0 | 0.7 | 27787.5 | -4.0 | 23940.1 | 0.3 | ||
| Domestic serv. | Head male | 12683.2 | 9882.2 | 11586.0 | -8.7 | 10526.5 | 6.5 | 10427.7 | 5.5 | 12094.6 | -4.6 | 10771.9 | 2.3 | |
| Head female | 11652.9 | 8560.4 | 10398.5 | -10.8 | 9574.0 | 11.8 | 9585.7 | 12.0 | 11355.6 | -2.6 | 9939.9 | 3.8 | ||
| Sector | 12080.5 | 9108.9 | 10891.3 | -9.8 | 9969.3 | 9.4 | 9935.1 | 9.1 | 11662.2 | -3.5 | 10285.2 | 3.2 | ||
| Other serv. | Head male | 21020.8 | 17336.8 | 19808.2 | -5.8 | 17438.2 | 0.6 | 17710.4 | 2.2 | 20149.1 | -4.1 | 17577.5 | 0.8 | |
| Head female | 22221.4 | 18924.4 | 20941.3 | -5.8 | 19308.4 | 2.0 | 19492.4 | 3.0 | 21467.2 | -3.4 | 19586.9 | 1.4 | ||
| Sector | 21463.2 | 17921.9 | 20225.8 | -5.8 | 18127.4 | 1.1 | 18367.1 | 2.5 | 20634.8 | -3.9 | 18318.0 | 1.1 | ||
| All | Head male | 24977.5 | 20058.8 | 23392.5 | -6.3 | 20294.4 | 1.2 | 20405.7 | 1.7 | 23705.5 | -5.1 | 20434.2 | 0.7 | |
| Head female | 23659.2 | 18439.3 | 21722.3 | -8.2 | 19144.0 | 3.8 | 18910.9 | 2.6 | 22146.5 | -6.4 | 19339.6 | 1.0 | ||
| All Sectors | 24460.2 | 19423.3 | 22737.1 | -7.0 | 19843.0 | 2.2 | 19819.1 | 2.0 | 23093.7 | -5.6 | 20004.7 | 0.8 | ||
-
Source: Authors’ own calculations based on Ministry of Production and Labor and EPH-INDEC. Notes: Workers in Argentina benefit from a wage bonus, aguinaldos, that is paid twice a year in June and December. Therefore, they are registered and included in the first and third quarters of our simulations but not in the second and fourth ones. Thus, to provide an accurate comparison, the pre-COVID-19 scenario should be compared with the second-quarter-ahead scenario. This is valid for the scenario with and without the policy response.
Data and code availability
The paper was entirely made with public data. Both the data and the code are available. Please contact the corresponding author to request the code and the data