The Baby Boomers Revisited
- NATSEM, University of Canberra, Australia. This article has originally appeared as part of the AMP.NATSEM Income and Wealth Report, Issue 16, March 2007.
Figures

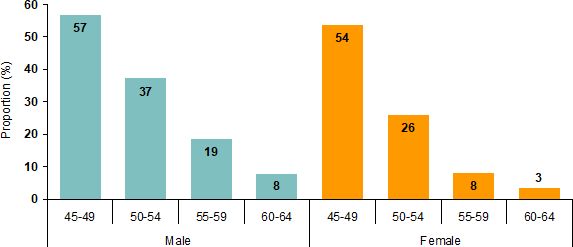
Proportions of baby boomers living with dependent children, by gender, 2004. Note: ‘Baby boomers’ is defined colloquially here as persons aged 45 to 64 years.Data source: ABS 2003-04 Survey of Income and Housing unit record data.

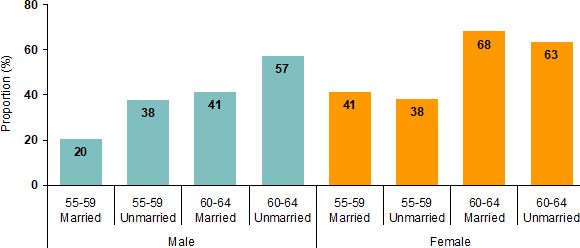
Proportions of baby boomers who have retired, by age, gender and marital status, 2004. Note: ‘Baby boomers’ is colloquially defined here as persons aged 45 to 64 years. ‘Retired’ is defined here as those who are not in the labour force.Data source: ABS 2003-04 Survey of Income and Housing unit record data.

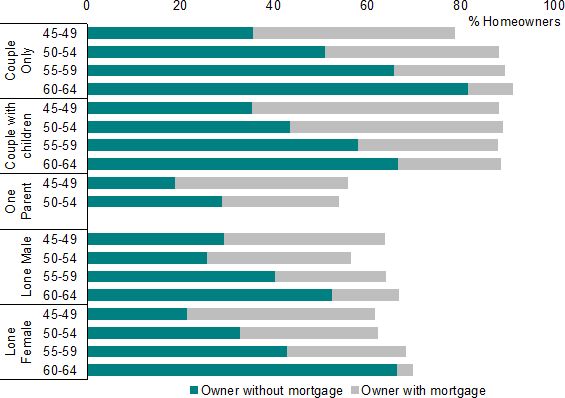
Proportions of baby boomer home-owning households, by age and household type, 2004. Notes: Mixed households (for example two-family or group households) are excluded from the data above. The sample sizes were too small to provide reliable estimates for one parent households with the reference person aged 55+ and this group has been excluded from the table above. ‘Baby boomer’ households is colloquially defined here as those with a reference person aged 45 to 64 years.Data source: ABS 2003-04 Survey of Income and Housing unit record data (reproduced in Table A1).
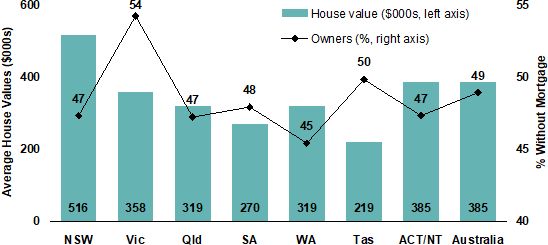
Proportions of baby boomer households that own their home without a mortgage and house values by state/territory, 2004. Notes: Mixed households (for example two-family or group) are excluded. ‘Baby boomer households’ is colloquially defined here as those with a head aged 45 to 64 years. Average house values are for all baby boomer home owners, not just those who own their home outright.Data source: ABS 2003-04 Survey of Income and Housing unit record data.

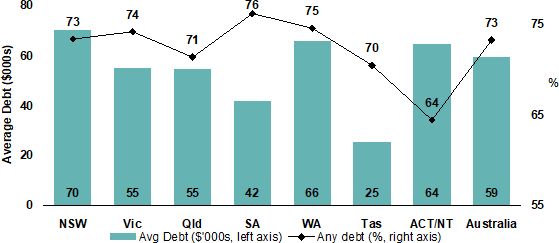
Proportions of baby boomer households that have any form of debt and average amount of debt, by state/territory, 2004. Notes: Mixed households (for example two-family or group households) are excluded. ‘Baby boomer’ households are colloquially defined here as those with a reference person aged 45 to 64 years.Data source: ABS 2003-04 Survey of Income and Housing unit record data.
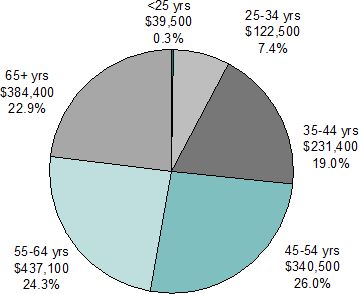
Average per adult net worth and share of total household net wealth held, by age of household head, 2004. Notes: Mixed households (for example two-family or group households) are excluded from this analysis. A definition of ‘net worth’ is provided in the technical notes. The percentages in the figure are shares of total wealth. Looking at population shares rather than wealth shares, 3% of adults (excluding dependent children) live in a household headed by a person under 25 years of age, 17% in a household headed by a 25-34 year old, 23% by a 35-44 year old, 22% by a 45-54 year old, 16% by a 55 to 64 year old, and 19% by a 65+ year old.Data source: ABS 2003-04 Survey of Income and Housing unit record data.
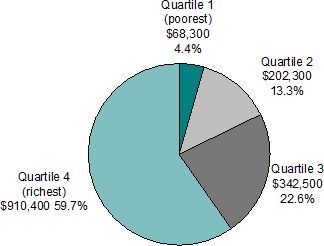
Share of wealth held by baby boomers and average per adult net worth, by baby boomer wealth quartile, 2004. Notes: Mixed households (for example two-family or group households) are excluded. Only baby boomer households are considered in scope, with ‘baby boomer’ households here being colloquially defined as those with a reference person aged 45 to 64 years. Each single person or partner within a couple household within this ‘baby boomer’ age range is ranked by their per adult net worth and then assigned to a baby boomer wealth quartile. The poorest 25% of adults are assigned to Quartile 1 and the richest 25% to Quartile 4.Data source: ABS 2003-04 Survey of Income and Housing unit record data
Tables
Distribution of people aged 45-64 by family type, 2004
| Member of a couple with dependent children | Member of a couple only | A sole parent with dependent children | A single person | |
|---|---|---|---|---|
| % | % | % | % | |
| Male | ||||
| 45-49 | 55.1 | 23.8 | 1.7 | 19.5 |
| 50-54 | 35.4 | 43.4 | 1.8 | 19.4 |
| 55-59 | 17.7 | 63.9 | 0.8 | 17.6 |
| 60-64 | 7.6 | 73.3 | 0.2 | 19.0 |
| Overall | 31.5 | 48.4 | 1.2 | 18.9 |
| Female | ||||
| 45-54 | 44.6 | 31.9 | 9.2 | 14.2 |
| 50-54 | 22.3 | 54.1 | 3.7 | 19.9 |
| 55-59 | 6.9 | 69.6 | 1.1 | 22.4 |
| 60-64 | 2.2 | 70.6 | 1.2 | 26.1 |
| Overall | 21.5 | 54.3 | 4.3 | 20.0 |
-
Source: ABS 2003-04 Survey of Income and Housing unit record data.
Labour force participation rates by gender, age and marital status, 1986-2006
| Gender and Age | Marital Status | Participation Rate | ||||
|---|---|---|---|---|---|---|
| Nov 1996 | Nov 2001 | Nov 2006 | 10-yr change | 5-yr change | ||
| % | % | % | % points | % points | ||
| Male | ||||||
| 45-54 | Married | 90.9 | 90.7 | 91.9 | 1.1 | 1.2 |
| Not married | 75.9 | 75.3 | 76.1 | 0.2 | 0.8 | |
| 55-59 | Married | 76.9 | 75.6 | 79.6 | 2.7 | 4.0 |
| Not married | 66.2 | 58.8 | 62.2 | -4.0 | 3.5 | |
| 60-64 | Married | 46.6 | 48.9 | 58.5 | 11.9 | 9.6 |
| Not married | 33.9 | 37.7 | 42.6 | 8.7 | 4.9 | |
| 65+ | Married | 10.3 | 11.7 | 14.8 | 4.5 | 3.1 |
| Not married | 6.7 | 6.5 | 7.6 | 0.9 | 1.1 | |
| All ages (15+) | Married | 75.2 | 74.5 | 74.9 | -0.3 | 0.4 |
| Not married | 69.5 | 67.1 | 66.5 | -3.0 | -0.6 | |
| Female | ||||||
| 45-54 | Married | 68.4 | 71.9 | 77.4 | 8.9 | 5.4 |
| Not married | 69.7 | 68.6 | 73.5 | 3.8 | 4.9 | |
| 55-59 | Married | 40.9 | 49.2 | 58.7 | 17.8 | 9.5 |
| Not married | 46.0 | 49.8 | 61.7 | 15.7 | 11.8 | |
| 60-64 | Married | 18.2 | 22.6 | 31.8 | 13.6 | 9.2 |
| Not married | 16.2 | 27.6 | 36.6 | 20.4 | 8.9 | |
| 65+ | Married | 3.7 | 4.9 | 6.9 | 3.2 | 2.0 |
| Not married | 2.5 | 2.0 | 2.8 | 0.3 | 0.8 | |
| All ages (15+) | Married | 54.9 | 57.6 | 60.2 | 5.2 | 2.6 |
| Not married | 51.9 | 51.3 | 53.4 | 1.5 | 2.2 | |
-
Source: ABS, 2006b.
Proportion of those employed that are working part-time by gender, age and marital status, 1986-2006
| Gender and Age | Marital Status | Proportion working part-time | ||||
|---|---|---|---|---|---|---|
| Nov 1996 | Nov 2001 | Nov 2006 | 10-yr change | 5-yr change | ||
| % | % | % | % points | % points | ||
| Male | ||||||
| 45-54 | Married | 4.7 | 6.6 | 7.4 | 2.7 | 0.8 |
| Not married | 10.6 | 10.1 | 14.0 | 3.4 | 3.9 | |
| 55-59 | Married | 10.3 | 12.8 | 12.2 | 1.9 | -0.6 |
| Not married | 14.7 | 15.6 | 17.0 | 2.4 | 1.4 | |
| 60-64 | Married | 18.8 | 22.2 | 24.5 | 5.7 | 2.4 |
| Not married | 17.1 | 22.8 | 26.0 | 9.0 | 3.2 | |
| 65+ | Married | 45.8 | 41.4 | 41.8 | -4.0 | 0.4 |
| Not married | 36.9 | 48.2 | 42.6 | 5.7 | -5.6 | |
| All ages (15+) | Married | 6.7 | 8.6 | 9.7 | 3.0 | 1.1 |
| Not married | 20.5 | 24.4 | 25.1 | 4.6 | 0.7 | |
| Female | 0.0 | |||||
| 45-54 | Married | 45.6 | 46.2 | 42.3 | -3.3 | -3.9 |
| Not married | 28.5 | 32.8 | 30.5 | 2.1 | -2.3 | |
| 55-59 | Married | 53.8 | 53.4 | 49.7 | -4.1 | -3.7 |
| Not married | 40.3 | 34.0 | 30.6 | -9.6 | -3.3 | |
| 60-64 | Married | 65.4 | 62.3 | 58.0 | -7.4 | -4.3 |
| Not married | 36.6 | 53.6 | 38.8 | 2.2 | -14.8 | |
| 65+ | Married | 71.8 | 73.1 | 69.0 | -2.8 | -4.1 |
| Not married | 71.7 | 65.6 | 57.1 | -14.6 | -8.5 | |
| All ages (15+) | Married | 46.3 | 46.7 | 45.9 | -0.4 | -0.8 |
| Not married | 38.2 | 42.9 | 42.2 | 4.0 | -0.7 | |
-
Source: ABS, 2006b.
Proportions of baby boomer households having debt by age and household type, 2004
| Age Group | Household Type | Any debt | Credit card debt | Rental property loans | Investment loans | Home mortgage | HECS debt |
|---|---|---|---|---|---|---|---|
| % | % | % | % | % | % | ||
| 45-49 | Couple only | 83.9 | 66.6 | 13.7 | 3.7 | 43.3 | 1.9 |
| Couple with children | 89.0 | 76.8 | 14.5 | 5.5 | 53.2 | 16.7 | |
| One Parent with children | 70.7 | 50.7 | 2.2 | 0.8 | 38.1 | 12.4 | |
| Lone Male | 64.0 | 49.8 | 5.7 | 1.8 | 34.5 | 1.1 | |
| Lone Female | 64.2 | 55.7 | 6.5 | 0.8 | 40.4 | 7.6 | |
| All 45-49 | 81.6 | 68.1 | 11.5 | 4.0 | 47.3 | 11.8 | |
| 50-54 | Couple only | 79.3 | 66.0 | 11.5 | 3.4 | 37.6 | 1.7 |
| Couple with children | 84.2 | 68.4 | 14.5 | 5.8 | 45.5 | 22.7 | |
| One Parent with children | 64.9 | 51.3 | 4.3 | . | 25.1 | 17.6 | |
| Lone Male | 57.4 | 39.3 | 2.5 | 1.6 | 30.7 | 2.1 | |
| Lone Female | 66.0 | 56.7 | 5.2 | 1.8 | 29.5 | 3.0 | |
| All 50-54 | 76.6 | 62.0 | 10.7 | 3.9 | 38.7 | 12.0 | |
| 55-59 | Couple only | 72.6 | 63.9 | 7.7 | 3.3 | 23.7 | 1.0 |
| Couple with children | 77.7 | 62.9 | 9.7 | 4.9 | 30.1 | 24.8 | |
| Lone Male | 48.4 | 39.6 | 1.1 | 2.3 | 23.8 | 1.1 | |
| Lone Female | 60.4 | 50.3 | 4.8 | 2.3 | 25.6 | 1.0 | |
| All 55-59 | 69.4 | 58.8 | 7.1 | 3.5 | 25.8 | 7.8 | |
| 60-64 | Couple only | 63.7 | 59.2 | 3.9 | 1.5 | 10.2 | 0.1 |
| Couple with children | 74.6 | 59.4 | 8.9 | 3.8 | 21.9 | 22.6 | |
| Lone Male | 47.9 | 41.3 | 1.4 | 0.6 | 15.8 | ||
| Lone Female | 40.6 | 38.4 | 0.9 | 4.2 | 1.3 | ||
| All 60-64 | 59.4 | 53.2 | 3.9 | 1.5 | 11.9 | 4.1 | |
| All | Couple only | 72.8 | 63.3 | 8.2 | 2.8 | 25.2 | 1.0 |
| Couple with children | 84.4 | 70.4 | 13.3 | 5.4 | 44.4 | 20.4 | |
| One Parent with children | 68.9 | 50.9 | 2.9 | 0.5 | 33.9 | 14.1 | |
| Lone Male | 55.3 | 42.8 | 2.9 | 1.6 | 27.2 | 1.2 | |
| Lone Female | 57.1 | 49.7 | 4.2 | 1.2 | 23.6 | 2.8 | |
| All 45-64 | 73.2 | 61.4 | 8.8 | 3.4 | 33.2 | 9.5 | |
-
Note: The percentages represent the proportion of that group that have that form of debt. For example, 66.6% of Couple Only households with a reference person aged 45-59 have a credit debt. Any debt indicates that debt related to credit cards, rental property loans, investment loans, a mortgage or HECS is greater than zero. ‘Baby boomer’ households are colloquially defined here as those with a reference person aged 45 to 64 years.
-
Source: ABS 2003-04 Survey of Income and Housing unit record data.
Average weekly household expenditure by age of the reference person and type of expenditure, 2004
| Age of household reference person | All ages | |||
|---|---|---|---|---|
| <45 years | 45-64 years | 65+ years | ||
| $ per week | $ per week | $ per week | $ per week | |
| Housing costs | 198 | 122 | 69 | 144 |
| Domestic fuel & power | 24 | 26 | 18 | 24 |
| Food & non-alcoholic beverages | 160 | 171 | 101 | 152 |
| Alcoholic beverages | 23 | 27 | 11 | 22 |
| Tobacco products | 12 | 13 | 4 | 11 |
| Clothing & footwear | 39 | 40 | 17 | 35 |
| Household furnishings & equipment | 62 | 56 | 29 | 53 |
| Household services and operation | 62 | 55 | 35 | 54 |
| Medical care & health expenses | 38 | 60 | 41 | 47 |
| Transport | 147 | 164 | 70 | 137 |
| Recreation | 120 | 132 | 71 | 114 |
| Personal care | 17 | 21 | 11 | 17 |
| Miscellaneous goods & services | 87 | 92 | 35 | 78 |
| Mortgage repayments-principal | 59 | 34 | 2 | 38 |
| Other capital housing costs | 94 | 66 | 16 | 68 |
| Superannuation & life insurance | 19 | 38 | 7 | 23 |
| Total expenditure | 1,163 | 1,117 | 535 | 1,016 |
| Total household Income from all sources | 1,253 | 1,270 | 540 | 1,111 |
-
Note: Total Expenditure includes selected other minor payments and may not be the sum of the items above. Income tax paid is not included within total expenditure. ‘Baby boomer’ households are colloquially defined here as those with a reference person aged 45 to 64 years.
-
Source: ABS 2003-04 Household Expenditure Survey unit record data.
Average weekly household expenditure by baby boomer households by family type and type of expenditure, 2004
| Couple Only | Couple with Dependent Children | One Parent with Children | Lone Male | Lone Female | All | |
|---|---|---|---|---|---|---|
| $ per week | $ per week | $ per week | $ per week | $ per week | $ per week | |
| Housing costs | 101 | 149 | 124 | 104 | 110 | 122 |
| Domestic fuel & power | 26 | 33 | 26 | 17 | 17 | 26 |
| Food & non-alcoholic beverages | 156 | 246 | 156 | 72 | 71 | 171 |
| Alcoholic beverages | 28 | 36 | 11 | 23 | 7 | 28 |
| Tobacco products | 11 | 16 | 10 | 15 | 7 | 13 |
| Clothing & footwear | 34 | 62 | 50 | 6 | 18 | 40 |
| Household furnishings & equipment | 61 | 64 | 38 | 25 | 48 | 56 |
| Household services and operation | 51 | 73 | 52 | 26 | 36 | 55 |
| Medical care & health expenses | 70 | 72 | 39 | 31 | 29 | 60 |
| Transport | 155 | 233 | 123 | 71 | 77 | 165 |
| Recreation | 123 | 183 | 129 | 58 | 60 | 132 |
| Personal care | 20 | 30 | 15 | 3 | 13 | 21 |
| Miscellaneous goods & services | 72 | 142 | 84 | 42 | 36 | 92 |
| Mortgage repayments-principal | 23 | 52 | 21 | 26 | 22 | 34 |
| Other capital housing costs | 18 | 120 | 53 | 26 | 63 | 66 |
| Superannuation & life insurance | 57 | 38 | 13 | 18 | 17 | 38 |
| Total expenditure | 1004 | 1549 | 943 | 563 | 631 | 1119 |
| Total household income from all sources | 1101 | 1837 | 992 | 683 | 555 | 1271 |
-
Note: ‘Total Expenditure’ includes selected other payments and may not be the sum of the items above. Income tax paid is not included within total expenditure. ‘Baby boomer’ households are colloquially defined here as those with a reference person aged 45 to 64 years. Note that we believe that there is sampling error in the data for spending by female lone persons on capital housing costs (which includes extensions and renovations and the purchase of other investment properties). There are four outlying observations in the sample data for this group who spend between $2110 and $4251 a week on such capital housing costs: in contrast, there are no values over $2000 a week for single males. The estimates for ‘other capital housing costs’ should thus be treated with some caution, as should the total expenditure for single female households.
-
Source: ABS 2003-04 Household Expenditure Survey unit record data.
Average per adult net worth, by age of the household reference person, Australia, 2004
| Age Group of H’hold Reference Person | Average Per Adult Net Worth | Share of total household net worth | ||||
|---|---|---|---|---|---|---|
| 1st Quartile (Poorest 25%) | 2nd Quartile | 3rd Quartile | 4th Quartile (Richest 25%) | Average within age group | ||
| $ | $ | $ | $ | $ | % | |
| <25 | 2,200 | 12,600 | 31,100 | 111,600 | 39,500 | 0.3 |
| 25-34 | 15,400 | 62,700 | 125,900 | 285,900 | 122,500 | 7.4 |
| 35-44 | 37,400 | 127,300 | 219,100 | 540,800 | 231,400 | 19.0 |
| 45-54 | 61,800 | 191,000 | 323,500 | 784,600 | 340,500 | 26.0 |
| 55-64 | 78,400 | 219,000 | 371,800 | 1,077,700 | 437,100 | 24.3 |
| All Baby Boomer Households | 68,300 | 202,300 | 342,500 | 910,400 | 381,100 | 50.3 |
| 65+ | 60,700 | 189,100 | 328,600 | 958,600 | 384,400 | 22.9 |
| All Households | 48,800 | 153,000 | 265,400 | 701,900 | 292,500 | 100.0 |
| Equity in Home (Value Per Adult) | ||||||
| All Baby Boomer Households | 29,400 | 114,100 | 179,700 | 320,300 | 161,000 | |
-
Note: The definition of net worth is based on the ABS definition. This definition includes more assets than were included in previous AMP.NATSEM Income and Wealth Reports. For example, the value of vehicles, contents of the home and collectibles were all previously excluded but are now part of the estimated net worth value. Mixed family households (for example two-family or group households) are excluded. ‘Baby boomer’ households are colloquially defined here as those with a reference person aged 45 to 64 years. Each single person or partner within a couple household within each age range is ranked by their per adult net worth and then assigned to an age-specific wealth quartile. The poorest 25% of adults within an age band are assigned to Quartile 1 and the richest 25% to Quartile 4. The technical notes contain more details. The quartiles are within the specified age groups.
-
Source: ABS 2003-04 Survey of Income and Housing unit record data.
Distribution of baby boomers, by wealth quartile and type of household, Australia, 2004
| Household Type | Average Net Worth Quartile | Share of Adults | Share of Net Worth | |||
|---|---|---|---|---|---|---|
| 1st Quartile (Poorest 25%) | 2nd Quartile | 3rd Quartile | 4th Quartile (Richest 25%) | |||
| % | % | % | % | % | % | |
| Couple only | 22.2 | 25.8 | 24.9 | 27.1 | 37.1 | 44.1 |
| Couple with children | 22.7 | 26.5 | 27.0 | 23.9 | 46.1 | 48.3 |
| One Parent with children | 41.2 | 18.3 | 18.3 | 22.1 | 2.5 | 1.1 |
| Lone Male | 36.7 | 18.7 | 20.0 | 24.6 | 7.1 | 3.4 |
| Lone Female | 36.6 | 19.3 | 21.1 | 23.0 | 7.2 | 3.2 |
| All | 25.0 | 25.0 | 25.0 | 25.0 | 100.0 | 100.0 |
-
Notes: Mixed households (for example two-family or group households) are excluded. ‘Baby boomers’ are defined here as those adults living in a household with a reference person aged 45-64 (excluding older dependent children still living in the parental home). Each single person or partner within a couple household within this ‘baby boomer’ age range is ranked by their per adult net worth and then assigned to a baby boomer wealth quartile. The poorest 25% of adults are assigned to Quartile 1 and the richest 25% to Quartile 4.
-
Source: ABS 2003-04 Survey of Income and Housing unit record data.
Average financial assets per adult, by age of the household reference person, Australia, 2004
| Age Group of H’hold Ref Person | Average net worth per person quartile | Share of total household financial assets | ||||
|---|---|---|---|---|---|---|
| 1st Quartile (Poorest 25%) | 2nd Quartile | 3rd Quartile | 4th Quartile (Richest 25%) | Average within age group | ||
| $ | $ | $ | $ | $ | % | |
| <25 | 1,300 | 4,400 | 8,100 | 17,400 | 7,800 | 0.3 |
| 25-34 | 7,200 | 18,500 | 25,200 | 55,600 | 26,600 | 5.8 |
| 35-44 | 11,000 | 29,700 | 45,100 | 118,000 | 51,000 | 15.3 |
| 45-54 | 14,800 | 44,900 | 86,100 | 235,200 | 95,300 | 26.6 |
| 55-64 | 16,800 | 45,100 | 111,600 | 373,600 | 136,900 | 28.0 |
| 65+ | 10,200 | 31,300 | 67,600 | 328,500 | 109,500 | 24.0 |
| All | 11,700 | 33,100 | 64,300 | 210,200 | 79,900 | 100.0 |
-
Notes: Mixed households (for example two-family or group households) are excluded. The quartiles are based on per person net worth within each age group (that is, the quartiles are the same as those used in Table 7). Each single person or partner within a couple household within each age range is ranked by their per adult net worth and then assigned to an age-specific quartile. The poorest 25% of adults within an age band are assigned to Quartile 1 and the richest 25% to Quartile 4.
-
Source: ABS 2003-04 Survey of Income and Housing unit record data.
Housing tenure of baby boomers by type of household, Australia, 2004
| Household type and age group of reference person | Tenure | Total homeowners | Outright owners as proportion of homeowners | |||
|---|---|---|---|---|---|---|
| Owner without mortgage | Owner with mortgage | Renter | Other | |||
| % | % | % | % | % | % | |
| Couple Only | ||||||
| 45-49 | 35.5 | 43.3 | 21.2 | - | 78.8 | 45.1 |
| 50-54 | 50.8 | 37.4 | 11.1 | 0.8 | 88.2 | 57.6 |
| 55-59 | 65.7 | 23.7 | 9.3 | 1.3 | 89.4 | 73.5 |
| 60-64 | 81.5 | 9.6 | 6.5 | 2.3 | 91.1 | 89.5 |
| Couple with children | ||||||
| 45-49 | 35.3 | 52.9 | 10.1 | 1.8 | 88.2 | 40.0 |
| 50-54 | 43.5 | 45.4 | 10.1 | 1.0 | 88.9 | 48.9 |
| 55-59 | 57.9 | 30.1 | 11.2 | 0.8 | 88.0 | 65.8 |
| 60-64 | 66.6 | 21.9 | 10.5 | 1.1 | 88.5 | 75.3 |
| One Parent | ||||||
| 45-49 | 18.7 | 37.2 | 39.8 | 4.3 | 55.9 | 33.5 |
| 50-54 | 28.8 | 25.1 | 41.5 | 4.6 | 53.9 | 53.4 |
| Lone Male | ||||||
| 45-49 | 29.3 | 34.5 | 34.8 | 1.3 | 63.8 | 45.9 |
| 50-54 | 25.7 | 30.7 | 43.1 | 0.5 | 56.4 | 45.6 |
| 55-59 | 40.2 | 23.8 | 32.1 | 3.9 | 64.0 | 62.8 |
| 60-64 | 52.3 | 14.4 | 28.4 | 4.8 | 66.7 | 78.4 |
| Lone Female | ||||||
| 45-49 | 21.3 | 40.4 | 36.9 | 1.4 | 61.7 | 34.5 |
| 50-54 | 32.7 | 29.5 | 35.2 | 2.6 | 62.2 | 52.6 |
| 55-59 | 42.7 | 25.6 | 29.8 | 1.9 | 68.3 | 62.5 |
| 60-64 | 66.2 | 3.5 | 28.2 | 2.1 | 69.7 | 95.0 |
| ALL | ||||||
| 45-49 | 31.9 | 47 | 19.5 | 1.7 | 78.9 | 40.4 |
| 50-54 | 41.4 | 38.7 | 18.7 | 1.3 | 80.1 | 51.7 |
| 55-59 | 57.1 | 25.8 | 15.5 | 1.6 | 82.9 | 68.9 |
| 60-64 | 72.4 | 11.2 | 13.9 | 2.4 | 83.6 | 86.6 |
| All Baby boomers | 48.1 | 33 | 17.3 | 1.7 | 81.1 | 59.3 |
-
Notes: Mixed households (for example two-family or group households) are excluded from the data above.The sample sizes were too small to provide reliable estimates for one parent households with the reference person aged 55+ and this group has been excluded from the table above.‘Baby boomer’ households are colloquially defined here as those with a reference person aged 45 to 64 years. All of the results are for households.
-
Source: ABS 2003-04 Survey of Income and Housing unit record data.
Data and code availability
Please contact the authors for information on data and code availability.