EUROLAB: A Multidimensional Labour Supply-Demand Model for EU Countries
- The Joint Research Centre, the European Commission, Spain
- Dipartimento di Economia e Statistica, University of Turin, Italy
Figures
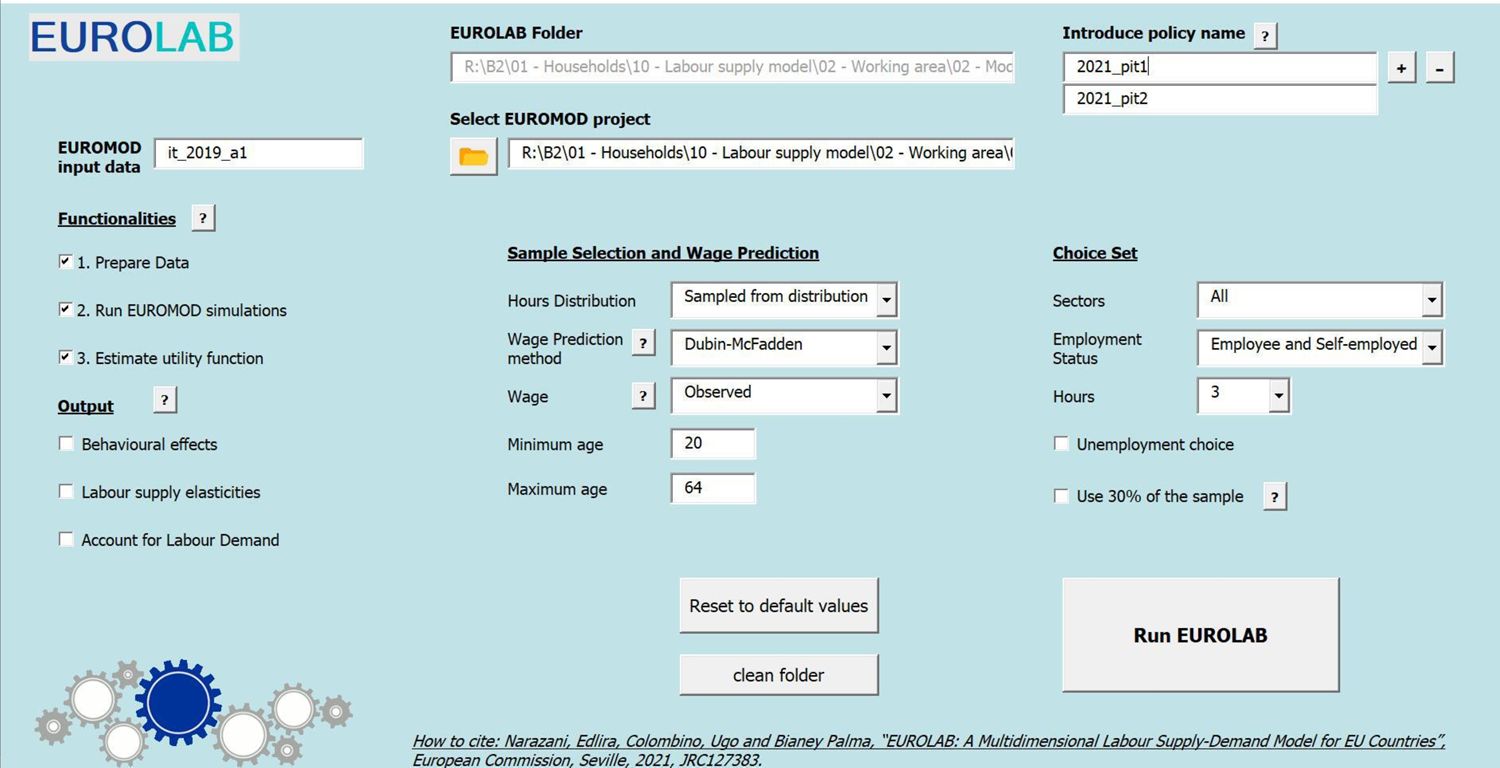
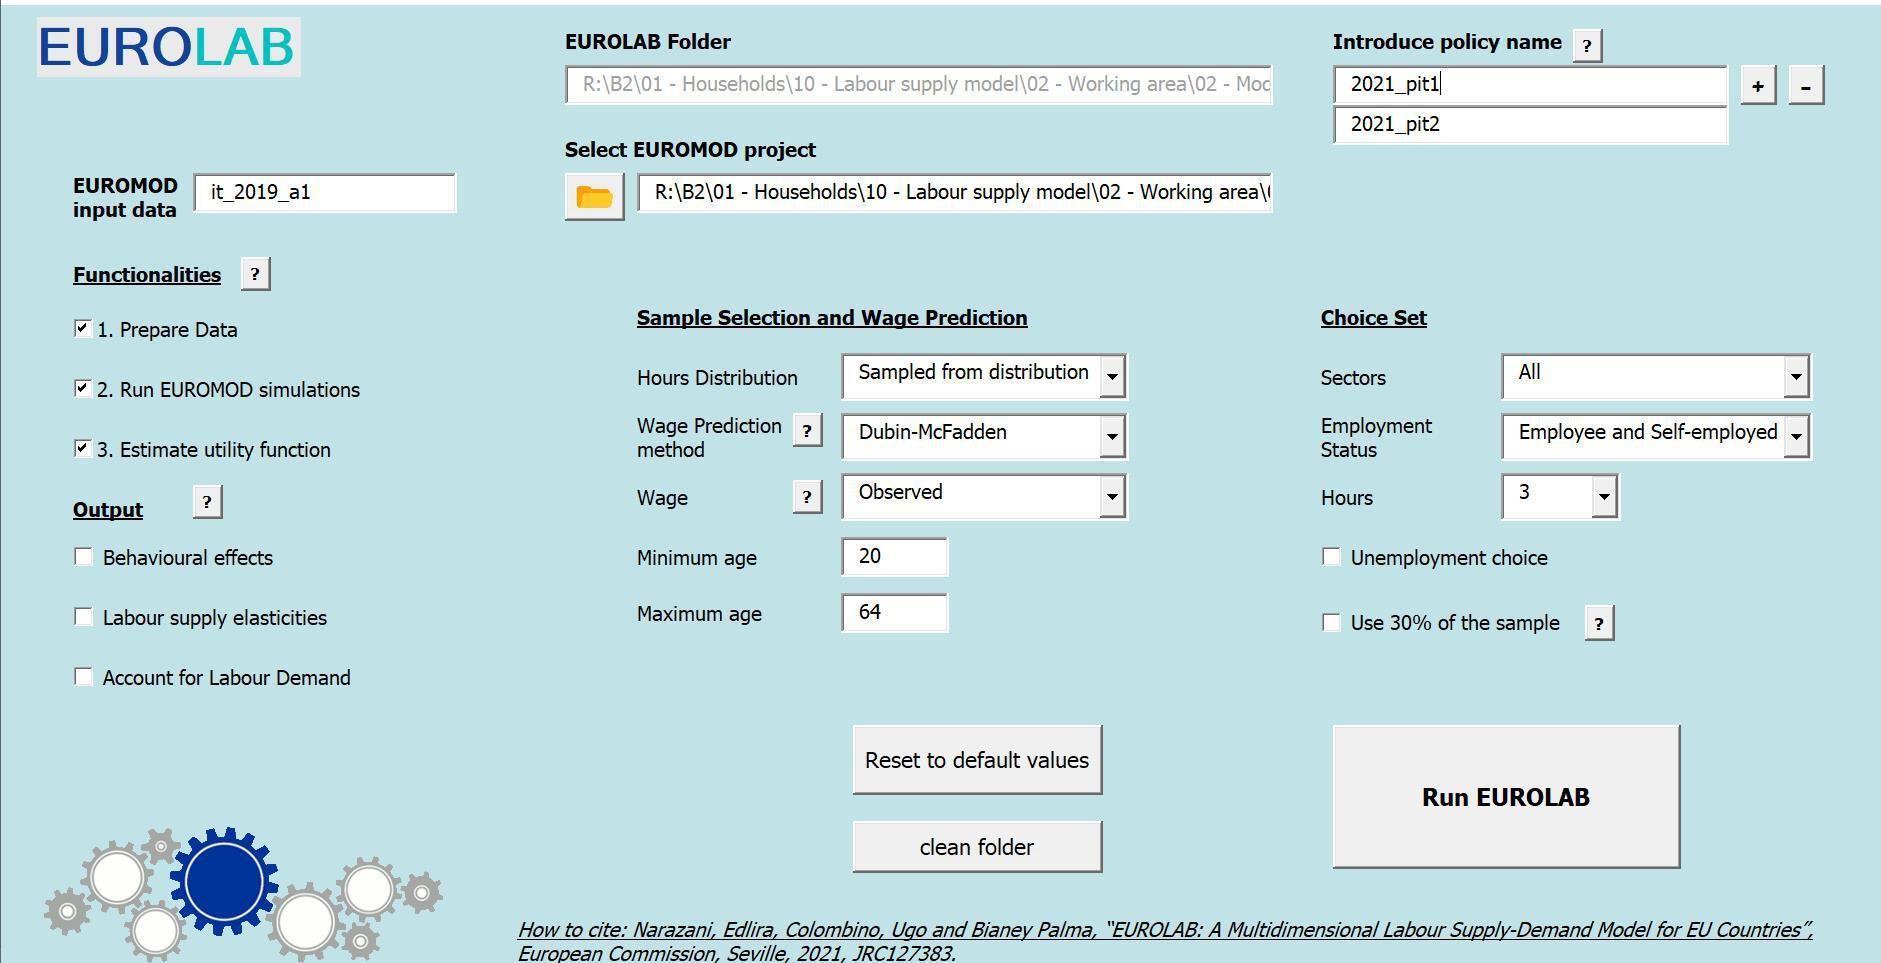
A snapshot of EUROLAB Configuration

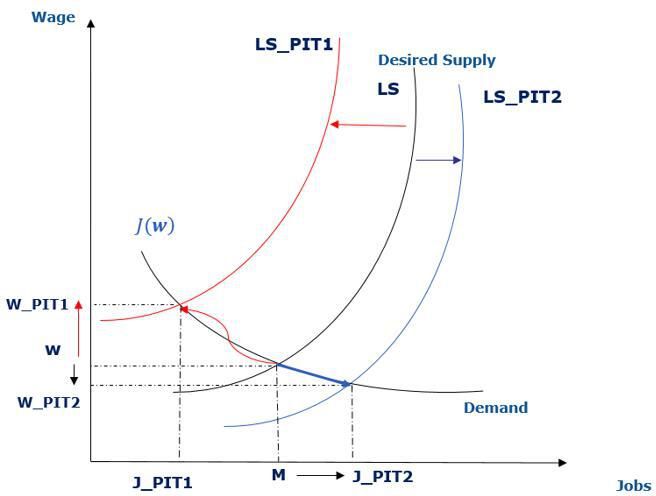
Labour market equilibrium
Tables
Conditional Logit results
| Couples | Single Women | Single Men | |
|---|---|---|---|
| clogit dependent variable | |||
| In-work dummy Male | -1.069* (-2.51) | -0.0994 (-0.39) | |
| Part-time dummy - Male | -2.935*** (-8.65) | -2.255*** (-9.94) | |
| Full-time dummy - Male | -0.0331 (-0.16) | 0.633*** (3.33) | |
| Over-time dummy - Male | 0.877*** (3.92) | 1.637*** (7.66) | |
| In-work dummy Female | 0.537** (2.62) | 0.329 (1.33) | |
| Part-time dummy - Female | -1.188*** (-11.33) | -0.953*** (-5.74) | |
| Full-time dummy - Female | 0.681*** (5.62) | 1.447*** (8.01) | |
| Over-time dummy - Female | 0.364* (2.45) | 1.366*** (6.65) | |
| Leisure - Male | 0.0866 (1.42) | 0.0250 (0.80) | |
| Leisure square - Male | -0.000653 (-1.85) | 0.000415 (1.69) | |
| Leisure x age - Male | -0.00477* (-2.23) | -0.00286** (-3.03) | |
| Leisure x age square - Male | 0.0000631** (2.81) | 0.0000359** (3.27) | |
| Leisure x #children - Male | -0.00575* (-1.98) | 0.00407 (0.66) | |
| Leisure x #children < 3 year - Male | -0.00197 (-0.22) | -0.0151 (-0.22) | |
| Leisure x #children 3-6 year - Male | -0.000181 (-0.02) | -0.0183 (-0.45) | |
| Leisure x Migrant - Male | -0.0150 (-1.70) | -0.0247*** (-4.78) | |
| Leisure x Mortgage - Male | -0.000614* (-2.20) | -0.000482 (-1.44) | |
| Leisure - Female | 0.123** (2.93) | 0.00382 (0.11) | |
| Leisure square - Female | -0.000759*** (-3.45) | 0.00117*** (4.54) | |
| Leisure x age - Female | -0.00127 (-0.80) | -0.00550*** (-4.91) | |
| Leisure x age square - Female | 0.0000133 (0.73) | 0.0000671*** (5.26) | |
| Leisure x #children - Female | 0.00464* (2.33) | 0.0118*** (3.65) | |
| Leisure x #children < 3 year - Female | 0.00702 (1.40) | 0.0148 (1.62) | |
| Leisure x #children 3-6 year - Female | 0.00108 (0.26) | 0.00789 (0.92) | |
| Leisure x Migrant - Female | -0.0121* (-2.02) | -0.0278*** (-5.68) | |
| Leisure x Mortgage - Female | -0.000177 (-1.06) | -0.000427 (-1.30) | |
| Leisure Male x Leisure Female | 0.000768*** (5.14) | ||
| Net income | 0.0109*** (13.44) | 0.00794*** (10.66) | 0.00542*** (9.54) |
| Net income square | -0.00000277*** (-16.92) | -0.00000271*** (-7.37) | -0.00000198*** (-8.51) |
| Net income x household size | 0.000256 (1.93) | 0.000463 (1.86) | 0.000783*** (3.89) |
| Net income x Leisure - Male | -0.0000234** (-3.26) | 0.00000576 (1.05) | |
| Net income x Leisure - Female | -0.0000389*** (-7.36) | 0.00000760 (1.13) | |
| Observations | 217216 | 24024 | 26168 |
| ll | -10420.5 | -4878.9 | -4924.8 |
| r2_p | 0.262 | 0.219 | 0.276 |
| aic | 20904.9 | 9791.7 | 9883.6 |
| bic | 21234.2 | 9929.2 | 10022.5 |
-
t statistics in parentheses.
-
*p < 0.05, ** p < 0.01, *** p < 0.001.
The average value of predicted probabilities and observed fractions across labour supply alternatives
| Predicted | Observed | |
|---|---|---|
| A. Women in Couple | ||
| Inactive | 0.017755 | 0.020625 |
| Unemployed | 0.027174 | 0.022982 |
| 5 - 22 | 0.011039 | 0.00442 |
| 22 - 39 | 0.195358 | 0.2033 |
| 39 - 56 | 0.748674 | 0.748674 |
| B. Men in Couple | ||
| Inactive | 0.041128 | 0.043017 |
| Unemployed | 0.059956 | 0.047731 |
| 5 - 22 | 0.082874 | 0.070418 |
| 22 - 39 | 0.470726 | 0.493518 |
| 39 - 56 | 0.345315 | 0.345315 |
| C. Single Men | ||
| Inactive | 0.233291 | 0.231268 |
| Unemployed | 0.159889 | 0.162575 |
| 5 - 22 | 0.191616 | 0.188676 |
| 22 - 39 | 0.213798 | 0.218327 |
| 39 - 56 | 0.315418 | 0.316016 |
| D. Single Women | ||
| Inactive | 0.235618 | 0.235188 |
| Unemployed | 0.195866 | 0.199835 |
| 5 - 22 | 0.194552 | 0.19799 |
| 22 - 39 | 0.252569 | 0.254291 |
| 39 - 56 | 0.310901 | 0.305658 |
Labour elasticities for All, it
| All | Couples | Singles | ||||||||
|---|---|---|---|---|---|---|---|---|---|---|
| Total | Extensive | Intensive | Total | Extensive | Intensive | Total | Extensive | Intensive | ||
| Education | Low level | 0.137 | 0.109 | 0.028 | 0.106 | 0.083 | 0.024 | 0.174 | 0.142 | 0.033 |
| Middle level | 0.119 | 0.093 | 0.026 | 0.090 | 0.065 | 0.024 | 0.156 | 0.127 | 0.029 | |
| High level | 0.088 | 0.058 | 0.029 | 0.073 | 0.040 | 0.033 | 0.107 | 0.083 | 0.024 | |
| Age | 20-30 | 0.175 | 0.134 | 0.041 | 0.147 | 0.100 | 0.047 | 0.185 | 0.147 | 0.038 |
| 31-40 | 0.112 | 0.085 | 0.027 | 0.097 | 0.071 | 0.027 | 0.131 | 0.103 | 0.028 | |
| 41-on | 0.112 | 0.086 | 0.026 | 0.084 | 0.059 | 0.025 | 0.151 | 0.124 | 0.028 | |
| Child | Yes | 0.132 | 0.102 | 0.031 | 0.101 | 0.070 | 0.031 | 0.148 | 0.117 | 0.030 |
| No | 0.097 | 0.073 | 0.023 | 0.085 | 0.061 | 0.024 | 0.164 | 0.142 | 0.022 | |
| Migrant | Yes | 0.118 | 0.091 | 0.026 | 0.089 | 0.063 | 0.026 | 0.156 | 0.128 | 0.027 |
| No | 0.108 | 0.072 | 0.036 | 0.105 | 0.075 | 0.030 | 0.111 | 0.068 | 0.043 | |
| Income level | Low | 0.166 | 0.131 | 0.036 | 0.132 | 0.103 | 0.030 | 0.208 | 0.165 | 0.043 |
| Middle | 0.100 | 0.083 | 0.018 | 0.071 | 0.057 | 0.015 | 0.142 | 0.120 | 0.022 | |
| High | 0.050 | 0.019 | 0.031 | 0.045 | -0.001 | 0.046 | 0.056 | 0.041 | 0.015 | |
| Total | 0.117 | 0.089 | 0.027 | 0.090 | 0.064 | 0.026 | 0.150 | 0.121 | 0.029 | |
Labour elasticities, men
| All | Couples | Singles | ||||||||
|---|---|---|---|---|---|---|---|---|---|---|
| Total | Extensive | Intensive | Total | Extensive | Intensive | Total | Extensive | Intensive | ||
| Education | Low level | 0.127 | 0.103 | 0.025 | 0.076 | 0.064 | 0.012 | 0.186 | 0.147 | 0.039 |
| Middle level | 0.104 | 0.082 | 0.023 | 0.053 | 0.038 | 0.014 | 0.164 | 0.131 | 0.033 | |
| High level | 0.074 | 0.038 | 0.036 | 0.056 | 0.014 | 0.041 | 0.099 | 0.071 | 0.028 | |
| Age | 20-30 | 0.175 | 0.130 | 0.045 | 0.085 | 0.050 | 0.034 | 0.191 | 0.144 | 0.047 |
| 31-40 | 0.095 | 0.072 | 0.023 | 0.047 | 0.035 | 0.013 | 0.141 | 0.109 | 0.033 | |
| 41-on | 0.101 | 0.076 | 0.025 | 0.064 | 0.043 | 0.021 | 0.158 | 0.127 | 0.031 | |
| Child | Yes | 0.139 | 0.106 | 0.033 | 0.091 | 0.063 | 0.029 | 0.159 | 0.124 | 0.035 |
| No | 0.051 | 0.036 | 0.015 | 0.046 | 0.031 | 0.015 | 0.147 | 0.135 | 0.012 | |
| Migrant | Yes | 0.107 | 0.082 | 0.025 | 0.061 | 0.041 | 0.020 | 0.163 | 0.132 | 0.031 |
| No | 0.096 | 0.057 | 0.039 | 0.058 | 0.041 | 0.018 | 0.129 | 0.072 | 0.058 | |
| Income level | Low | 0.153 | 0.117 | 0.037 | 0.083 | 0.068 | 0.015 | 0.240 | 0.177 | 0.063 |
| Middle | 0.081 | 0.079 | 0.002 | 0.030 | 0.040 | -0.010 | 0.147 | 0.130 | 0.017 | |
| High | 0.066 | 0.013 | 0.054 | 0.084 | -0.012 | 0.097 | 0.050 | 0.035 | 0.015 | |
| Total | 0.106 | 0.080 | 0.026 | 0.061 | 0.041 | 0.020 | 0.159 | 0.125 | 0.034 | |
Labour elasticities, women
| All | Couples | Singles | ||||||||
|---|---|---|---|---|---|---|---|---|---|---|
| Total | Extensive | Intensive | Total | Extensive | Intensive | Total | Extensive | Intensive | ||
| Education | Low level | 0.150 | 0.118 | 0.032 | 0.146 | 0.107 | 0.039 | 0.157 | 0.134 | 0.023 |
| Middle level | 0.135 | 0.105 | 0.030 | 0.126 | 0.092 | 0.034 | 0.148 | 0.123 | 0.025 | |
| High level | 0.098 | 0.074 | 0.024 | 0.087 | 0.061 | 0.026 | 0.114 | 0.092 | 0.022 | |
| Age | 20-30 | 0.174 | 0.139 | 0.035 | 0.172 | 0.120 | 0.052 | 0.176 | 0.153 | 0.022 |
| 31-40 | 0.129 | 0.098 | 0.031 | 0.137 | 0.099 | 0.038 | 0.116 | 0.095 | 0.021 | |
| 41-on | 0.123 | 0.096 | 0.027 | 0.107 | 0.078 | 0.029 | 0.144 | 0.120 | 0.024 | |
| Child | Yes | 0.123 | 0.095 | 0.028 | 0.111 | 0.076 | 0.034 | 0.130 | 0.107 | 0.023 |
| No | 0.134 | 0.103 | 0.030 | 0.124 | 0.092 | 0.032 | 0.167 | 0.144 | 0.024 | |
| Migrant | Yes | 0.129 | 0.101 | 0.028 | 0.117 | 0.085 | 0.032 | 0.147 | 0.124 | 0.023 |
| No | 0.120 | 0.085 | 0.034 | 0.144 | 0.103 | 0.041 | 0.092 | 0.065 | 0.027 | |
| Income level | Low | 0.179 | 0.144 | 0.035 | 0.182 | 0.137 | 0.044 | 0.176 | 0.153 | 0.023 |
| Middle | 0.122 | 0.087 | 0.035 | 0.112 | 0.073 | 0.039 | 0.137 | 0.108 | 0.028 | |
| High | 0.031 | 0.027 | 0.004 | 0.005 | 0.010 | -0.006 | 0.065 | 0.049 | 0.016 | |
| Total | 0.128 | 0.099 | 0.029 | 0.120 | 0.087 | 0.033 | 0.140 | 0.117 | 0.023 | |
Labour supply changes by gender and household type, employees
| Baseline, 2021 | % Change after PIT1 | % Change after PIT2 | ||
|---|---|---|---|---|
| Hours of work | ||||
| Men | In couple - with children | 39.14 | -0.31% | 0.29% |
| In couple - without children | 37.63 | -0.50% | 0.63% | |
| Single - with children | 35.67 | -0.95% | 1.88% | |
| Single - without children | 34.68 | -0.75% | 1.59% | |
| Women | In couple - with children | 30.88 | -1.05% | 1.47% |
| In couple - without children | 31.61 | -0.97% | 1.64% | |
| Single - with children | 31.71 | -1.08% | 2.51% | |
| Single - without children | 33.16 | -0.87% | 1.84% | |
| Participation | ||||
| Men | In couple - with children | 0.97 | -0.29% | 0.31% |
| In couple - without children | 0.94 | -0.47% | 0.61% | |
| Single - with children | 0.90 | -0.85% | 1.46% | |
| Single - without children | 0.88 | -0.69% | 1.31% | |
| Women | In couple - with children | 0.90 | -0.70% | 0.81% |
| In couple - without children | 0.92 | -0.64% | 0.87% | |
| Single - with children | 0.86 | -0.94% | 1.63% | |
| Single - without children | 0.89 | -0.75% | 1.23% | |
| Unemployment | ||||
| Men | In couple - with children | 0.02 | 9.39% | -11.37% |
| In couple - without children | 0.04 | 6.75% | -11.39% | |
| Single - with children | 0.05 | 7.74% | -14.01% | |
| Single - without children | 0.06 | 3.95% | -10.22% | |
| Women | In couple - with children | 0.05 | 6.75% | -9.00% |
| In couple - without children | 0.05 | 6.52% | -10.69% | |
| Single - with children | 0.07 | 6.01% | -12.03% | |
| Single - without children | 0.06 | 4.70% | -10.57% | |
| Inactivity | ||||
| Men | In couple - with children | 0.01 | 9.49% | -7.48% |
| In couple - without children | 0.02 | 7.95% | -6.44% | |
| Single - with children | 0.05 | 7.07% | -11.48% | |
| Single - without children | 0.06 | 6.35% | -9.05% | |
| Women | In couple - with children | 0.04 | 6.49% | -6.13% |
| In couple - without children | 0.04 | 7.42% | -7.97% | |
| Single - with children | 0.07 | 5.90% | -8.71% | |
| Single - without children | 0.06 | 6.99% | -8.74% |
-
Note: Children are defined as son-daughter of the decision-making unit. They are not older than 18 years, or if older, in education.
Labour supply changes by gender and household type, self-employed
| Baseline, 2021 | % Change after PIT1 | % Change after PIT2 | ||
|---|---|---|---|---|
| Hours of work | ||||
| Men | In couple - with children | 41.87 | -0.28% | 0.25% |
| In couple - without children | 39.32 | -0.44% | -0.10% | |
| Single - with children | 37.09 | -1.04% | 2.63% | |
| Single - without children | 37.33 | -0.77% | 1.38% | |
| Women | In couple - with children | 32.76 | -0.85% | 1.23% |
| In couple - without children | 32.73 | -0.85% | 1.17% | |
| Single - with children | 34.19 | -1.09% | 2.02% | |
| Single - without children | 34.78 | -0.70% | 1.21% | |
| Participation | ||||
| Men | In couple - with children | 0.97 | -0.25% | 0.12% |
| In couple - without children | 0.94 | -0.40% | -0.11% | |
| Single - with children | 0.89 | -0.95% | 1.53% | |
| Single - without children | 0.90 | -0.71% | 1.01% | |
| Women | In couple - with children | 0.93 | -0.57% | 0.52% |
| In couple - without children | 0.93 | -0.55% | 0.46% | |
| Single - with children | 0.90 | -0.81% | 0.78% | |
| Single - without children | 0.90 | -0.66% | 0.69% | |
| Unemployment | ||||
| Men | In couple - with children | 0.01 | 8.37% | -3.83% |
| In couple - without children | 0.03 | 5.56% | 3.09% | |
| Single - with children | 0.05 | 8.28% | -12.55% | |
| Single - without children | 0.04 | 6.21% | -8.81% | |
| Women | In couple - with children | 0.03 | 7.64% | -6.55% |
| In couple - without children | 0.03 | 7.20% | -5.24% | |
| Single - with children | 0.04 | 6.75% | -6.52% | |
| Single - without children | 0.04 | 5.85% | -6.19% | |
| Inactivity | ||||
| Men | In couple - with children | 0.01 | 9.05% | -4.93% |
| In couple - without children | 0.03 | 6.31% | 0.10% | |
| Single - with children | 0.06 | 7.72% | -12.98% | |
| Single - without children | 0.06 | 6.29% | -9.04% | |
| Women | In couple - with children | 0.04 | 7.99% | -7.61% |
| In couple - without children | 0.04 | 7.66% | -7.08% | |
| Single - with children | 0.07 | 7.07% | -6.83% | |
| Single - without children | 0.06 | 5.95% | -6.07% |
-
Note: Children are defined as son-daughter of the decision-making unit. They are not older than 18 years, or if older, in education.
Labour supply changes by gender and income quintiles
| Baseline, 2021 | % Change after PIT1 | % Change after PIT2 | ||
|---|---|---|---|---|
| Hours of work | ||||
| Men | I-II | 34.42 | -1.07% | 1.47% |
| III-IV | 36.85 | -0.98% | 1.78% | |
| V-VI | 37.40 | -0.71% | 1.47% | |
| VII-VIII | 37.76 | -0.43% | 1.13% | |
| IX-X | 38.75 | 0.05% | -0.97% | |
| Women | I-II | 28.18 | -1.75% | 2.12% |
| III-IV | 31.89 | -1.78% | 3.32% | |
| V-VI | 33.08 | -1.24% | 2.58% | |
| VII-VIII | 35.19 | -0.57% | 1.99% | |
| IX-X | 34.74 | 0.34% | -0.45% | |
| Participation | ||||
| Men | I-II | 0.87 | -0.89% | 1.11% |
| III-IV | 0.91 | -0.84% | 1.36% | |
| V-VI | 0.93 | -0.64% | 1.16% | |
| VII-VIII | 0.94 | -0.44% | 0.94% | |
| IX-X | 0.94 | -0.05% | -0.58% | |
| Women | I-II | 0.78 | -1.29% | 1.44% |
| III-IV | 0.86 | -1.36% | 2.14% | |
| V-VI | 0.89 | -0.99% | 1.72% | |
| VII-VIII | 0.93 | -0.57% | 1.30% | |
| IX-X | 0.91 | 0.01% | -0.47% |
% Changes in employment, unemployment and inactivity rate after the PIT reforms
| Baseline | PIT1 | PIT2 | |||
|---|---|---|---|---|---|
| No Equilibrium (%) | With Equilibrium (%) | No Equilibrium (%) | With Equilibrium (%) | ||
| Employment | 15854397 | -0.66% | -0.62% | 0.89% | 0.85% |
| Inactivity | 916796 | 6.49% | 6.03% | -7.49% | -7.05% |
| Unemployment | 762628 | 5.83% | 5.54% | -9.50% | -9.29% |
| Wages | 1.24% | -1.69% | |||
-
*Definitions: Employment = Total number of people in employment, only labour supply endogenous sample, Inactivity = Total number of people in inactivity, only behavioural sample, Unemployment = Total number of people in unemployment, only behavioural sample, v = Parameter of percentage change in wages.
Data and code availability
We declare that the manuscript contains PROPRIETARY data that consists in 1) the Stata programs, 2) the EUROMOD model and 3) the EU-SILC data. The user needs to request an access to SILC data. EUROMOD is an open-source tool and can be downloaded from the website. The Stata do-files cannot be published in an openly accessible trusted data repository, but authors commit to preserving data and code for a period of no less than five years following publication of the manuscript, and provide reasonable assistance to requests for clarification and replication.