Accounting for Behavioral Effects in Microsimulation: A Reduced Form Approach
- Finnish Institute for Health and Welfare, Finland
- University of Helsinki and VATT Institute for Economic Research, Finland
- Research Department, Statistics Norway and Norwegian Fiscal Studies, the Department of Economics, University of Oslo, Norway
Figures
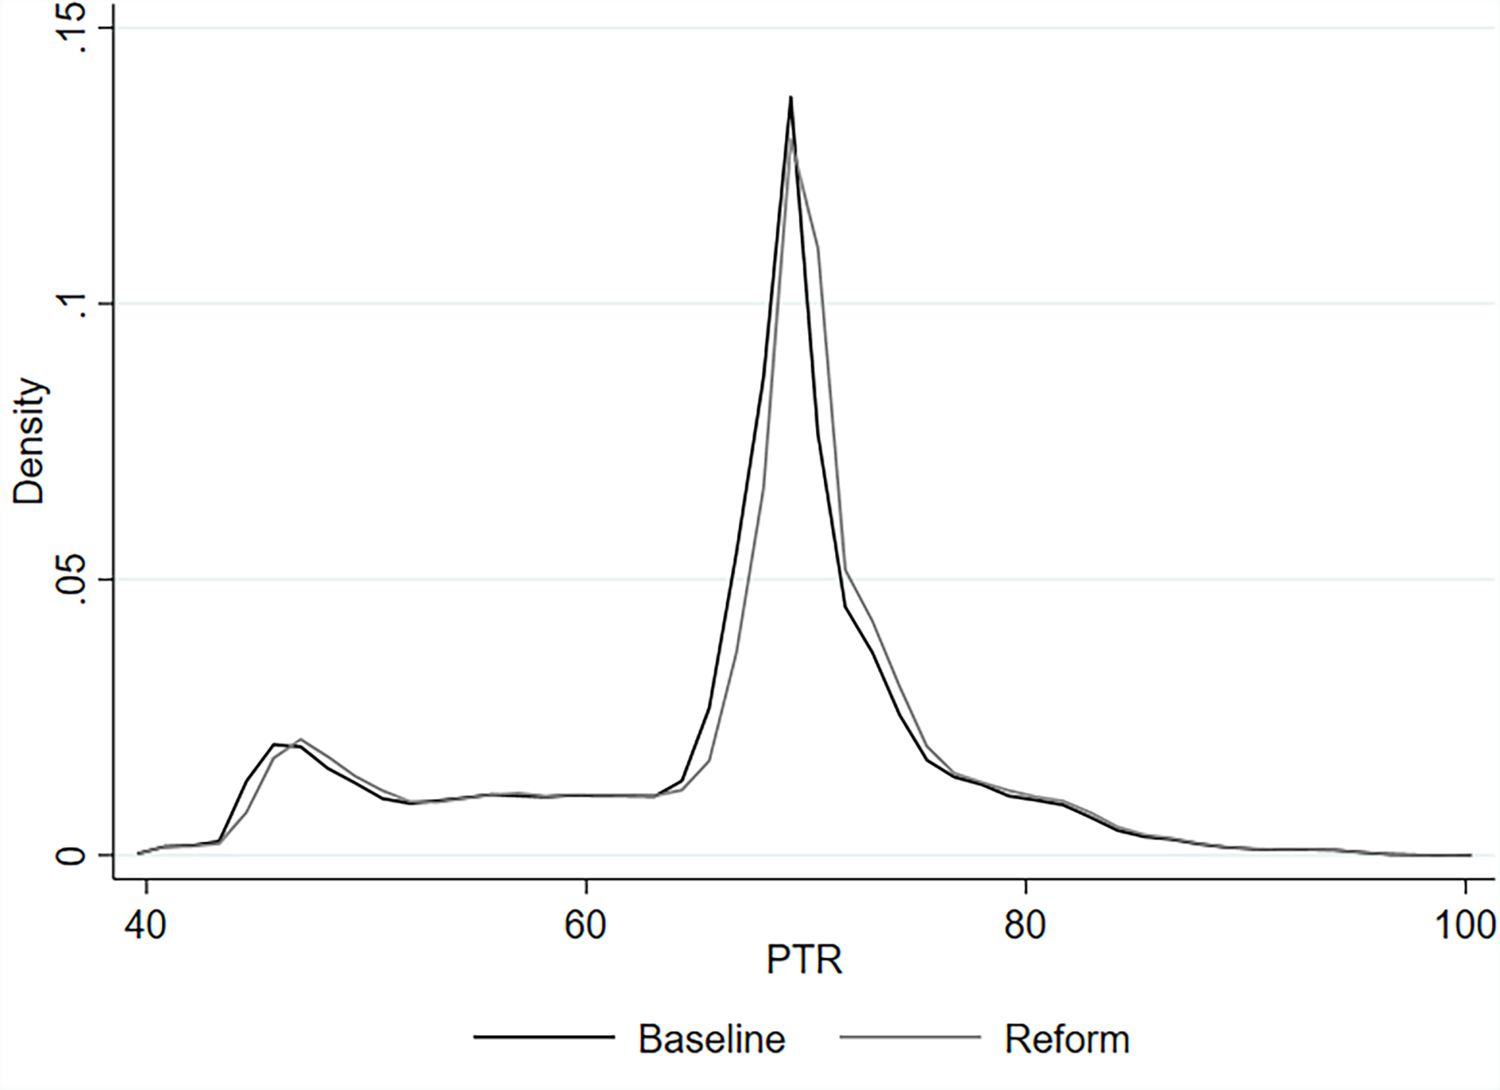
Kernel density distributions of participation tax rates simulated with the baseline and reform legislations.

Kernel density distributions of effective marginal tax rates simulated with the baseline and reform legislations.
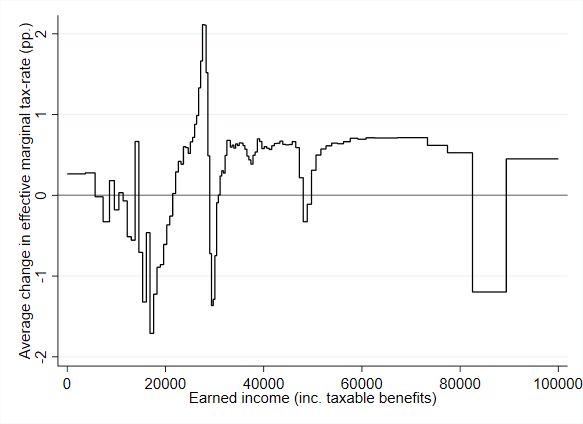
The average change (pp) of effective marginal tax rates annual earned income.
The policy effects (%) on disposable income by income decile.

The differences (pp) between behavioral and non-behavioral effects by income decile.

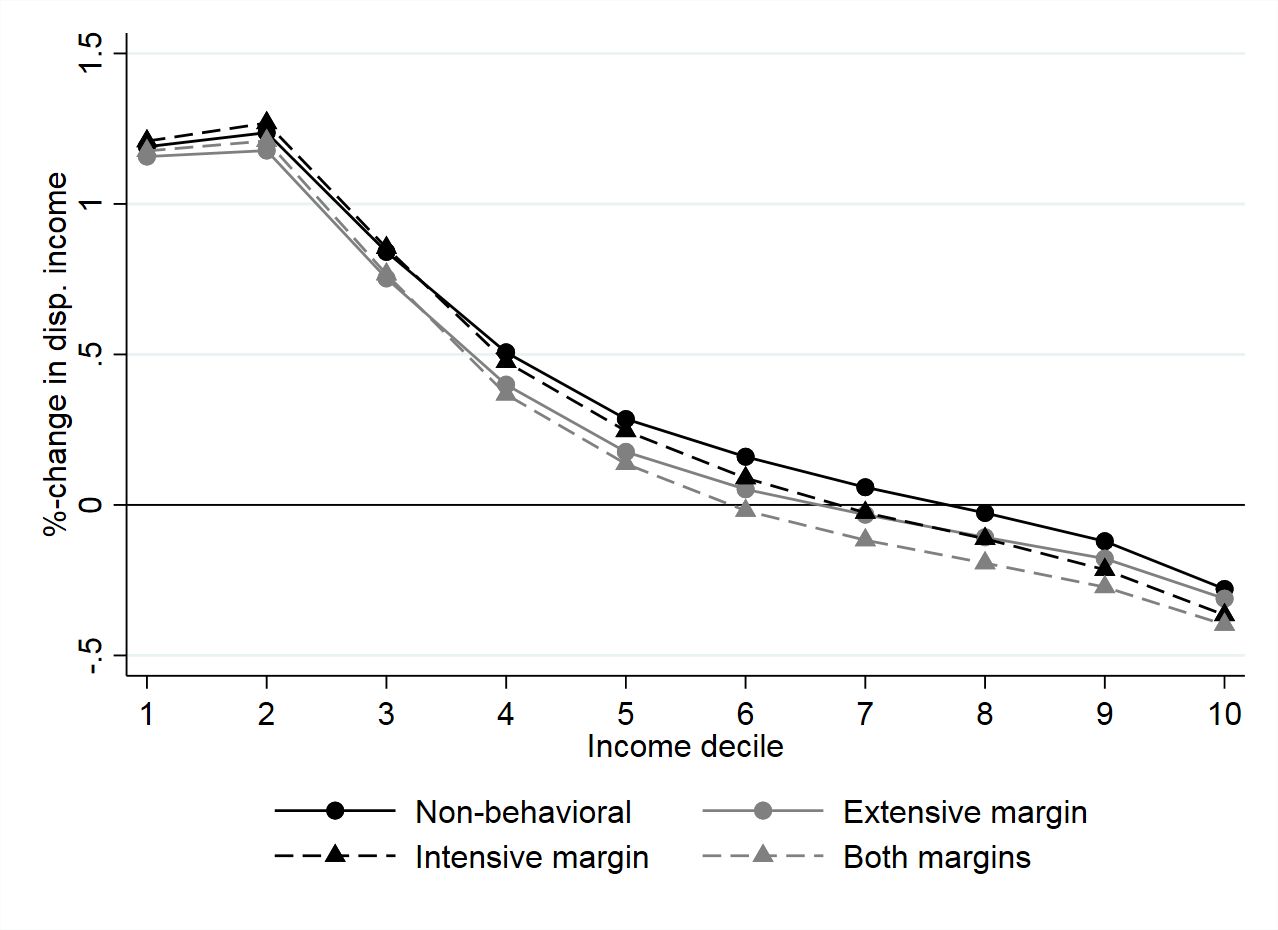
The policy effects (%) of various specifications on disposable income by income decile.

The differences (pp) in the effect of extensive margin responses in relation to the default specification (=0) by income decile.

The differences (pp) in the effect of intensive margin responses in relation to the default specification (=0) by income decile.

The differences (pp) in the effect of behavioral responses in relation to the baseline specification (=0) by income decile.

Effective marginal tax rates (%) by annual earned income with the baseline and reform legislations.
Tables
PTR change by benefit receipt.
| Freq | PTR baseline | PTR reform | Change, pp | |
|---|---|---|---|---|
| Flat rate UB | 280 000 | 62.7% | 62.9% | 0.1 |
| Earnings-related UB | 270 000 | 69.3% | 69.7% | 0.4 |
| Home care allowance | 100 000 | 54.8% | 54.7% | -0.1 |
| Employed | 1 890 000 | 66.6% | 67.2% | 0.5 |
| Total | 2 540 000 | 66.0% | 66.5% | 0.5 |
-
Note: If individual have several income sources within a year the following prioritization is used: 1. Home care allowance, 2. Earnings-related UB and 3. Flat rate UB. Employed are individuals with positive labor income and not received home care allowance or any unemployment benefit within a year. Baseline refers to legislation of year 2019 and reform to legislation of year 2020.
Extensive margin responses.
| Default | Heterogenous | |
|---|---|---|
| elasticity | ||
| PTR increase (pp.-change) | 0.5 | 0.5 |
| Population with increase | 2,260,000 | 2,260,000 |
| PTR decrease (pp.-change) | - 0.3 | - 0.3 |
| Population with decrease | 270,000 | 270,000 |
| Employment increase (person years) | 200 (100 – 300) | 200 |
| Employment decrease (person years) | - 5,800 (-2,900 – -8,800) | - 5,700 |
| Net change (person years) | - 5,700 (-2,800 – -8,500) | - 5,500 |
-
Note: Results are calculated with consumer price index and using the aggregate participation elasticity of 0.2. In heterogeneous elasticity column the aggregate participation elasticity is weighted using 8 different groups. The changes in PTR are the average changes and the values in brackets are formed using elasticities of 0.1 (LHS) and 0.3 (RHS). Values of employment changes are rounded to 100 units. Values of population with increase or decrease are rounded to 10,000 units.
Changes in incentives and earnings in intensive margin with various specifications.
| Default | Extra income | |
|---|---|---|
| of 6,000 euros/year | ||
| EMTR increase (pp-change) | 1.0 | 0.6 |
| Population with increase | 1,920,000 | 1,920,000 |
| EMTR decrease (pp-change) | -3.0 | -1.2 |
| Population with decrease | 350,000 | 390,000 |
| Earnings increase (Me) | 120 (60 – 180) | 40 |
| Earnings decrease (Me) | - 250 (-130 – -380) | - 190 |
| Net change (Me) | - 140 (-70 – -200) | - 150 |
-
Note: Default results are calculated with extra income of 1,200 euro/year. All cases are calculated using consumer price index. Values in brackets are calculated using elasticities of 0.1 (LHS) and 0.3 (RHS). Me refers to millions of euro. Values of earnings changes are rounded to 10 million euros. Values of population with increase or decrease are rounded to 10,000 units.
Policy effects on inequality and poverty indicators.
| Base level in 20 | Non-behavioral | Extensive margin | Intensive margin | Both margins | Total effect | |
|---|---|---|---|---|---|---|
| Gini coefficient | 28 | -0.3 | 0.0 | 0.0 | 0.0 | -0.3 |
| Equalized income | ||||||
| Median | 24,335 | 54 | -29 | -17 | -47 | 7 |
| At risk of poverty | ||||||
| Whole population (%) | 13.4 | -0.6 | 0.0 | 0.0 | 0.0 | -0.6 |
| Whole population (N) | 738,000 | -32,500 | 2,000 | -200 | 1,600 | -30,900 |
| Children (%) | 12.6 | -0.4 | 0.1 | 0.0 | 0.1 | -0.4 |
| Children (N) | 133,600 | -4,600 | 600 | 100 | 600 | -3,900 |
| Elderly (%) | 12.7 | -1.4 | 0.0 | 0.0 | 0.0 | -1.4 |
| Elderly (N) | 150,100 | -16,200 | 0 | 0 | 0 | -16,200 |
| Fiscal changes | ||||||
| Taxes (Me) | 35,700 | 130 | -40 | -70 | -110 | 20 |
| Benefits (Me) | 13,600 | 360 | 90 | 0 | 90 | 450 |
| Taxes-benefits (Me) | 22,100 | -230 | -140 | -70 | -210 | -430 |
-
Note: Results are calculated with consumer price index, elasticities of 0.2 and extra income of 1 200 euro/year. Total effect is the sum of non-behavioral and behavioral effects. Extensive margin, intensive margin and both margins are calculated compared to the reform’s (2020) non-behavioral simulation. Non-behavioral and total effect are calculated compared to the base level results. Poverty line used is set to 60% of median income and it is fixed to the baseline (2019) level. Children are defined as individuals aged less than 18 years. Elderly are defined as individuals aged 65 or more. Changes of individuals in at risk of poverty are rounded to 100 individuals. Fiscal changes are rounded to 10 million euros and baseline values of taxes and benefits are rounded to 100 million euros.
Social welfare effects.
| Base level | Difference to base | ||||
|---|---|---|---|---|---|
| in 2019 | Non-behavior | Extensive | Intensive | Both margins | |
| 7.2 | -0.1 | -0.1 | -0.1 | -0.1 | |
| 12.7 | -0.2 | -0.2 | -0.2 | -0.2 | |
| 22.9 | -0.3 | -0.3 | -0.4 | -0.4 | |
| Mean equivalized disp. income | 27,796 | 46 | 25 | 29 | 8 |
| 25,791 | 72 | 51 | 58 | 37 | |
| 24,254 | 94 | 74 | 84 | 63 | |
| 21,438 | 130 | 112 | 124 | 107 | |
-
Note: Inequality of the base situation and the change after the reform (Upper panel), with or without behavioural reactions and with Atkinson index with inequality aver sion equal to 0.5, 1, or 2. The lower panel depicts social welfare and the change relative to the base situation.
Social welfare effects, revenue neutral case
| Base level | Difference to base | ||||
|---|---|---|---|---|---|
| in 2019 | Non-behavior | Extensive | Intensive | Both margins | |
| 7.2 | -0.1 | -0.1 | -0.1 | -0.1 | |
| 12.7 | -0.2 | -0.1 | -0.2 | -0.2 | |
| 22.9 | -0.4 | -0.4 | -0.4 | -0.4 | |
| Mean equivalized disp. income | 27,796 | -14 | -35 | -31 | -52 |
| Mean disp. income,household level | 38,503 | 0 | -28 | -22 | -50 |
| 25,791 | 9 | -12 | -5 | -26 | |
| 24,254 | 29 | 9 | 19 | -2 | |
| 21,438 | 91 | 73 | 85 | 68 | |
-
Note: Inequality of the base situation and the change after the reform (Upper panel), with or without behavioural reactions and with Atkinson index with in equality aver-sion equal to 0.5, 1, or 2. The reform is made revenue neutral by levying an additional lump-sum tax to all individuals. The lower panel depicts social welfare and the change relative to the base situation.
Regression coefficients for male wage prediction.
| Males (y=log monthly wage) | Lone dwellers | Couples | Single parents | Two parent families | Others | |||||
|---|---|---|---|---|---|---|---|---|---|---|
| coeff | p-value | coeff | p-value | coeff | p-value | coeff | p-value | coeff | p-value | |
| Intercept | 7.455 | 0.000 | 7.200 | 0.000 | 7.710 | 0.000 | 6.863 | 0.000 | 7.642 | 0.000 |
| Age | 0.027 | 0.000 | 0.024 | 0.000 | 0.018 | 0.000 | 0.035 | 0.000 | 0.016 | 0.000 |
| Age2 | 0.000 | 0.000 | 0.000 | 0.000 | 0.000 | 0.003 | 0.000 | 0.000 | 0.000 | 0.000 |
| Field of education (ref. unknown or other) | ||||||||||
| Generic programmes | 0.129 | 0.019 | 0.392 | 0.000 | 0.001 | 0.997 | 0.477 | 0.000 | 0.285 | 0.000 |
| Education | -0.097 | 0.104 | 0.077 | 0.203 | -0.252 | 0.453 | 0.029 | 0.575 | 0.036 | 0.677 |
| Humanities and arts | -0.087 | 0.119 | 0.047 | 0.421 | -0.219 | 0.506 | 0.059 | 0.246 | 0.112 | 0.160 |
| Business and social sciences | 0.058 | 0.291 | 0.260 | 0.000 | -0.067 | 0.838 | 0.362 | 0.000 | 0.238 | 0.002 |
| Natural sciences. mathematics | 0.018 | 0.747 | 0.194 | 0.001 | -0.074 | 0.821 | 0.218 | 0.000 | 0.184 | 0.022 |
| Engineering and manufacturing | 0.115 | 0.034 | 0.308 | 0.000 | 0.018 | 0.957 | 0.368 | 0.000 | 0.284 | 0.000 |
| Agriculture and forestry | 0.033 | 0.558 | 0.183 | 0.002 | -0.028 | 0.931 | 0.254 | 0.000 | 0.174 | 0.028 |
| Health and welfare | 0.069 | 0.209 | 0.237 | 0.000 | -0.066 | 0.840 | 0.266 | 0.000 | 0.269 | 0.001 |
| Services | 0.056 | 0.307 | 0.254 | 0.000 | -0.042 | 0.897 | 0.300 | 0.000 | 0.242 | 0.002 |
| Level of education (ref. doctoral or equivalent) | ||||||||||
| Unknown or primary | -0.404 | 0.000 | -0.289 | 0.000 | -0.645 | 0.051 | -0.207 | 0.000 | -0.333 | 0.000 |
| Secondary | -0.471 | 0.000 | -0.533 | 0.000 | -0.619 | 0.000 | -0.527 | 0.000 | -0.547 | 0.000 |
| Post-secondary non-tertiary | -0.339 | 0.000 | -0.431 | 0.000 | -0.430 | 0.000 | -0.419 | 0.000 | -0.491 | 0.000 |
| Short-cycle tertiary | -0.306 | 0.000 | -0.312 | 0.000 | -0.373 | 0.000 | -0.295 | 0.000 | -0.350 | 0.000 |
| Master’s or equivalent | -0.087 | 0.000 | -0.062 | 0.001 | -0.058 | 0.302 | -0.017 | 0.210 | -0.138 | 0.001 |
| Ages of children | ||||||||||
| Less than 3 years (0/1) | -0.003 | 0.964 | -0.002 | 0.797 | -0.012 | 0.480 | ||||
| 3-6 years (0/1) | 0.020 | 0.525 | 0.004 | 0.421 | -0.042 | 0.006 | ||||
| 7-18 years (0/1) | -0.041 | 0.321 | -0.018 | 0.002 | -0.010 | 0.359 | ||||
| Region (ref. Lapland) | ||||||||||
| Uusimaa | 0.041 | 0.001 | 0.094 | 0.000 | 0.132 | 0.000 | 0.121 | 0.000 | 0.067 | 0.007 |
| Etelä-Savo | -0.076 | 0.000 | -0.069 | 0.000 | -0.059 | 0.168 | -0.059 | 0.000 | 0.007 | 0.859 |
| Pohjois-Savo | -0.056 | 0.000 | -0.040 | 0.005 | 0.011 | 0.770 | -0.042 | 0.001 | 0.020 | 0.549 |
| Pohjois-Karjala | -0.085 | 0.000 | -0.058 | 0.000 | -0.046 | 0.262 | -0.071 | 0.000 | -0.031 | 0.417 |
| Keski-Suomi | -0.044 | 0.003 | -0.028 | 0.045 | 0.003 | 0.941 | -0.017 | 0.162 | -0.012 | 0.709 |
| Etelä-Pohjanmaa | -0.084 | 0.000 | -0.072 | 0.000 | -0.030 | 0.455 | -0.089 | 0.000 | -0.067 | 0.067 |
| Pohjanmaa | -0.062 | 0.000 | -0.007 | 0.661 | 0.004 | 0.925 | -0.029 | 0.028 | -0.038 | 0.288 |
| Keski-Pohjanmaa | -0.048 | 0.035 | -0.033 | 0.120 | -0.008 | 0.884 | -0.033 | 0.058 | -0.053 | 0.276 |
| Pohjois-Pohjanmaa | -0.031 | 0.023 | -0.030 | 0.024 | -0.001 | 0.982 | -0.011 | 0.320 | 0.009 | 0.771 |
| Kainuu | -0.067 | 0.001 | -0.055 | 0.007 | 0.009 | 0.857 | -0.052 | 0.004 | 0.006 | 0.918 |
| Varsinais-Suomi | -0.042 | 0.002 | -0.012 | 0.344 | -0.015 | 0.648 | -0.016 | 0.151 | -0.030 | 0.289 |
| Satakunta | -0.012 | 0.425 | 0.009 | 0.524 | 0.054 | 0.132 | 0.003 | 0.790 | 0.023 | 0.490 |
| Kanta-Häme | -0.016 | 0.297 | -0.003 | 0.841 | 0.038 | 0.315 | 0.004 | 0.750 | 0.007 | 0.839 |
| Pirkanmaa | -0.049 | 0.000 | -0.005 | 0.703 | 0.032 | 0.319 | 0.004 | 0.731 | -0.024 | 0.404 |
| Päijät-Häme | -0.025 | 0.108 | -0.011 | 0.466 | 0.071 | 0.073 | -0.009 | 0.475 | -0.008 | 0.807 |
| Kymenlaakso | 0.022 | 0.164 | 0.051 | 0.001 | 0.077 | 0.057 | 0.017 | 0.209 | -0.009 | 0.805 |
| Etelä-Karjala | -0.013 | 0.451 | 0.013 | 0.415 | 0.082 | 0.066 | -0.008 | 0.617 | 0.003 | 0.945 |
| Months in unemployment during the year (ref. more than 8) | ||||||||||
| Less than 3 | 0.192 | 0.000 | 0.164 | 0.000 | 0.293 | 0.018 | 0.160 | 0.000 | 0.131 | 0.012 |
| 3-5 | 0.105 | 0.002 | 0.081 | 0.064 | 0.225 | 0.073 | 0.054 | 0.187 | 0.063 | 0.252 |
| 6-8 | 0.033 | 0.417 | -0.108 | 0.031 | 0.185 | 0.165 | 0.012 | 0.806 | 0.008 | 0.901 |
| Employment days | 0.063 | 0.000 | 0.076 | 0.000 | 0.074 | 0.000 | 0.076 | 0.000 | 0.052 | 0.000 |
| (100) in prev. year | ||||||||||
| Existing debt (0/1) | 0.113 | 0.000 | 0.082 | 0.000 | 0.135 | 0.000 | 0.096 | 0.000 | 0.121 | 0.000 |
| Married (0/1) | 0.066 | 0.000 | 0.027 | 0.000 | 0.081 | 0.000 | 0.045 | 0.000 | 0.060 | 0.000 |
| Income of other hh members (log €) | 0.007 | 0.000 | -0.005 | 0.001 | 0.018 | 0.000 | 0.002 | 0.049 | ||
Regression coefficients for female wage prediction.
| Females (y=log monthly wage) | Lone dwellers | Couples | Single parents | Two parent families | Others | |||||
|---|---|---|---|---|---|---|---|---|---|---|
| coeff | p-value | coeff | p-value | coeff | p-value | coeff | p-value | coeff | p-value | |
| Intercept | 7.522 | 0.000 | 7.385 | 0.000 | 7.459 | 0.000 | 7.130 | 0.000 | 7.591 | 0.000 |
| Age | 0.016 | 0.000 | 0.016 | 0.000 | 0.015 | 0.000 | 0.022 | 0.000 | 0.008 | 0.000 |
| Age2 | 0.000 | 0.000 | 0.000 | 0.000 | 0.000 | 0.000 | 0.000 | 0.000 | 0.000 | 0.113 |
| Field of education (ref. unknown or other) | ||||||||||
| Generic programmes | 0.372 | 0.000 | 0.338 | 0.000 | 0.259 | 0.000 | 0.399 | 0.000 | 0.408 | 0.000 |
| Education | 0.216 | 0.002 | 0.172 | 0.002 | 0.024 | 0.733 | 0.117 | 0.008 | 0.272 | 0.000 |
| Humanities and arts | 0.201 | 0.004 | 0.157 | 0.004 | 0.046 | 0.520 | 0.143 | 0.001 | 0.261 | 0.000 |
| Business and social sciences | 0.325 | 0.000 | 0.282 | 0.000 | 0.192 | 0.006 | 0.295 | 0.000 | 0.372 | 0.000 |
| Natural sciences. mathematics | 0.286 | 0.000 | 0.257 | 0.000 | 0.164 | 0.026 | 0.232 | 0.000 | 0.359 | 0.000 |
| Engineering and manufacturing | 0.349 | 0.000 | 0.313 | 0.000 | 0.234 | 0.001 | 0.346 | 0.000 | 0.366 | 0.000 |
| Agriculture and forestry | 0.257 | 0.000 | 0.247 | 0.000 | 0.115 | 0.115 | 0.222 | 0.000 | 0.288 | 0.000 |
| Health and welfare | 0.339 | 0.000 | 0.275 | 0.000 | 0.170 | 0.016 | 0.253 | 0.000 | 0.383 | 0.000 |
| Services | 0.249 | 0.000 | 0.192 | 0.000 | 0.104 | 0.141 | 0.195 | 0.000 | 0.301 | 0.000 |
| Level of education (ref. doctoral or equivalent) | ||||||||||
| Unknown or primary | -0.338 | 0.000 | -0.435 | 0.000 | -0.481 | 0.000 | -0.400 | 0.000 | -0.398 | 0.000 |
| Secondary | -0.607 | 0.000 | -0.669 | 0.000 | -0.593 | 0.000 | -0.639 | 0.000 | -0.695 | 0.000 |
| Post-secondary non-tertiary | -0.503 | 0.000 | -0.556 | 0.000 | -0.499 | 0.000 | -0.532 | 0.000 | -0.568 | 0.000 |
| Short-cycle tertiary | -0.448 | 0.000 | -0.500 | 0.000 | -0.416 | 0.000 | -0.477 | 0.000 | -0.540 | 0.000 |
| Master’s or equivalent | -0.162 | 0.000 | -0.192 | 0.000 | -0.091 | 0.001 | -0.147 | 0.000 | -0.240 | 0.000 |
| Ages of children | ||||||||||
| Less than 3 years (0/1) | 0.064 | 0.001 | 0.072 | 0.000 | -0.021 | 0.264 | ||||
| 3-6 years (0/1) | 0.021 | 0.044 | 0.023 | 0.000 | 0.005 | 0.729 | ||||
| 7-18 years (0/1) | 0.011 | 0.433 | 0.016 | 0.005 | -0.012 | 0.242 | ||||
| Region (ref. Lapland) | ||||||||||
| Uusimaa | 0.085 | 0.000 | 0.116 | 0.000 | 0.142 | 0.000 | 0.108 | 0.000 | 0.097 | 0.000 |
| Etelä-Savo | -0.017 | 0.320 | -0.029 | 0.022 | 0.014 | 0.575 | -0.022 | 0.085 | -0.001 | 0.987 |
| Pohjois-Savo | -0.027 | 0.075 | -0.006 | 0.560 | 0.030 | 0.170 | 0.007 | 0.546 | -0.002 | 0.940 |
| Pohjois-Karjala | -0.044 | 0.013 | -0.019 | 0.120 | 0.017 | 0.491 | -0.014 | 0.262 | -0.007 | 0.819 |
| Keski-Suomi | -0.040 | 0.008 | -0.014 | 0.190 | 0.005 | 0.810 | -0.024 | 0.025 | 0.009 | 0.749 |
| Etelä-Pohjanmaa | -0.026 | 0.117 | -0.019 | 0.121 | 0.009 | 0.698 | -0.031 | 0.006 | -0.009 | 0.767 |
| Pohjanmaa | -0.053 | 0.002 | -0.022 | 0.070 | 0.043 | 0.080 | -0.046 | 0.000 | -0.054 | 0.070 |
| Keski-Pohjanmaa | -0.032 | 0.174 | -0.024 | 0.146 | 0.005 | 0.864 | -0.049 | 0.002 | 0.015 | 0.713 |
| Pohjois-Pohjanmaa | -0.040 | 0.004 | 0.000 | 0.999 | 0.009 | 0.641 | -0.004 | 0.659 | 0.016 | 0.537 |
| Kainuu | -0.044 | 0.045 | -0.023 | 0.134 | 0.030 | 0.363 | 0.001 | 0.936 | -0.109 | 0.014 |
| Varsinais-Suomi | -0.011 | 0.380 | 0.018 | 0.074 | 0.034 | 0.074 | 0.012 | 0.198 | 0.012 | 0.612 |
| Satakunta | -0.023 | 0.134 | -0.006 | 0.604 | 0.017 | 0.429 | -0.003 | 0.772 | -0.026 | 0.378 |
| Kanta-Häme | 0.007 | 0.663 | 0.030 | 0.009 | 0.065 | 0.004 | 0.029 | 0.011 | 0.018 | 0.552 |
| Pirkanmaa | -0.012 | 0.364 | 0.017 | 0.082 | 0.053 | 0.005 | -0.004 | 0.648 | -0.009 | 0.701 |
| Päijät-Häme | -0.013 | 0.379 | 0.014 | 0.228 | 0.050 | 0.023 | -0.003 | 0.770 | 0.005 | 0.856 |
| Kymenlaakso | -0.007 | 0.643 | 0.002 | 0.852 | 0.023 | 0.316 | 0.004 | 0.750 | 0.002 | 0.948 |
| Etelä-Karjala | -0.013 | 0.460 | 0.001 | 0.960 | 0.019 | 0.452 | -0.013 | 0.306 | -0.013 | 0.730 |
| Months in unemployment during the year (ref. more than 8) | ||||||||||
| Less than 3 | 0.013 | 0.796 | 0.042 | 0.462 | 0.059 | 0.418 | 0.038 | 0.509 | 0.109 | 0.207 |
| 3-5 | -0.043 | 0.402 | -0.007 | 0.901 | -0.034 | 0.646 | -0.028 | 0.628 | 0.084 | 0.348 |
| 6-8 | -0.129 | 0.039 | -0.116 | 0.088 | -0.081 | 0.397 | -0.109 | 0.124 | -0.089 | 0.390 |
| Employment days | 0.062 | 0.000 | 0.058 | 0.000 | 0.053 | 0.000 | 0.048 | 0.000 | 0.057 | 0.000 |
| (100) in prev. year | ||||||||||
| Existing debt (0/1) | 0.079 | 0.000 | 0.062 | 0.000 | 0.103 | 0.000 | 0.068 | 0.000 | 0.075 | 0.000 |
| Married (0/1) | 0.023 | 0.015 | 0.007 | 0.048 | -0.009 | 0.386 | -0.002 | 0.572 | -0.014 | 0.102 |
| Income of other hh members (log €) | 0.015 | 0.000 | -0.003 | 0.000 | 0.016 | 0.000 | 0.000 | 0.964 | ||
Heterogeneous weights for participation elasticity
| Women | Men | ||
|---|---|---|---|
| Age of the youngest children | Over 17 years or no children | 1.28 | 0.92 |
| under 3 years old | 1.32 | 0.92 | |
| 3 to 7 years old | 1 | 0.68 | |
| 8 to 17 years old | 0.84 | 0.56 |
-
Source: Own calculations based on Kotamäki and Kärkkäinen (2018)
Data and code availability
Due to data protection regulations of the national register-holders providing the data, we are not allowed to make the data available to third parties. This restriction does not apply to the actual SISU model, which is available freely. Interested researchers can obtain access to the data and model by following the instructions provided at https://stat.fi/tup/mikrosimulointi/kayttoonotto_en.html or by contacting Statistics Finland.